PinMetrics MT4
- Indicateurs
-
Liam Alex Thomas Webb
 Salut, je suis Liam — et oui, j’ai accidentellement mis mes prénoms dans la case du prénom (un classique, je sais).
 - Version: 1.0
- Activations: 10
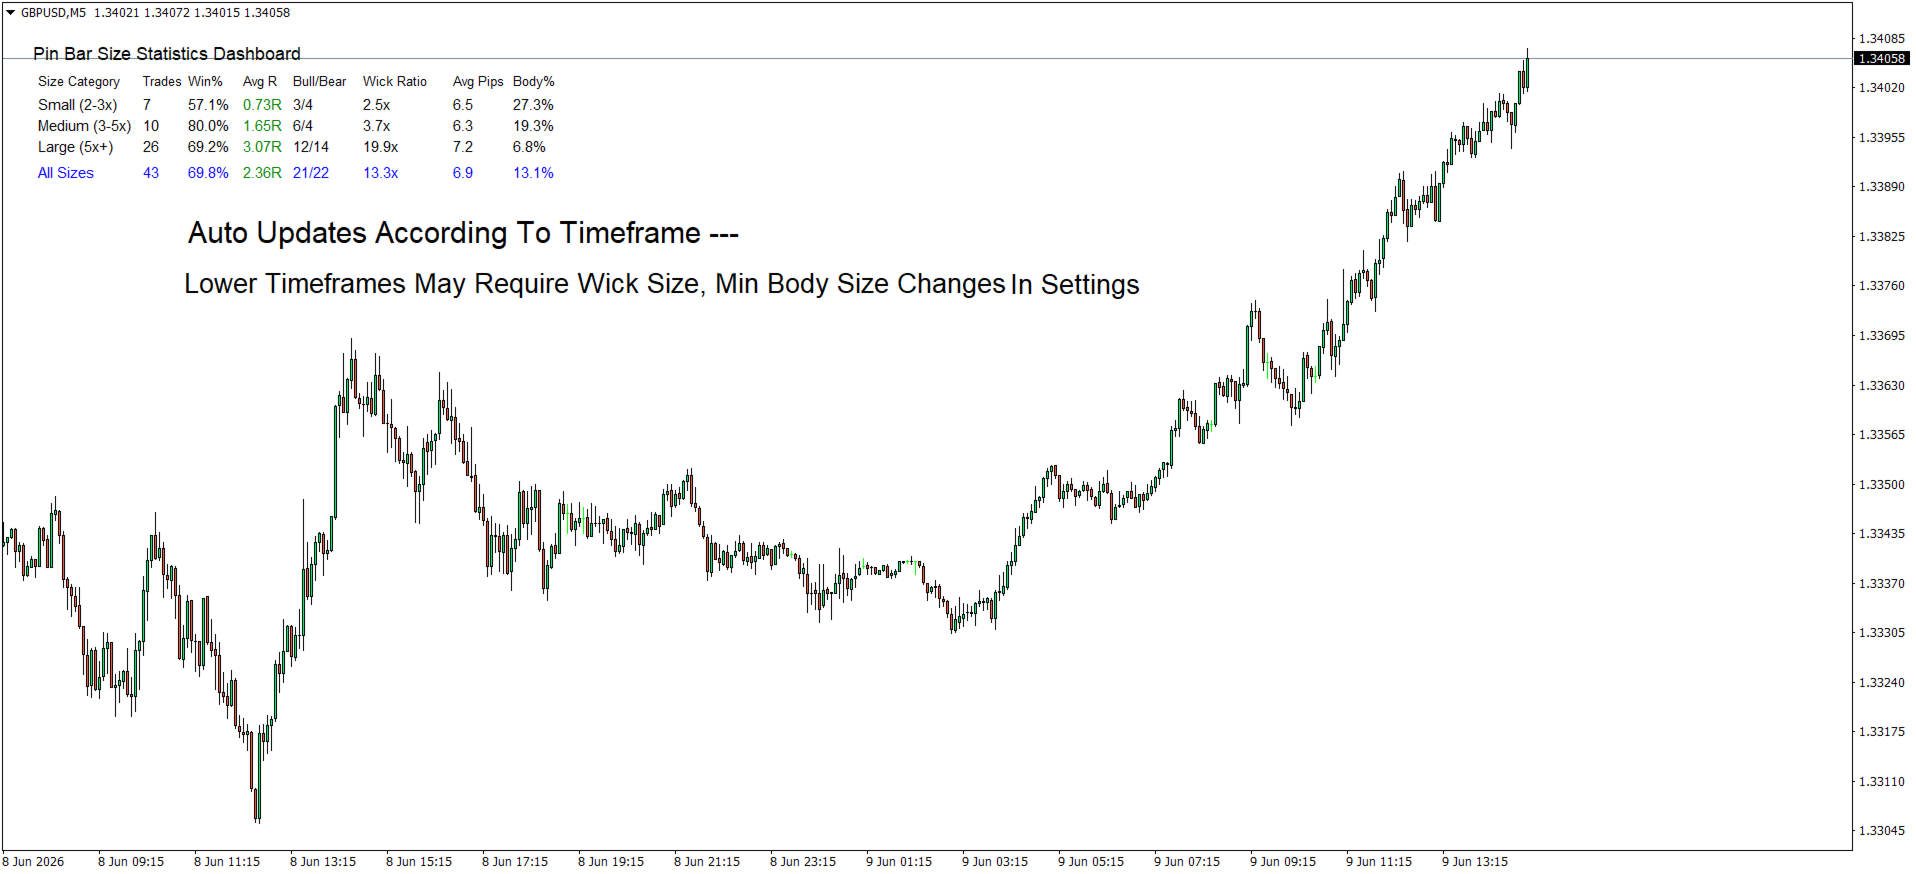
PinMetrics Size Statistics Dashboard | Wick Ratio Analysis | Performance Metrics
Stop guessing which pin bars work. Let the data reveal the edge.
Overview
PinMetrics is a professional MetaTrader 4 indicator that automatically detects and analyzes pin bar patterns, categorizing them by wick-to-body ratio. It provides comprehensive performance statistics for each size category, helping traders identify which pin bar patterns offer the most reliable trading opportunities.
Not all pin bars are created equal. PinMetrics tells you exactly which size category has the highest win rate and best R-multiple on your current pair and timeframe.
Key Features
| Feature | Benefit |
|---|---|
| Size-Based Classification | Automatically sorts pin bars into Small (2-3x), Medium (3-5x), and Large (5x+) based on wick-to-body ratio |
| Real-Time Statistics Dashboard | Displays Trades, Win %, Avg R, Bull/Bear ratio, Wick Ratio, Avg Pips, and Body % for each category |
| Direction Detection | Automatically identifies bullish (hammer) vs bearish (shooting star) pin bars |
| Volume Confirmation Option | Optionally require higher volume on pin bars – stronger rejection signals |
| Risk Management Integration | Configure risk percentage per trade for position sizing context |
| Adjustable Thresholds | Customize wick ratio boundaries, min bar size, and detection sensitivity |
| Clean Dashboard Layout | Professional table format with color-coded R-multiples (green for positive, red for negative) |
| "All Sizes" Summary Row | Overall performance across all detected patterns |
| Auto-Detection | Scans up to 1000 bars and updates automatically on each new bar |
Dashboard Breakdown
| Column | Description |
|---|---|
| Size Category | Small (2-3x) / Medium (3-5x) / Large (5x+) |
| Trades | Number of pin bars detected in this category |
| Win % | Percentage of patterns that resulted in profitable moves |
| Avg R | Average risk multiple (green for positive, red for negative) |
| Bull/Bear | Bullish pin bars vs bearish pin bars |
| Wick Ratio | Average wick length relative to body (e.g., 4.2x) |
| Avg Pips | Average total bar size in pips |
| Body % | Average body as % of total range (lower = cleaner rejection) |
Pin Bar Detection Criteria
| Condition | Requirement |
|---|---|
| Small body | Body occupies ≤33% of total bar range |
| Long wick | Dominant wick comprises ≥60% of total range |
| Direction | Long lower wick = Bullish (Hammer) / Long upper wick = Bearish (Shooting Star) |
| Minimum size | Configurable minimum bar size in pips (default: 10 pips) |
| Volume confirmation | Optional – requires higher volume than previous bar |
Size Classification System
| Category | Wick Ratio | Description | Typical Performance |
|---|---|---|---|
| Small | 2–3x | Moderate wick extension | Baseline win rate |
| Medium | 3–5x | Significant wick extension | Higher win rate & R |
| Large | 5x+ | Extreme wick extension | Highest win rate & R-multiple |
Why Larger Wick Ratios Perform Better
| Factor | Small (2-3x) | Medium (3-5x) | Large (5x+) |
|---|---|---|---|
| Rejection force | Moderate | Strong | Extreme |
| Stop loss distance | Tighter | Moderate | Wider |
| Risk-reward potential | 1.5-2.5R | 2-4R | 3-6R |
| Typical win rate | 50-60% | 55-65% | 60-70% |
| Best timeframe | Lower (M15-H1) | Higher (H1-H4) | Highest (H4-Daily) |
Input Parameters (MT4)
Dashboard Settings
| Parameter | Default | Description |
|---|---|---|
| DashboardX | 20 | Horizontal position (pixels from left edge) |
| DashboardY | 30 | Vertical position (pixels from top edge) |
| DashboardColor | White | Dashboard background color |
| TextColor | Black | Text color for dashboard content |
| FontSize | 9 | Base font size |
Pin Bar Pattern Settings
| Parameter | Default | Description |
|---|---|---|
| SmallWickRatio | 2.0 | Small pin bar threshold (wick ≥2× body) |
| MediumWickRatio | 3.0 | Medium pin bar threshold (wick ≥3× body) |
| LargeWickRatio | 5.0 | Large pin bar threshold (wick ≥5× body) |
| MaxBodyRatio | 0.33 | Maximum body as % of total range (33%) |
| MinWickPercentage | 0.60 | Minimum dominant wick as % of total range (60%) |
| RequireVolumeConfirmation | false | Require higher volume on pin bar |
| MinPinBarSizePips | 10.0 | Minimum pin bar total size in pips |
Risk Management
| Parameter | Default | Description |
|---|---|---|
| RiskPercentage | 1.0 | Risk per trade as % of account balance |
| MaxHistoryBars | 1000 | Maximum bars to analyze |
How to Use PinMetrics
Step 1: Attach to Chart
Drag PinMetrics onto any MT4 chart (recommended: H1, H4, or Daily).
Step 2: Let It Scan
The indicator automatically scans up to 1000 bars and categorizes every pin bar it finds.
Step 3: Read the Dashboard
Look for the category with the highest win rate and best Avg R:
-
Large (5x+) category showing 66% win rate and +2.10R? → Prioritize those setups.
-
Small (2-3x) category showing 45% win rate? → Be selective or avoid.
Step 4: Trade with Context
Strongest pin bars occur when:
-
Forming at key support/resistance levels
-
Following a strong trend (counter-trend pin bars)
-
Aligned with higher timeframe bias
-
Accompanied by volume spikes
Practical Trading Applications
Entry
-
Bullish pin bar at support → Buy on break of the pin bar's high
-
Bearish pin bar at resistance → Sell on break of the pin bar's low
Stop Loss
Place stop loss beyond the pin bar's extreme (the wick tip).
Take Profit Targets
-
1st target – Recent swing high/low
-
2nd target – Next support/resistance level
-
3rd target – 2× risk amount (minimum for valid setup)
Position Sizing
Risk Amount = Account Balance × (RiskPercentage / 100) Position Size = Risk Amount ÷ Stop Loss Distance (in pips × pip value)
False Signal Warning Signs
| Sign | Why It's Weak |
|---|---|
| Pin bar in middle of a range | No clear rejection level |
| Very small total range (<10 pips) | Not enough momentum |
| Equal wicks on both sides | Indecision, not rejection |
| Low volume (if confirmation enabled) | May be random noise |
| Against higher timeframe trend | Lower probability of follow-through |
Troubleshooting
| Problem | Solution |
|---|---|
| No pin bars detected | Lower MinPinBarSizePips or check chart timeframe (H1+ recommended) |
| Dashboard not showing | Adjust DashboardX / DashboardY values |
| Volume confirmation too strict | Set RequireVolumeConfirmation = false |
| Too many/few patterns | Adjust MaxBodyRatio or MinWickPercentage |
| Small timeframe noise | Switch to H1, H4, or Daily for cleaner patterns |
Installation (MT4)
-
Download PinMetrics.mq4 or .ex4
-
In MT5: File → Open Data Folder → MQL5 → Indicators
-
Copy the file into the Indicators folder
-
Restart MT5 or right-click in Navigator → Refresh
-
Drag PinMetrics onto your chart
License
This indicator is provided for educational and personal trading use only. Redistribution or commercial use without permission is prohibited.
PinMetrics – Measure. Analyze. Trade with data.