PinMetrics MT4

PinMetrics Size Statistics Dashboard | Wick Ratio Analysis | Performance Metrics

Stop guessing which pin bars work. Let the data reveal the edge.

Overview

PinMetrics is a professional MetaTrader 4 indicator that automatically detects and analyzes pin bar patterns, categorizing them by wick-to-body ratio. It provides comprehensive performance statistics for each size category, helping traders identify which pin bar patterns offer the most reliable trading opportunities.

Not all pin bars are created equal. PinMetrics tells you exactly which size category has the highest win rate and best R-multiple on your current pair and timeframe.

Key Features

Feature Benefit
Size-Based Classification Automatically sorts pin bars into Small (2-3x), Medium (3-5x), and Large (5x+) based on wick-to-body ratio
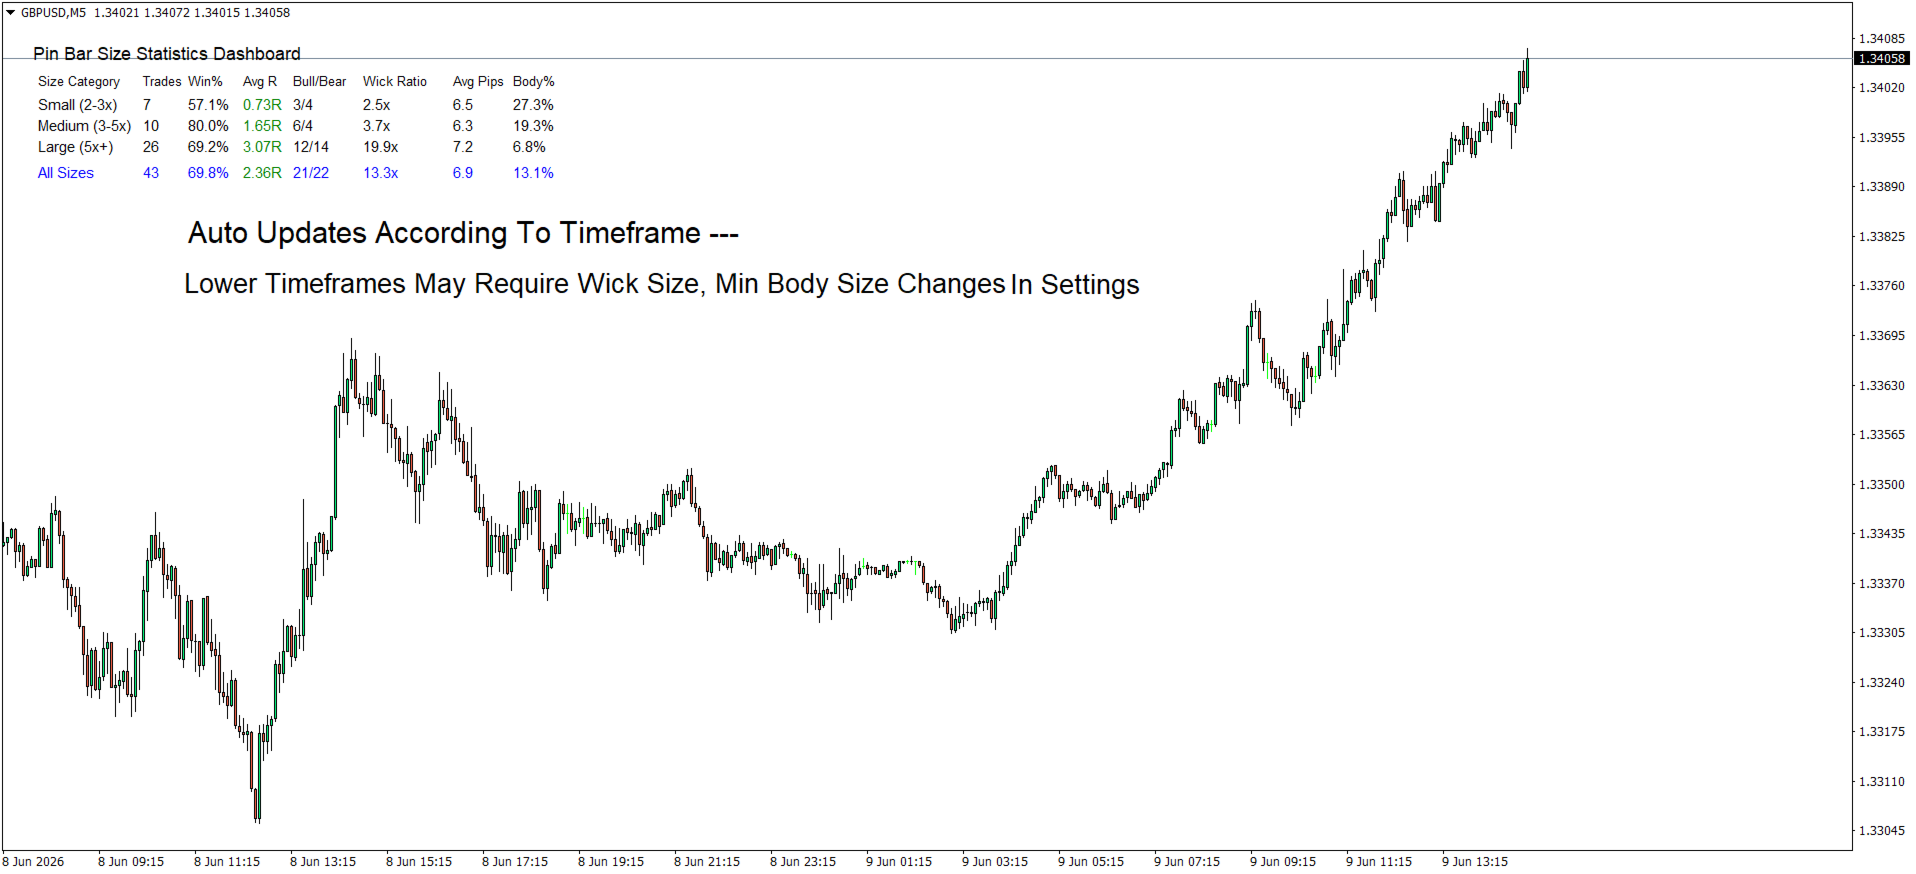
Real-Time Statistics Dashboard Displays Trades, Win %, Avg R, Bull/Bear ratio, Wick Ratio, Avg Pips, and Body % for each category
Direction Detection Automatically identifies bullish (hammer) vs bearish (shooting star) pin bars
Volume Confirmation Option Optionally require higher volume on pin bars – stronger rejection signals
Risk Management Integration Configure risk percentage per trade for position sizing context
Adjustable Thresholds Customize wick ratio boundaries, min bar size, and detection sensitivity
Clean Dashboard Layout Professional table format with color-coded R-multiples (green for positive, red for negative)
"All Sizes" Summary Row Overall performance across all detected patterns
Auto-Detection Scans up to 1000 bars and updates automatically on each new bar

Dashboard Breakdown

Column Description
Size Category Small (2-3x) / Medium (3-5x) / Large (5x+)
Trades Number of pin bars detected in this category
Win % Percentage of patterns that resulted in profitable moves
Avg R Average risk multiple (green for positive, red for negative)
Bull/Bear Bullish pin bars vs bearish pin bars
Wick Ratio Average wick length relative to body (e.g., 4.2x)
Avg Pips Average total bar size in pips
Body % Average body as % of total range (lower = cleaner rejection)

Pin Bar Detection Criteria

Condition Requirement
Small body Body occupies ≤33% of total bar range
Long wick Dominant wick comprises ≥60% of total range
Direction Long lower wick = Bullish (Hammer) / Long upper wick = Bearish (Shooting Star)
Minimum size Configurable minimum bar size in pips (default: 10 pips)
Volume confirmation Optional – requires higher volume than previous bar

Size Classification System

Category Wick Ratio Description Typical Performance
Small 2–3x Moderate wick extension Baseline win rate
Medium 3–5x Significant wick extension Higher win rate & R
Large 5x+ Extreme wick extension Highest win rate & R-multiple

Why Larger Wick Ratios Perform Better

Factor Small (2-3x) Medium (3-5x) Large (5x+)
Rejection force Moderate Strong Extreme
Stop loss distance Tighter Moderate Wider
Risk-reward potential 1.5-2.5R 2-4R 3-6R
Typical win rate 50-60% 55-65% 60-70%
Best timeframe Lower (M15-H1) Higher (H1-H4) Highest (H4-Daily)

Input Parameters (MT4)

Dashboard Settings

Parameter Default Description
DashboardX 20 Horizontal position (pixels from left edge)
DashboardY 30 Vertical position (pixels from top edge)
DashboardColor White Dashboard background color
TextColor Black Text color for dashboard content
FontSize 9 Base font size

Pin Bar Pattern Settings

Parameter Default Description
SmallWickRatio 2.0 Small pin bar threshold (wick ≥2× body)
MediumWickRatio 3.0 Medium pin bar threshold (wick ≥3× body)
LargeWickRatio 5.0 Large pin bar threshold (wick ≥5× body)
MaxBodyRatio 0.33 Maximum body as % of total range (33%)
MinWickPercentage 0.60 Minimum dominant wick as % of total range (60%)
RequireVolumeConfirmation false Require higher volume on pin bar
MinPinBarSizePips 10.0 Minimum pin bar total size in pips

Risk Management

Parameter Default Description
RiskPercentage 1.0 Risk per trade as % of account balance
MaxHistoryBars 1000 Maximum bars to analyze

How to Use PinMetrics

Step 1: Attach to Chart

Drag PinMetrics onto any MT4 chart (recommended: H1, H4, or Daily).

Step 2: Let It Scan

The indicator automatically scans up to 1000 bars and categorizes every pin bar it finds.

Step 3: Read the Dashboard

Look for the category with the highest win rate and best Avg R:

  • Large (5x+) category showing 66% win rate and +2.10R? → Prioritize those setups.

  • Small (2-3x) category showing 45% win rate? → Be selective or avoid.

Step 4: Trade with Context

Strongest pin bars occur when:

  • Forming at key support/resistance levels

  • Following a strong trend (counter-trend pin bars)

  • Aligned with higher timeframe bias

  • Accompanied by volume spikes

Practical Trading Applications

Entry

  • Bullish pin bar at support → Buy on break of the pin bar's high

  • Bearish pin bar at resistance → Sell on break of the pin bar's low

Stop Loss

Place stop loss beyond the pin bar's extreme (the wick tip).

Take Profit Targets

  • 1st target – Recent swing high/low

  • 2nd target – Next support/resistance level

  • 3rd target – 2× risk amount (minimum for valid setup)

Position Sizing

text

Risk Amount = Account Balance × (RiskPercentage / 100) Position Size = Risk Amount ÷ Stop Loss Distance (in pips × pip value)

False Signal Warning Signs

Sign Why It's Weak
Pin bar in middle of a range No clear rejection level
Very small total range (<10 pips) Not enough momentum
Equal wicks on both sides Indecision, not rejection
Low volume (if confirmation enabled) May be random noise
Against higher timeframe trend Lower probability of follow-through

Troubleshooting

Problem Solution
No pin bars detected Lower  MinPinBarSizePips  or check chart timeframe (H1+ recommended)
Dashboard not showing Adjust  DashboardX  /  DashboardY  values
Volume confirmation too strict Set  RequireVolumeConfirmation = false
Too many/few patterns Adjust  MaxBodyRatio  or  MinWickPercentage
Small timeframe noise Switch to H1, H4, or Daily for cleaner patterns

Installation (MT4)

  1. Download  PinMetrics.mq4  or  .ex4

  2. In MT5: File → Open Data Folder → MQL5 → Indicators

  3. Copy the file into the Indicators folder

  4. Restart MT5 or right-click in Navigator → Refresh

  5. Drag PinMetrics onto your chart

License

This indicator is provided for educational and personal trading use only. Redistribution or commercial use without permission is prohibited.

PinMetrics – Measure. Analyze. Trade with data. 


Önerilen ürünler
Ölçekleme okları yeniden çizilmez - grafikte fiyat dönüş noktalarını gösteren ve sinyallerini yeniden çizmeyen bir gösterge. Ayrıca gösterge, tüccara E-posta ve Push yoluyla sinyaller gönderir. Bu göstergenin sinyallerinin doğruluğu, M5 zaman diliminde yaklaşık %92-94 ve H1 zaman diliminde %95'ten fazladır. Böylece, bu gösterge, tüccarın işlemleri doğru bir şekilde açmasına ve daha fazla fiyat hareketini tahmin etmesine olanak tanır. Grafikteki fiyat dönüş noktaları, her tüccar için basit ve an
DoAid
Samuel Akinbowale
5 (1)
DoAid DoAid indicator is a simple channel indicator with an advance timeframe correlation board. DoAid indicator: can be used with any instrument provided by your broker and MetaTrader, be it Currency , Commodity ,Stock, or Cryptocurrencies. DoAid indicator   can be used for swing, scalping and day trading. DoAid indicator   is also a multi time-frame indicator {MTF}. DoAid indicator can be used with any timeframe. It does not repaint.It does not repaint. When To Buy if the market price is
FiboZag
Andriy Sydoruk
Indicator FiboZag - transfer the indicator to the chart and the Fibonacci levels will be built automatically on the last ZigZag turn. The main advantage lies in the correct construction of Fibonacci levels and markup of price levels. Simple, visual and effective use. The indicator is not redrawn and does not lag. Works on all currency pairs and on all timeframes.
Some informations on the chart with the single attachment. RangeBorder Buy Sell (RBBS) Non Repaint Indicator will provide trend line, buy sell arrows,reversal arrows, range channel, order exit area,high average price line and low average price line.All arrows and lines don't repaint and not lagging. Once candle closed it won't  repaint. Reading Indicator: 1. Small Stars , Indicates oversold and overbought with certain logic and price may reverse when this small star triggers. Useful to identify
Limitless MT4
Dmitriy Kashevich
Limitless MT4 is a universal indicator suitable for every beginner and experienced trader. works on all currency pairs, cryptocurrencies, raw stocks Limitless MT4 - already configured and does not require additional configuration And now the main thing Why Limitless MT4? 1 complete lack of redrawing 2 two years of testing by the best specialists in trading 3 the accuracy of correct signals exceeds 80% 4 performed well in trading during news releases Trading rules 1 buy signal - the ap
FluxGate Precision, MetaTrader 4 için yeniden çizim yapmayan Fibonacci tabanlı bir trend tespit göstergesidir. Geçmiş mum grafiklerinin kayan analiz penceresini (varsayılan: 44 bar) tarar, bu penceredeki en yüksek yüksek ve en düşük düşüğü hesaplar ve üç dinamik Fibonacci seviyesi——Fib High eşiği, %50 Trend Çizgisi ve Fib Low eşiği——oluşturur. Onaylanmış barın kapanışı hem Trend Çizgisi hem de Fib High seviyesinin üzerine çıktığında, yükseliş yönünde bir trend değişimine işaret eden bir alım sin
This tool is designed specifically for traders seeking to identify market reversals, allowing you to capitalize on advantageous trading opportunities. The indicator has undergone extensive testing and has established itself as a leading indicator; it often predicts market movements effectively. When a buy or sell signal is generated by the indicator, it tends to align with the market’s subsequent behavior, following the trend indicated by the signal. By utilizing this indicator, you can enhance
PLUTO MASTER TURTLE (Binary Option)   The indicator allows you to trade binary options. The recommended timeframe is М5 and the expiration time is 5 minutes. The indicator works on any currency pairs. Trading time is not limited. A possible signal is specified as a arrow above/under a candle. If the arrow remains on the previous candle, you can enter the trade immediately. Arrows are not re-painted! The trading strategy is based on the correlation of the statistical RSI, STO and Candlestick body
MoveWave
Andriy Sydoruk
MoveWave - Moving waves are very handy indicators for determining pivot levels. Most Forex traders make decisions based on technical analysis. This type of analysis determines patterns and trends in the market. With the help of complex mathematical equations that are combined and made out in the form of this indicator, the trader will be able to more accurately determine the price reversal levels. Wave theory mathematically represents various behavioral models of the market. It is used as the ba
Boba Binary
Anthonius Soruh
5 (1)
Result look on  https://t.me/BonosuProBinary Pair : All Forex Pairs Time Frame : M1 Expaired : 1-2 Minutes Trade Time Once Time a Day Backtester, Alert Avaliable Average Signals Generate 5 - 20 Signals All Pair A Day Broker Time Zone GMT+3 Default Setting [Example Broker GMT+3 : Alpari, FBS, XM] Support Broker : Deriv, IQOption, Alpari, Binomo, Olymtrade, Qoutex, GCoption, etc Support Auto Trading : MT2 Trading, Binary Bot, Intrade Bot, Binomo Bot, Olymptrad Bot, MX2 trading, Price Pro, etc Ind
Cota Binary
Anthonius Soruh
5 (2)
Result look on  https://t.me/BonosuProBinary Pair : All Forex Pairs Time Frame : M1 Expaired : 1-2 Minutes Trade Time Once Time a Day Backtester, Alert Avaliable Average Signals Generate 5 - 20 Signals All Pair A Day Broker Time Zone GMT+3 Default Setting [Example Broker GMT+3 : Alpari, FBS, XM] Support Broker : Deriv, IQOption, Alpari, Binomo, Olymtrade, Qoutex, GCoption, etc Support Auto Trading : MT2 Trading, Binary Bot, Intrade Bot, Binomo Bot, Olymptrad Bot, MX2 trading, Price Pro, etc Ind
ReversalZones Pro — Dinamik Günlük Volatilite ve Dönüş Bölgesi İndikatörü ReversalZones Pro , MetaTrader 4 için tasarlanmış, kurumsal düzeyde gün içi volatilite ve pivot projeksiyon göstergesidir. Hareketli ortalamalar veya osilatörler gibi geleneksel gecikmeli (lagging) indikatörlerin aksine ReversalZones, günlük istatistiksel genişleme ve Fibonacci oranlarına dayanarak her işlem gününün başında olası arz, talep ve ortalamaya dönüş bölgelerini önceden hesaplar. İster aşırı alım/satım noktaların
Parabolik SAR ve Destek/Direnç Seviyeleri, forex ticaretinde potansiyel trend dönüşlerini ve giriş ve çıkış noktalarını belirlemek için kullanılan bir teknik analiz göstergesi olmakla kalmayıp aynı zamanda hazır bir otonom ticaret stratejisidir. Gösterge, grafiğe dinamik destek ve direnç seviyeleri ekleyerek PSAR göstergesini temel alır ve bu da yatırımcıların piyasanın potansiyel olarak tersine dönebileceği önemli fiyat seviyelerini belirlemesine yardımcı olabilir. Yatırımcılar bu göstergeyi
TrendBand Navigator Pro – Non-Repainting Multi-Timeframe Trading System Powered by proprietary multi-dimensional trend band algorithm delivering clear arrow signals Big Arrows Define Direction Small Arrows Capture Entries   Core Advantages   Intelligent Noise Filtering Volatility-adaptive technology avoids false breakouts, triggers arrows only during strong trends   Multi-Timeframe Compatibility Automatically adapts from 1-minute to monthly charts for all trading strategies   Vis
Description Complete breaker market maker Key zones indicator, It provides precise zones where could be an excellent break or reversal opportunity. KEY LINKS:   How to Install  -  Frequent Questions  -  All Products  How is this indicator useful? It will allow you to trade retracement or breakout patterns, every time they occur in a given zone. NEVER repaints. It signals clear possible money management levels as stop and take profit. You’ll be able to identify potential resistance or support lev
Индикатор канала с адаптивной шириной, который помогает видеть перекупленность/перепроданность , пробои границ и даёт стрелочные сигналы Buy/Sell с аккуратными оповещениями без спама . Индикатор подходит для: скальпинга и внутридневной торговли; поиска точек отката от границ канала; торговли пробоев (breakout) и возвратов (re-entry); ручной торговли и полуавтоматизации через алерты. Как работает индикатор Сглаживание (Nadaraya-Watson) Строится “умная” сглаженная линия цены (ядровая регрессия с
Auto Trendline Channel MTF draws trendlines, parallel channels and horizontal support / resistance automatically from confirmed swing highs and lows. For each line it records the touch count, close breaks, wick breaks and retests. A table shows, for the chart timeframe and two higher timeframes, the nearest line above and below the price, the distance to it and the Dow theory direction. Touch counts and break records describe what happened on the past chart. They do not tell whether price will
Super trend is one of the best trend indicators in metatrader 4 (MT4). Triple SuperTrend indicator is an indicator that consist of three super trend indicator that can be aranged. This indicator is built by mql4 language and doesn't provided by MT4 platform. Highly recommended using EMA SuperTrend Strategy Indicator if you want to get better result in here: https://www.mql5.com/en/market/product/91664 This indicator is easy to use, power full and has many benefits, there are: Using three indic
FREE
Retracement Feeder
Innovicient Limited
5 (1)
The Retracement Feeder checks for retracement opportunities after the first move has occurred.  Basically it scans for the second wave of trend. Works with any financial instrument,  It does not repaint/change color or cancel arrows, Easy to set and use. Works great with Renko Charts ____________________________________________________ MT5 version  |  Best used with  Market Heart MT4  Version| How it works The indicator is based on RSI and Stochastics.  The algorithm used in the Retracement
Notifications outside of Bollinger Bands: Send phone Notification and window alerts when price breaks out of Bollinger bands Low & High. You can set the value Alert, Notification. And On OFF    Alert on Terminal,    Notification on Smartphone. Notifications - Client Terminal Settings - MetaTrader 4 Help How to Setup MT4/MT5 Mobile Alerts Right to Your Phone (forexschoolonline.com)
The indicator allows you to trade binary options. The recommended time frame is М1 and the expiration time is 1,2,3 minutes. The indicator suitable for auto and manual trading. A possible signal is specified as a arrows above/under a candle. You should wait until the candle closes! Arrows are not re-painted Trade sessions: TOKYO section (Half-end) Currency pairs: USD/JPY Working time frame: M1 Expiration time: 1,2,3 minutes. The indicator also shows good results when using the martingale strateg
FREE
FIBOChannels
Hafis Mohamed Yacine
Fibonacci Channel What is a Fibonacci Channel? The Fibonacci channel is a technical analysis tool that is used to estimate support and resistance levels based on the Fibonacci numbers. It is a variation of the Fibonacci retracement tool, except with the channel the lines run diagonally rather than horizontally. It can be applied to both short-term and long-term trends, as well as to uptrend and downtrends. Lines are drawn at 23.6, 38.2, 50, 61.8, 78.6, 100, 161.8, 200, 261.8, 361.8 and 423.6 p
LordAutoFibonnaci
Igor Pereira Calil
5 (2)
Lord Auto Fibonnaci is a free indicator for Meta Trader, in order to show the most famous chart in the financial market known as "Fibonnaci". As we can see in the images below, the fibonnaci table will automatically analyze the graph for you, with trend factors through percentage, almost infallible use, you can always work when the percentage is low or high, start shopping and sales on time, great for analyzing entries! In the images below we can see an example in gold in H4, where we are at
FREE
The SFT Fibo Smart Pivot indicator is a powerful trading tool based on the Fibonacci Golden Ratio, designed to identify key support and resistance levels in the forex market. This indicator has the ability to pinpoint significant price levels that can serve as entry and exit points for trades. It enables traders to analyze the market more effectively and make well-informed decisions. The indicator uses the Fibonacci Golden Ratio to accurately determine support and resistance levels. These levels
FREE
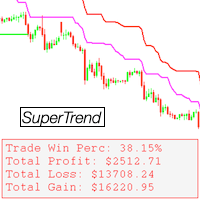
Super Trend Double Pro - Includes the classic SuperTrend indicator x2 - Includes two indicators for much better market analysis - Comes with various settings - Comes with a display - Displays statistical win/loss information The "Super Trend Double Pro" indicator provides the ability to combine two of the classic SuperTrend indicators into one, displaying two indicators with different settings on the same chart. The indicator comes with many customizable settings as well as a display which sh
Overview This is the DELUXE version in the Pivot Point Plotter Series. It is a robust indicator that dynamically calculates and plots any of the 4 major pivot points on your chart irrespective of intra day timeframe on which the indicator is placed. This indicator is capable of plotting STANDARD, CAMARILLA, FIBONNACI or WOODIE daily pivot points. Whichever you use in your trading, this indicator is your one-stop shop. Kindly note that it is a DAILY Pivot Point Plotter for DAY TRADERS who trade o
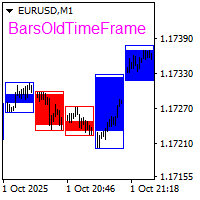
The BarsOldTimeFrame indicator is designed to analyze bar formation on a higher timeframe, projecting bars from it onto the current timeframe. The indicator draws higher timeframe bars on the current chart as rectangles with filled candlestick bodies and transparent shadows. The higher timeframe and fill colors for bullish and bearish bar bodies are selected in the settings.
Binary Options Assistant (BOA) BURN Signals Indicator provides signals based on Ana Trader Binary Options Strategy. Indicators: MACD & Stochastic Stop missing trades, stop jumping from chart to chart looking for trade set-ups and get all the signals on 1 chart! U se any of the BOA Signals Indicator with the  Binary Options Assistant (BOA) Multi Currency Dashboard .  All BOA Signal Indicator settings are adjustable to give you more strategy combinations. The signals can be seen visually and hea
Multiphase is a non-redrawing channel indicator based on moving averages. The key difference between the Multiphase indicator and other channel indicators (for example, from the same Bollinger Band) is that Multiphase takes into account not simple moving averages, but double-smoothed ones, which, on the one hand, makes it possible to more clearly determine the market movement, but, with on the other hand, it makes the indicator less sensitive.
Implementation of indication of trend movement with moments for potential stops in the Cloud Power indicator. The transition to the shadow warns of a possible reversal. The entry of the price inside the shadow speaks of a flat movement. The indicator tracks the market trend with unmatched reliability, ignoring sharp market fluctuations and noise around the average price. Simple, visual and efficient use. The indicator does not redraw and does not lag. It can be easily used as an independent t
Bu ürünün alıcıları ayrıca şunları da satın alıyor
Trend SniperX MT4
Sarvarbek Abduvoxobov
5 (5)
Trend Sniper X , işlemcilerin trend yönünü ve olası dönüş noktalarını netlik ve hassasiyetle belirlemelerine yardımcı olan MetaTrader 5 için çoklu zaman dilimli bir trend takip göstergesidir. MT5 İçin: https://www.mql5.com/en/market/product/181101 Fiyat Bilgisi: Mevcut fiyat tanıtım amaçlıdır ve gelecek güncellemeler ile yeni özellikler eklendikçe değişebilir. Code2Profit Kanalı Çoklu Zaman Dilimi Analizi ile Piyasaya Hakim Olun! Trend Sniper X ile Kazanma Oranınızı Nasıl En Üst Düzeye Çıkarırsı
Zoryk Gold mt4
Reda El Koutbane
5 (3)
ZORYK — MetaTrader 4 için gelişmiş XAUUSD sinyal ve işlem planlama sistemi Bu durumu muhtemelen daha önce yaşadınız. Altını analiz edersiniz, giriş için beklersiniz ve sonunda işlemi açarsınız. Fiyat hemen ters yönde hareket eder. Çok erken kapatırsınız, Stop Loss seviyesini değiştirirsiniz veya birkaç saniye tereddüt edersiniz. Kısa süre sonra piyasa, siz işlemde değilken başlangıçta beklediğiniz yöne ve hedefe ulaşır. Sorun her zaman yön değildi. Asıl sorun belirsizlikti. Tam olarak nere
M1 Sniper
Oleg Rodin
4.97 (30)
M1 SNIPER kullanımı kolay bir işlem göstergesi sistemidir. M1 zaman dilimi için tasarlanmış bir ok göstergesidir. Gösterge, M1 zaman diliminde scalping için bağımsız bir sistem olarak kullanılabilir ve mevcut işlem sisteminizin bir parçası olarak kullanılabilir. Bu işlem sistemi özellikle M1'de işlem yapmak için tasarlanmış olsa da, diğer zaman dilimleriyle de kullanılabilir. Başlangıçta bu yöntemi XAUUSD ve BTCUSD ticareti için tasarladım. Ancak bu yöntemi diğer piyasalarda işlem yaparken de ya
Tokyo mt4 Indicator
Vasiliy Strukov
5 (9)
Tokyo Indicator; trend yönü, potansiyel işlem sinyalleri ve piyasa koşulları hakkında net ve görsel bir genel bakış sunar. Renk kodlu ve kademeli trend çizgisi, yükseliş evrelerini (mavi) düşüş evrelerinden (macenta) ayırt eder. Trend değiştiğinde, buna karşılık gelen yön okları potansiyel alım ve satım fırsatlarını vurgular. Entegre bir panel; mevcut sinyali, piyasa eğilimini, momentumu, volatiliteyi ve sinyal kalitesini tek bir kullanışlı görünümde bir araya getirir. Bu sayede yatırımcılar, f
PRO Renko Sistemi, RENKO grafikleri ticareti için özel olarak tasarlanmış son derece hassas bir ticaret sistemidir. Bu, çeşitli ticaret araçlarına uygulanabilen evrensel bir sistemdir. Sistemi etkin piyasa sana doğru ters sinyallerine erişim hakkı denilen ses nötralize eder. Göstergenin kullanımı çok kolaydır ve sinyal üretiminden sorumlu tek bir parametreye sahiptir. Aracı, seçtiğiniz herhangi bir ticaret aracına ve renko çubuğunun boyutuna kolayca uyarlayabilirsiniz. Yazılımımla karlı bir
Currency Strength Wizard , başarılı ticaret için size hepsi bir arada çözüm sağlayan çok güçlü bir göstergedir. Gösterge, birden çok zaman dilimindeki tüm para birimlerinin verilerini kullanarak şu veya bu forex çiftinin gücünü hesaplar. Bu veriler, şu veya bu para biriminin gücünü görmek için kullanabileceğiniz, kullanımı kolay para birimi endeksi ve para birimi güç hatları biçiminde temsil edilir. İhtiyacınız olan tek şey, işlem yapmak istediğiniz tabloya göstergeyi eklemektir ve gösterge size
Atomic Analyst
Issam Kassas
5 (14)
Atomic Analyst — MetaTrader 4 Ürün soruları, kurulum rehberliği veya teknik destek için bana doğrudan MQL5 üzerinden mesaj gönderin. İndikatör, karmaşık piyasa hesaplamalarını basit görsel sinyallere, renk kodlu mumlara, trend okumalarına, stop-loss seviyelerine ve traderların hızlıca anlayıp gerçek piyasa koşullarında kullanabileceği çoklu take-profit bölgelerine dönüştürür. Ana trading kullanım alanları: Scalping ve gün içi işlem: Hızlı karar alma, net oklar, uyarılar, mum renkleri ve yapılan
Smart Trend Trading System, trend bilgilerini, giriş ve çıkış sinyallerini ve fiyat seviyelerini tek bir grafikte birleştiren bir MetaTrader 4 göstergesidir. Trend tespiti, dönüş bölgeleri, Smart Cloud, trailing stop mantığı, destek ve direnç, mum renklendirme, uyarılar ve çoklu zaman dilimi analizi dahil olmak üzere 10’dan fazla trading aracını tek bir sistemde birleştirir. Sistem, farklı piyasa koşullarında işlem yapmanıza yardımcı olmak için tasarlanmıştır: Trend piyasaları: Ana trendi belir
Scalper Vault
Oleg Rodin
5 (40)
Scalper Vault, gün içi işlemlerde istikrar yakalamak isteyen yatırımcılar için tasarlanmış, güçlü ve tam donanımlı bir alım satım sistemidir. Bu yüksek hassasiyetli gösterge; hem Forex hem de İkili Opsiyon yatırımcıları için kurumsal düzeyde analizler sunan, bağımsız ve eksiksiz bir alım satım sistemi işlevi görür. SATIN ALIM İŞLEMİNDEN SONRA BENİMLE İLETİŞİME GEÇİN; ALIM SATIM İPUÇLARIMI VE HARİKA BİR BONUSU ALIN! Tahmin yürütme zorunluluğunu ve karmaşık manuel analiz süreçlerini ortadan kaldır
Neuro Poseidon MT4
Daria Rezueva
4.74 (46)
Neuro Poseidon is a new indicator by Daria Rezueva. It combines precise trading signals with adaptive TP/SL levels - creating best possible trades as a result! Message me and get  Neuro Poseidon Assistant  as a gift to automize your trading process! What makes it stand out? 1. Proven profitability on all assets and timeframes 2. Only confirmed BUY and SELL signals present on the chart 3. Adaptive TP & SL levels generated by the software for each trade 4. Easy to understand - suitable for all
Gann Made Easy
Oleg Rodin
4.84 (173)
Gann Made Easy , bay teorisini kullanarak ticaretin en iyi ilkelerine dayanan, profesyonel ve kullanımı kolay bir Forex ticaret sistemidir. WD Gann. Gösterge, Zararı Durdur ve Kâr Al Seviyeleri dahil olmak üzere doğru SATIN AL ve SAT sinyalleri sağlar. PUSH bildirimlerini kullanarak hareket halindeyken bile işlem yapabilirsiniz. Satın alma işleminden sonra, alım satım talimatlarını ve harika ek göstergeleri ücretsiz olarak almak için lütfen benimle iletişime geçin! Muhtemelen Gann ticaret yöntem
Liquidity Scalper System: gösterge formatında likiditeye dayalı bir işlem sistemi. Çoğu gösterge yalnızca bir ok gösterir; sonrasında stopun nereye konacağına, hedefin nerede olduğuna ve sinyale güvenilip güvenilmeyeceğine trader kendisi karar verir. Liquidity Scalper System işlemin tüm döngüsünü kapsar: likidite havuzlarını bulur, kırılımlarında sinyal verir, Entry, Stop Loss ve üç hedefi anında hesaplar, panelde ise istatistikleri ve yeni veriler üzerindeki doğrulama sonuçlarını gösterir. Sis
SR Liquidity
Oleg Rodin
5 (2)
SR Liquidity , piyasa likiditesinin yoğunlaştığı ve fiyatın en güçlü tepkiyi verdiği gizli bölgeleri ortaya çıkarmak için tasarlanmış bir alım-satım göstergesidir. Bu özel likidite alanları güçlü destek ve direnç seviyeleri işlevi görerek, piyasanın yön değiştirme ihtimalinin en yüksek olduğu yerlere dair size net bir harita sunar. SR Liquidity, sıradan Destek/Direnç çizgileri çizmek yerine, alım ve satım baskısının yoğunlaştığı bölgeleri tespit etmek için gerçek fiyat hareketlerini analiz eder.
AW Prime Oscillator
AW Trading Software Limited
5 (1)
İki osilatörün birleşimi. Birincisi giriş noktalarını, ikincisi ise mevcut trendi gösterir. Gösterge, osilatör sinyallerini iki modda oklarla görüntüleyebilir; tüm hızlı osilatör sinyalleri veya yalnızca mevcut trend yönündeki sinyaller. Çok zaman dilimli bir panele ve üç tür sinyal bildirimine sahiptir. Faydalar: Günlük ve scalping ticaretine uygundur Trend filtreleme Basit ve hassas kurulum Çoklu zaman dilimi paneli Bir danışmana entegrasyona uygundur. Herhangi bir sembol ve herhangi bir zaman
CRT Candle Range Theory HTF MT4 - Ultimate CRT Indicator: Gelişmiş ICT Konseptleri ve Malaysian SnR Ticaret Sistemi En gelişmiş Candle Range Theory göstergesi ile Piyasa Yapıcıların ayak izlerinde ustalaşın. Smart Money Concepts (SMC) gücünü açığa çıkarın ve Ultimate CRT Indicator ile tıpkı kurumlar gibi hassas bir şekilde ticaret yapın. Sadece ciddi yatırımcılar için özel olarak oluşturulan bu gösterge, ICT Konseptlerinin (Inner Circle Trader) temel direği olan oldukça etkili CRT (Candle Range
Top Bottom Tracker , piyasa trendini analiz eden ve trendin en yüksek ve en düşük seviyelerini tespit edebilen sofistike algoritmalara dayanan bir göstergedir / MT5 sürümü . Fiyat 500$'a ulaşana kadar kademeli olarak artacaktır. Sonraki fiyat --> $99 Özellikler Yeniden boyama yok Bu gösterge, yeni veriler geldiğinde değerlerini değiştirmez İşlem çiftleri Tüm forex çiftleri Zaman Dilimi Tüm zaman dilimleri Parametreler ==== Gösterge yapılandırması ==== Konfigürasyon parametresi // 40
Cycles Predictor Indicator This indicator uses past market cycles to predict future price movements. The indicator scans through past data and considers  combinations  of cycles. When cycles  coincide  at the same future date/time then it is considered a valid future prediction. The predictions are drawn as vertical lines on the right side of the chart in the future. A prediction will often result in type of candle (ex. bull or bear) and/or a reversal point (ex. bottom or top) forming at this ex
Break and Retest Hunter MT4 is a powerful MetaTrader 5 indicator designed to automatically identify support and resistance levels, breakout structures, and potential retest opportunities in real time. Bonus Indicator: After purchasing Break and Retest Hunter , contact me to receive Trade Indicator Assistant EA completely free as a bonus utility. $65 for the next 10 copies . Next price is $120.  Combining adaptive market analysis, clear BUY/SELL signals, Fibonacci-based profit targets, and a pre
GoldRush Trend Ok Sinyali GoldRush Trend Ok Sinyali göstergesi, XAU/USD'de yüksek hızlı, kısa vadeli scalperlar için özel olarak tasarlanmış hassas, gerçek zamanlı trend analizi sağlar. 1 dakikalık zaman dilimi için özel olarak tasarlanan bu araç, net giriş noktaları için yön okları gösterir ve scalper'ların değişken piyasa koşullarında güvenle hareket etmelerini sağlar. Gösterge, PRIMARY ve SECONDARY uyarı oklarından oluşur. PRIMARY sinyalleri, trend yönündeki değişikliği gösteren Beyaz ve
ForexTrendMT4
Andriy Sydoruk
5 (1)
ForexTrendMT4 Indicator: A Reliable Tool for Market Tracking The ForexTrendMT4 indicator offers reliable market trend tracking, filtering out sudden fluctuations and market noise. This tool helps identify trends and signals favorable entry points into the market using arrows. It is suitable for both scalping on shorter timeframes and long-term trading strategies. Based on the principles of technical analysis, ForexTrendMT4 takes into account the cyclical nature of the market. Key Features and A
CRT Multi-Timeframe Market Structure & Liquidity Sweep Indicator Non-Repainting | Multi-Asset | MT5 Version Available MT5 Version:   https://www.mql5.com/en/market/product/162075 Full User Guide — explains what each feature does and why:   https://www.mql5.com/en/blogs/post/767525 Quick Start User Guide  — explains how to configure and in what order:  https://www.mql5.com/en/blogs/post/767540 Indicator Overview CRT Ghost Candle HTF Fractal is a complete institutional-grade market structure too
Super Signal – Skyblade Edition Profesyonel No-Repaint / Gecikmesiz Trend Sinyal Sistemi, Olağanüstü Kazanma Oranı ile | MT4 / MT5 için 1 dakika, 5 dakika ve 15 dakika gibi daha düşük zaman dilimlerinde en iyi şekilde çalışır. Temel Özellikler: Super Signal – Skyblade Edition, özellikle trend bazlı işlemler için geliştirilmiş akıllı bir sinyal sistemidir. Yalnızca güçlü, yönlü ve gerçek momentum destekli piyasa hareketlerini tespit etmek amacıyla çok katmanlı bir filtreleme yapısı kullanır. Bu s
ŞU ANDA %40INDIRIMLI Yeni Başlayanlar veya Uzman Tüccarlar için En İyi Çözüm! Bu Gösterge benzersiz, yüksek kaliteli ve uygun fiyatlı bir ticaret aracıdır çünkü bir dizi tescilli özellik ve yeni bir formül ekledik. Sadece BİR grafik ile 28 Forex çifti için Döviz Gücünü okuyabilirsiniz! Yeni bir trendin veya scalping fırsatının tam tetik noktasını belirleyebildiğiniz için ticaretinizin nasıl gelişeceğini hayal edin? Kullanım kılavuzu: buraya tıklayın Bu ilk olan, orijinal! Değersiz bir özent
Introducing Volume Orderflow Profile , a versatile tool designed to help traders visualize and understand the dynamics of buying and selling pressure within a specified lookback period. Perfect for those looking to gain deeper insights into volume-based market behavior! MT5 Version -  https://www.mql5.com/en/market/product/122657 The indicator gathers data on high and low prices, along with buy and sell volumes, over a user-defined period. It calculates the maximum and minimum prices during this
Smart Price Action Concepts — MetaTrader 4 Ürün soruları, kurulum rehberliği veya teknik destek için bana doğrudan MQL5 üzerinden mesaj gönderin. Özellikler: • Smart Money Concepts SMC • Inner Circle Trading ICT • Price Action PA ve Institutional Trading IT • Gerçek zamanlı piyasa yapısı ve swing structure highs and lows (HH HL LL LH) • Gerçek zamanlı internal and swing supply and demand order blocks • Premium Equilibrium ve Discount Zones • 2 seçenekli otomatik Fibonacci tespiti: mevcut swing v
True Direction Oscillator
Muhammad Elbermawi
4.85 (364)
Veya "Saf Momentum " ilkesini kullanarak fiyat değişim oranını ölçen bir endeks olan (TDO). Bir menkul kıymet fiyatı 10'dan 15'e yükseldiğinde, fiyat değişim oranı %150'dir, ancak 15'ten 10'a düştüğünde, fiyat değişim oranı sadece %33.3'tür. Bu nedenle, "Fiyat Değişim Oranı" (ROC) veya "Momentum" gibi teknik analiz göstergeleri, artan fiyat hareketleri için azalan hareketlere göre daha yüksek değerler verir. TDO, yatırımcıların momentumu doğru okumalarına yardımcı olmak için bu sorunu düzeltir.
Trend Lines PRO
Roman Podpora
5 (2)
TREND ÇİZGİLERİ PRO     Piyasanın gerçek yön değişimini anlamaya yardımcı olur. Gösterge, gerçek trend dönüşlerini ve büyük oyuncuların piyasaya yeniden girdiği noktaları gösterir. Anlıyorsun     BOS hatları  Daha yüksek zaman dilimlerindeki trend değişiklikleri ve önemli seviyeler, karmaşık ayarlar veya gereksiz gürültü olmadan gösterilir. Sinyaller yeniden çizilmez ve çubuk kapandıktan sonra grafikte kalır. VERSION MT 5     -    RFI LEVELS PRO  göstergesiyle birlikte kullanıldığında maksimum p
Şu anda %30 İNDİRİMLİ! Herhangi bir Acemi veya Uzman Tüccar için En İyi Çözüm! Bu gösterge paneli yazılımı 28 döviz çifti üzerinde çalışıyor. Ana göstergelerimizden 2'sine (Gelişmiş Para Birimi Gücü 28 ve Gelişmiş Para Birimi Dürtüsü) dayanmaktadır. Tüm Forex piyasasına harika bir genel bakış sağlar. Gelişmiş Para Birimi Gücü değerlerini, para birimi hareket hızını ve tüm (9) zaman dilimlerinde 28 Forex çifti için sinyalleri gösterir. Trendleri ve / veya scalping fırsatlarını belirlemek için
Advanced Supply Demand
Bernhard Schweigert
4.91 (302)
Özel Ticaret –%30 İndirim Yeni Başlayanlar veya Uzman Yatırımcılar İçin En İyi Çözüm! Bu gösterge, bir dizi özel özellik ve yeni bir formül içerdiği için benzersiz, yüksek kaliteli ve uygun fiyatlı bir işlem aracıdır. Bu güncelleme ile çift zaman dilimi bölgeleri gösterebileceksiniz. Sadece daha yüksek bir zaman dilimini değil, hem grafik zaman dilimini hem de daha yüksek zaman dilimini gösterebileceksiniz: İÇ İÇE GEÇMİŞ BÖLGELER GÖSTERİYOR. Tüm Arz Talep yatırımcıları buna bayılacak. :) Önem
KT Parabolic RSI MT4
KEENBASE SOFTWARE SOLUTIONS
KT Parabolic RSI overlays Parabolic SAR directly on the RSI line to highlight likely market turning points. Classic RSI overbought and oversold readings already hint at reversals, and the added PSAR filter removes much of the noise and sharpens those signals, giving you clearer trade setups. Big Square Signals: A Parabolic SAR flip on an RSI that sits in overbought or oversold territory. These mark high-probability market turns. Small Square Signals: A SAR flip inside the neutral RSI band. Treat
Yazarın diğer ürünleri
Auto SR Zones
Liam Alex Thomas Webb
Otomatik Destek/Direnç Bölgesi – MetaTrader 5 Anahtar Fiyat Seviyelerini Kolayca Vurgulayın. Otomatik Destek/Direnç Bölgesi, MetaTrader 5 (MT5) için grafiğinizdeki yatay çizgiler etrafında otomatik olarak özelleştirilebilir bölgeler oluşturarak teknik analizi geliştiren sezgisel bir göstergedir. Kullanıcı tarafından belirlenen bir pip uzaklığı ile tanımlanan bu bölgeler, önemli destek ve direnç alanlarını görsel olarak vurgulayarak yatırımcıların kilit fiyat aralıklarını ve potansiyel dönüş ala
FREE
Smart Bar Timer
Liam Alex Thomas Webb
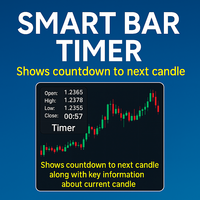
Gelişmiş Bar Zamanlayıcı – MetaTrader 5 Gerçek Zamanlı Mum Bilgisi. Anında Analiz. Gelişmiş Bar Zamanlayıcı, MetaTrader 5 (MT5) için mevcut mum hakkında gerçek zamanlı bilgi sağlayan çok yönlü ve özelleştirilebilir bir göstergedir. Bir sonraki bar için geri sayım zamanlayıcısı, mum detayları, hacim ve spread dahil olmak üzere kapsamlı veriler sunar. Grafik penceresinin kullanıcı tarafından belirlenen köşesinde görüntülenen bu gösterge, çok satırlı veya tek satırlı format seçeneği sunarak yatırı
FREE
Clean Chart Toggle
Liam Alex Thomas Webb
5 (1)
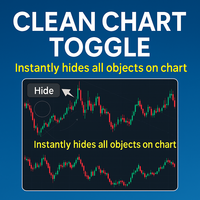
Clean Chart Toggle – MetaTrader 5 Grafiğinizi Temizleyin. Odağınızı Keskinleştirin. Clean Chart Toggle, MetaTrader 5 (MT5) grafik deneyiminizi geliştirmek için tasarlanmış, grafiğinizdeki gösterge ve nesnelerin görünürlüğünü yönetmenin basit bir yolunu sunan kullanıcı dostu bir göstergedir. Grafik penceresinin sol üst köşesinde bulunan tek bir düğme ile kullanıcılar tüm gösterge ve çizim nesnelerini anında gizleyebilir veya gösterebilir, karmaşayı azaltarak fiyat hareketine veya belirli analiz
FREE
Smart SR Levels Pro
Liam Alex Thomas Webb
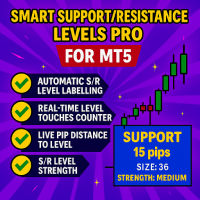
Gelişmiş Destek/Direnç Seviye Bilgi Göstergesi – MetaTrader 5 Gerçek Zamanlı Seviye Zekası. Anında Netlik. Gelişmiş Destek/Direnç Seviye Bilgi Göstergesi ile tanışın – önemli D/R bilgilerini gerçek zamanlı olarak görselleştiren nihai grafik yardımcınız. Bu MT5 aracı, yatay çizgilerinizi otomatik olarak kritik D/R metrikleriyle etiketler: destek/direnç sınıflandırması, temas sayısı, gerçek zamanlı pip uzaklığı, seviye gücü ve tarihsel yaş – tümü her seviyenin altına düzgün bir şekilde yerleştiri
Quick Label – MT4 için Hızlı Metin Etiketleme Aracı Daha hızlı etiketleyin. Daha akıllıca işlem yapın. Menülerde tıklamaya son. Özelleştirilebilir metin etiketlerini tek bir tıklamayla grafiklerinize kolayca yerleştirin. Arz/talep bölgelerini, seviyeleri veya işlem notlarını zaman kaybetmeden işaretlemek isteyen yatırımcılar için tasarlanmıştır. Temel Özellikler Özellik Açıklama Tek tıklamalı metin yerleştirme Bir ön ayar seçin, grafiğe tıklayın – metin anında görünür Tamamen özelleştirilebilir
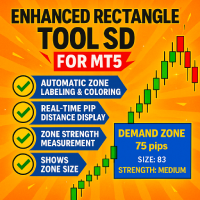
Akıllı Arz ve Talep Dikdörtgen Aracı Göstergesi – MT5 Gerçek Zamanlı Bölge Zekası. Anında Netlik. Tahmin etmeyi bırakın. Görmeye başlayın. Akıllı Arz ve Talep Dikdörtgen Aracı, kritik bölge verilerini anında, doğru ve ihtiyacınız olan yerde – bölgelerinizin üzerinde, gerçek zamanlı olarak görselleştirmenizi sağlayan nihai MT5 yardımcınızdır. Bu akıllı gösterge, arz ve talep bölgelerinizin üzerine otomatik olarak zengin ve uygulanabilir metrikler ekler: Bölge sınıflandırması (Arz/Talep) Güncel
Akıllı Fibonacci Düzeltme Bölgeleri – MT5 Göstergesi Gerçek Zamanlı Fibonacci Zekası. Anında Netlik. Akıllı Fibonacci Düzeltme Bölgeleri MT5 Göstergesi, kritik Fibonacci düzeltme verilerini anında, doğru ve ihtiyacınız olan yerde – bölgelerinizin üzerinde, gerçek zamanlı olarak görselleştirmenizi sağlayan nihai MT5 yardımcınızdır. Bu araç, Fibonacci düzeltme bölgelerinizin üzerine otomatik olarak uygulanabilir veriler ekler: seviye sınıflandırması, pip uzaklığı, düzeltme yüzdesi ve bölge gücü –
Candle Pattern Odds
Liam Alex Thomas Webb
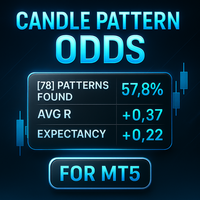
Mum Deseni Olasılık Göstergesi – MetaTrader 5 Veri Odaklı İçgörüler. Güvenli İşlemler. Mum Deseni Olasılık Göstergesi, önemli mum desenleri için gerçek zamanlı istatistikleri görüntüleyen ve analiz eden sezgisel bir göstergedir. Bu araç, Engulfing, Karakter Değişimi (CHOCH), Dengesizlik, Pin Bar ve Inside Bar gibi desenleri tespit ederek performans metriklerini grafik üzerinde özelleştirilebilir bir panelde sunar. Yatırımcılar, desen güvenilirliği, kazanç oranı ve risk-ödül oranları hakkında iç
Filtrele:
Değerlendirme yok
Değerlendirmeye yanıt