Wavelet Pro Mt5

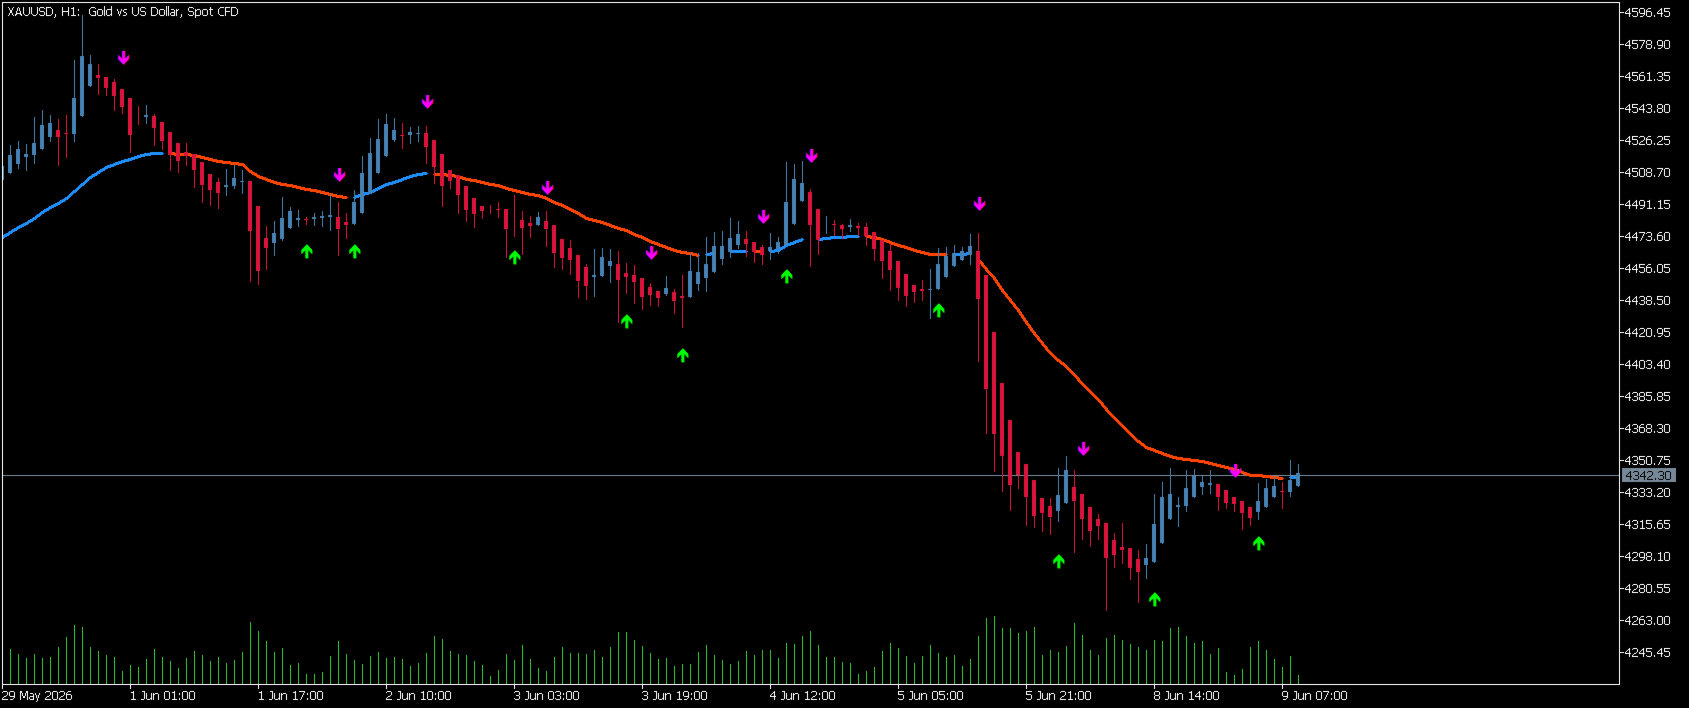
Wavelet Pro MT5 is a professional trend-following and signal-confirmation indicator designed to help traders identify potential market direction changes while filtering out unnecessary market noise. It combines adaptive trend visualization, advanced candle analysis, and precision entry signals into a single easy-to-read chart display.

The indicator plots a dynamic trend line that changes color according to market direction, allowing traders to quickly identify bullish and bearish conditions. Integrated signal arrows highlight potential buy and sell opportunities, while enhanced candle visualization provides a clearer view of price structure and momentum.

How to Use:

  • Look for the trend line color to determine overall market direction.
  • Focus on buy signals when the market is showing bullish conditions.
  • Focus on sell signals when bearish conditions are present.
  • Use the signal arrows as trade confirmation rather than standalone entries.
  • Stronger setups typically occur when price action, trend direction, and signal arrows align.
  • The optional candle display can help identify momentum shifts and trend strength.
  • Suitable for forex, indices, commodities, and cryptocurrencies across multiple timeframes.

Wavelet Pro MT5 is designed to simplify chart analysis by presenting trend, momentum, and entry information in a clean visual format, helping traders make more confident and consistent trading decisions while reducing chart clutter.


推荐产品
SpikeHunter
Franklin Cornelio Perez Colina
Este es un indicador que trabaja en indices BOOM 1000 y su equivalente en Weltrade Gain 1200. Basicamente trabaja en temporalidad de 15 minutos y su objetivo es cazar spikes. Se recomienda la temporalidad de 15 minutos por que genera un poco mas de precision. Se recomienda indices que general altos spikes, como el BOOM 1000. Lo interesante de cazar spikes es que se puede gestionar el riesgo. La configuracion ideal para BOOM 1000 y Gain 1200  es la que esta por defecto.
ArcTracer
Syed Oarasul Islam
This Indicator draws Fibonacci Arc levels in two different ways. You can select whether to draw Fibonacci Arc levels based on your favourite ZigZag settings or you can let the indicator to draw Arc levels based on given number of bars or candles.  You can also set Mobile and Email notification for your favourite Arc levels individually. With this indicator you will not have to feel lonely as the it can generate Voice alerts, which will keep you focused on your trading and remove boredom.  Produc
Fibonacci Pullback EA
Rodrigo Alejandro Stemann Henriquez
Fibonacci Pullback EA detects the latest valid swing via symmetric pivots and projects a configurable Fibonacci level across that range. When the previous closed candle wicks into that level and confirms on close , the EA places an order with SL at the swing extreme plus a points buffer , and TP at the opposite swing extreme. Designed originally for EURUSD M30 and USDJPY M30 , yet fully configurable. Signal logic Determines the latest bearish or bullish swing using symmetric pivots. Computes a F
FibExtender
Syed Oarasul Islam
This Indicator draws Fibonacci Extension levels in two different ways. You can select whether to draw Fibonacci Extension levels based on your favourite ZigZag settings or you can let the indicator to draw Fibonacci Extension  level based on given number of Bars or Candles.  You can also set Mobile and Email notification for your favourite Extension  levels individually. With this indicator you will not have to feel lonely as the it can generate Voice alerts, which will keep you focused on your
This Automatic support/resistance indicator calculates various peaks and troughs of the price action, identifies relevant levels and draws support and resistance automatically. It uses the built-in "ZigZag" indicator in Metatrader as a data source hence, very much accurate indicator.  The support and resistance lines are contineusely updated as new levels and formed. The indicator has only 5 parameters to set, and mostly it can be used with the default values:  The description of the settings is
Aklamavo Pivot Points
Sylvester Aklamavo
If you like this product, please give it a  5 star rating as a token of appreciation. This indicator calculates and draws pivot points and support/resistance levels for both daily and weekly timeframes: Pivot (central) level Support levels S1, S2, S3 Resistance levels R1, R2, R3 It allows showing daily, weekly, or both sets of pivots , giving traders visual references for potential support/resistance areas. Pivot mode: Choose which pivots to display (weekly, daily, or both). Colors and style: C
FREE
Hunttern ZigZag MT5
Hassan Gh Fakhraei
5 (1)
Hunt markets with Hunttern ZigZag . Easy to use with one parameter    You can use it for the following:       -Classic patterns       -Heads and shoulders       -Harmonic patterns       -Elliott Wave       -Support and resistance       -Supply and Demand Single parameter:      -Period (1-120) Features:        -Candle time        -Single parameter        -Light mode template This is version 1 of Hunttern ZigZag. We are very happy to receive feedback from you.
FREE
Historical Pivot Zones - Fibonacci Indicator MT5 Automatically draws Fibonacci retracement and projection zones based on historical price pivots. This MT5 indicator intelligently selects pivot points from different timeframes (weekly, monthly, or 6-month ranges) and creates visual Fibonacci zones around key levels. Features include: Smart Mode Selection - Auto-adjusts based on your chart timeframe Clean Visual Zones - Highlighted areas instead of just lines Essential Fib Levels - 9 retrace
The   DailyWeeklyMarkers   indicator helps traders visualize trading weeks by clearly marking the start of each day and week on the chart. It draws vertical separator lines for each day (including weekends if enabled) and highlights the beginning of new trading weeks with double lines for better clarity. This makes it easier to analyze price action within daily and weekly contexts. Who Is This Indicator For? Swing Traders   – Helps identify weekly opening gaps and key levels. Day Traders   – Vis
FREE
Signal Eskiya mt5
Vitalii Zakharuk
Signal Eskiya, in addition to channel lines, reflects entry signals in the form of arrows. Trading strategies using the channel indicator belong to the classic methods of technical analysis, are easy to execute, and therefore available even to beginners. Price ranges work equally well on any trading assets and timeframes, they can be used both independently and with additional confirmation from oscillators and market volumes. American traders say: “Trend is your friend”, which means “Trend is
MultiSymbolsWpr Indice x IBOV
Israel Goncalves Moraes De Souza
O Indicador identifica relação do Índice com a soma dos principais ativos, funciona para qualquer mercado do mund o, possui um oscilador WPR com a soma dos principais ativos escolhidos, indicando a antecipação do movimento em relação ao Índice. Características WPR com a soma dos papéis escolhidos - branco WPR do papel atual - vermelho Canal de Tendência O indicador pode indicar movimento de entradas, sendo: cruzamento das linhas cruzamento da linha Multi Symbols no -50 cruzamento entre os canai
FREE
AUTO FIBONACCI MULTI-TIMEFRAME TOOLKIT Technical analysis tool that automatically draws Fibonacci levels for 4H, Daily, Weekly, and Monthly sessions. AUTOMATIC FIBONACCI RETRACEMENTS (7 CLASSIC LEVELS): - 0.0% (Previous session Low - support level) - 23.6% (Fibonacci Golden Ratio - early entry level) - 38.2% (Strong retracement level) - 50.0% (Key pivot level highlighted in YELLOW - market equilibrium) - 61.8% (Main Golden Ratio - critical decision level) - 78.6% (Deep retracement level) - 100.0
NTL Pivot Lines
Northen Trading Labs
Pivot Lines (PL) User Guide Overview and Features The Pivot Lines Indicator (PL) provides traders with a powerful tool for identifying potential support and resistance levels based on well-established pivot point calculation methods. By offering insights into possible price turning points, this indicator helps traders make more informed trading decisions and refine their entry and exit strategies. With customizable settings for different timeframes and calculation methods, PL is versatile and a
Rectangle editor
Yeny Lucia Caro Useda
Rectangle Editor – Control total sobre tus zonas Rectangle Editor es una herramienta avanzada diseñada para traders que utilizan zonas, bloques o áreas de interés en su operativa. Permite , editar y gestionar rectángulos directamente en el gráfico de forma rápida, precisa y profesional. El indicador facilita la manipulación de objetos rectangulares en el gráfico, permitiendo: Dibujar zonas de oferta y demanda Marcar Order Blocks Delimitar Fair Value Gaps (FVG) Definir zonas de ent
FREE
Dynamic SR Levels Pro
Vinutthapon Bumroong
Title: Dynamic SR Levels Pro Short Description: A next-generation, multi-timeframe Support & Resistance indicator that automatically detects, adapts, and invalidates key price zones based on real-time market volatility. Stop guessing, start seeing. Full Description: Tired of manually drawing support and resistance lines that quickly become outdated? Dynamic SR Levels Pro is the ultimate solution for traders who demand precision, adaptability, and a clean, clutter-free chart. This is not just ano
Volumatic VIDyA MT5
Duc Hoan Nguyen
5 (2)
Special offer : ALL TOOLS , just $35 each! New tools   will be   $30   for the   first week   or the   first 3 purchases !  Trading Tools Channel on MQL5 : Join my MQL5 channel to update the latest news from me Volumatic VIDYA (Variable Index Dynamic Average) 是一款高级指标,旨在跟踪趋势并分析每个趋势阶段中的买卖压力。通过使用可变指数动态平均值 (Variable Index Dynamic Average) 作为核心动态平滑技术,该工具在关键市场结构水平上提供了关于价格和交易量动态的重要洞察。 查看更多 MT4 版本:  Volumatic VIDyA MT4 查看更多产品:    所有产品 To use iCustom for EA, please see here:  Create EA (iCustom) with VO
Here I present you this awesome indicator I made. This is a nique combination witch puts you in the same level as MM's. So you can surf a lot of waves and identify the rally time, breakouts, and the perfect time to get in the market. ---- The SSL Channel is a great all-rounder based on 2 Simple Moving Averages, one of recent Highs, one of recent Lows. The calculation prints a   channel   on the chart consisting of 2 lines. This strategy gives a Long signal when price closes above the top of thes
特别优惠 : ALL TOOLS ,每款仅 $35 ! New tools   will be   $30   for the   first week   or the   first 3 purchases !  Trading Tools Channel on MQL5 : Join my MQL5 channel to update the latest news from me 在波动剧烈的交易环境中,一款功能强大且直观的分析工具可以帮助您迅速抓住机会。Fibonacci Trend Scanner不仅结合了传统Fibonacci指标与SuperTrend功能,而且通过货币对扫描、多周期监控以及当趋势在多头与空头之间转换时的智能提醒,进一步扩大了其应用范围。 See more MT4 version at:   Fibonacci Trend MT4 Scanner See more products at:   All Products 1. 结合SuperTrend技术的趋势分析 Fibonacci Trend Scanner采用 SuperTrend 算法,可快速准确
DM IND Exclusive
Sergio Vidal Prado
Indicador Para Opções Binarias. Indicator for Binary Options Usa dois gales. Instalar em mt5 Esse indicador é para ser usado no tempo de vela de 5 minutos e em M5. Este também funciona em M1, porém é mais eficiente em M5. Só descompactar e copiar os arquivos na pasta de dados do seu MT5. Arquivos indicator na pasta MQL5 - Indicator. Baixe também a Media Movel totalmente gratis: https://www.mql5.com/pt/market/product/50400 Esse Indicador é para a próxima vela. Apareceu a seta, só aguardar a próx
Candle Timer Zakirulbd
Mohammad Zakirul Haque
Zakirulbd Candle Timer V7   Professional trader utilities. Minimal design. Maximum clarity. Zakirulbd Candle Timer V7 is a professional MT5 indicator designed to display the remaining time of the current candle directly on your chart in a clean, distraction-free format. One of the most common frustrations among traders is not knowing exactly how much time remains before a candle closes. Many traders moving from other platforms actively look for a reliable candle countdown timer before fully ado
FREE
Pivots Lines
Abakou Nazaire Ayelenou
5 (1)
FREE
Mogalef Bands MT5
Victor Tengo Quiles
Mogalef 带状区间 — 动态区间结构与目标区域(MT5) Mogalef 带状区间是一款可视化结构指标,用“分阶段移动的动态区间”来描述市场。它不依赖单点“信号”,而是提供结构化的背景水平,用于: 识别价格当前主要“运作/消化”的区域(操作区), 定位可能的延伸区域(目标区), 通过更稳定、不过度追随的更新方式来过滤噪音(带惯性)。 本指标适合偏主观/半系统的交易者:需要清晰的结构水平来做可重复的决策(按背景入场、按结构管理、在概率区域出场)。 图表上你会看到什么 指标会绘制一组带状水平来框定不同阶段的价格行为: 中部区域(平衡区):   市场更容易在此“工作/整理/盘整”。 外侧带(极值区):   价格更“拉伸”的区域,更常出现反应、停顿或末端延伸。 中间带(±1x):   用于观察延续、回撤与仓位管理的中间层级。 重要说明:   本指标不追求对每一根影线都反应。逻辑更偏向稳定性,避免在噪音环境中“追价”。 实战解读(如何使用) 区间行情(来回交易) 当价格在带内来回震荡、结构被尊重时,常见用法是: 将中部区域视为平衡参考, 将外侧带视为工作/反应区域:价格更可能减速、吸收或
Golden Delta Library — Free MT5 Tools Market Description Short Description Golden Delta Library is a free MT5 toolkit for traders who want cleaner chart structure, Renko-based context, risk planning, and practical execution panels. The collection includes Renko indicators, SuperTrend / ADX Renko variants, XAUUSD helper panels, and RiskLab TradeDesk tools. Each product is designed to be lightweight, visual, and useful on live charts without promising automated profits or replacing trader judgme
FREE
Free automatic Fibonacci is an indicator that automatically plots a Fibonacci retracement based on the number of bars you select on the BarsToScan setting in the indicator. The Fibonacci is automatically updated in real time as new highest and lowest values appears amongst the selected bars. You can select which level values to be displayed in the indicator settings. You can also select the color of the levels thus enabling the trader to be able to attach the indicator several times with differe
FREE
Santa Trend
Marco Aurelio Cestari
4.4 (5)
Santa Trend Indicator  is an efficient way to forecast and detect the trend in any market. Advantages Generates instant buy and sell signals. Provides an alternate exit strategy to your existing trading system. Never repaints, never backpaints, never recalculates. Works in all symbols and all timeframes. Perfect trend filter for any strategy or expert advisor. Fully compatible with Expert Advisor (EA) development. Does not lag.
FREE
O SneiperFxScalp é um indicador técnico desenvolvido para operações de scalping e entradas rápidas , com foco em alta precisão e agilidade . Ideal para traders que atuam em mercados voláteis , como criptoativos e pares de moedas com forte liquidez. Principais características: Detecção de padrões de reversão e continuidade com alta taxa de acerto Sinais visuais e sonoros para facilitar a tomada de decisão Compatível com MetaTrader 5 Funciona em qualquer ativo e qualquer timeframe Estratégia
Weis Wave Double Side
Eduardo Da Costa Custodio Santos
The Weis Wave Bouble Side Indicator for MT5 is part of the toolkit (Wyckoff Academy Wave Market) The Weis Wave Bouble side Indicator for MT5 was created based on the already established Weis Wave created by David Weis. The Weis Wave Double Side indicator reads the market in waves as it was done by R. Wyckoff in 1900. It helps in the identification of effort x result, cause and effect, and Supply and demand Its differential is that it can be used below the zero axis, further improving plus operat
Bar Sequential
Maximiliano Frisione Figueroa
This indicator can help you clearly identify trend changes in both bullish and bearish markets. The indicator compares the closing price of the last candle with the closing price of the candle "X" periods ago (input parameter). In an uptrend, an initial number '1' is plotted if a candle closes higher than the closing of a candle "X" periods ago. In a downtrend, an initial number '1' is plotted if a candle closes below the closing of a candle "X" periods ago. Subsequent numbers are plotted when e
FREE
AlgoRex
Haruki Teranaka
4.33 (6)
AlgoRex EA 配备先进的专有市场分析系统,可大幅提高外汇交易的准确性和效率。 AlgoRex 独家波动率适配器 AlgoRex 专有的波动率适配器使用 ATR(平均真实波动范围)和 RSI(相对强度指数)来实时精确分析市场波动。 这一创新功能使您能够快速响应即使是最小的市场波动,并立即捕捉不断变化的趋势。 交易者可以利用这种先进的技术随着市场的变化确定最佳的交易机会。 通过科学地确定交易时机来获得更可靠的交易结果。 动态贸易调整功能 AlgoRex 的动态交易调整功能会根据当前市场环境自动调整您的交易策略,确保在任何市场情况下都能实现最佳交易。 该功能基于实时市场分析,不断优化进场和出场点,为交易者提供最佳的交易条件。 我们能够抵御不可预测的市场波动,并支持始终领先一步的交易。 AlgoRex 以其创新方法和专家市场分析在外汇交易领域开辟了新天地。 推荐货币对 EURUSD 美元/日元 GBPUSD 建议时间范围 H1
FREE
Fibonacci sequence is defined by integer sequence: 0, 1, 1, 2, 3, 5, 8, 13, 21, 34, 55, 89, 144, ... By definition, it starts from 0 and 1, the next number is calculated as a sum of two previous numbers. Instead of the standard moving average, the indicator uses the following calculation of average price: Bar0 + Bar1 + Bar2 + Bar3 + Bar5 + Bar8 + Bar13 + Bar21 + ... This indicator shows 2 moving Fibonacci lines and arrows when 2 these lines crossing each other. If an Aqua line is crossing a Yell
该产品的买家也购买
Neuro Poseidon MT5
Daria Rezueva
4.98 (40)
Neuro Poseidon is a new indicator by Daria Rezueva. It combines precise trading signals with adaptive TP/SL levels - creating best possible trades as a result! Message me and get  Neuro Poseidon Assistant  as a gift to automize your trading process! What makes it stand out? 1. Proven profitability on all assets and timeframes 2. Only confirmed BUY and SELL signals present on the chart 3. Adaptive TP & SL levels generated by the software for each trade 4. Easy to understand - suitable for al
SuperScalp Pro
Van Minh Nguyen
4.67 (27)
SuperScalp Pro – 高级多重过滤剥头皮指标系统 SuperScalp Pro 是一款高级剥头皮交易指标,将经典 Supertrend 与多种智能确认过滤器结合,帮助识别交易机会。它可高效运行于 M1 至 H4 多个时间周期,并针对 XAUUSD、BTCUSD 及主要外汇货币对进行了优化。 该指标提供清晰的 Buy 和 Sell 信号,并基于 ATR 自动计算入场价、止损和止盈水平,帮助交易者更有效地管理风险。Fibonacci Take Profit 功能可在关键价格水平提前平仓,并在到达这些水平时发送通知,从而提升交易管理效率与稳定性。 默认配置已启用 Fibonacci Take Profit,专注于更稳定、更持续的交易体验。您只需将指标加载到图表即可立即开始使用,无需额外设置。对于高级用户,所有参数均可完全自定义,以适应不同交易策略和偏好。 完整使用文档可在产品博客查看: [User Guide] 支持通过 SuperScalp Pro Auto Trader EA 进行自动交易: [Auto Trader] SuperScalp Pro 集成了 EMA、RSI
SMC Intraday Formula
Kareem Abbas
5 (15)
让我们先坦诚一点。 没有任何一个指标可以单独让你实现盈利。如果有人告诉你可以,那他是在向你兜售一个梦想。任何显示完美买卖箭头的指标都可以被做得看起来毫无瑕疵——只需要放大历史中的某一段并截取成功交易的截图。我们不会这样做。 SMC Intraday Formula 是一个工具。 它为你读取市场结构,标记出概率最高的价格区域,并用简单直白的语言准确告诉你当前智能资金的行为轨迹。你仍然需要做决定。你仍然需要执行交易。但现在,你是带着精确性执行,而不是靠希望。 我们已经在黄金(XAUUSD)以及主要外汇货币对的日内剥头皮交易中使用该指标将近三年。这是我们在 M1、M5、M15 和 M30 上的日常主力工具。它之所以有效,是因为它不试图预测未来——它展示的是当前正在形成的高概率交易机会,并解释 为什么 。 它与其他所有指标有什么不同? 大多数交易指标只做一件事。移动平均线交叉。振荡指标触及某个水平。出现一个箭头。你进场交易。你亏损。你责怪指标。重复。 SMC Intraday Formula 将多个机构级概念整合为一个统一的市场解读: - 斐波那契共振引擎 不只是普通的斐波那契水平——该指标
本产品已针对 2026 年市场进行更新,并针对最新 MT5 版本进行了优化。 价格更新通知: Smart Trend Trading System 目前价格为 $99 。 接下来的 30 次购买 后,价格将上涨至 $199 。 特别优惠: 购买 Smart Trend Trading System 后,请发送私信给我,即可免费领取 Smart Universal EA ,并将您的 Smart Trend 信号转换为自动交易。 Smart Trend Trading System 是一套完整的交易系统,具备不重绘、不回绘、不延迟的特点,专为希望获得更清晰信号、更准确趋势方向以及更有组织交易方式的交易者打造。 Online course , manual and download presets . 它将 10 多种交易工具 整合到一个系统中,包括趋势检测、反转区域、Smart Cloud、移动止损逻辑、支撑与阻力、K线着色、提醒以及多周期分析。 该系统旨在帮助您应对不同的市场环境: 趋势市场: 识别主要趋势,发现回调,跟随动能,并通过止损指导和移动止损选项寻找更清晰的入场机会。 震荡
Divergence Bomber
Ihor Otkydach
4.9 (90)
购买该指标的每位用户将额外免费获得以下内容: 原创工具“Bomber Utility”,该工具会自动跟踪每一笔交易,设置止损和止盈点,并根据策略规则自动平仓; 适用于不同交易品种的指标设置文件(Set 文件); 三种不同风险模式下的 Bomber Utility 设置文件:“最低风险”、“平衡风险” 和 “观望策略”; 一套详细的 视频操作手册,帮助您快速完成安装、配置并开始使用本交易系统。 注意: 要获取以上所有赠品,请通过 MQL5 的私人消息系统联系卖家。 我为您介绍原创的自定义指标 “Divergence Bomber”(背离轰炸机),它是一套基于 MACD 背离交易策略 的“全功能”交易系统。 该技术指标的主要任务是识别 价格与 MACD 指标之间的背离,并发出交易信号(包括推送通知),指示未来价格可能的运动方向。平均而言,这些信号的准确率超过 98%。有关该指标如何工作的详细说明,请观看本页面上的视频演示。 该系统使用 止损订单 和 动态回撤平仓机制 来管理交易。 Divergence Bomber 指标的主要特点: 支持交易的品种: AUDCAD、AUDCHF、AUDSG
Entry In The Zone and SMC Multi Timeframe is a real-time 2-in-1 market analysis tool that combines market structure analysis and a No Repaint BUY / SELL signal system into a single indicator, built on Smart Money Concepts (SMC) — a widely adopted framework used by professional traders to understand market structure. This indicator helps you see the market more clearly, make decisions based on structure rather than guesswork, and focus on high-probability zones where price is more likely to react
Quantum TrendPulse
Bogdan Ion Puscasu
5 (25)
介绍 Quantum TrendPulse   ,这是一款终极交易工具,它将 SuperTrend   、   RSI 和 Stochastic 的强大功能整合到一个综合指标中,以最大限度地发挥您的交易潜力。该指标专为追求精准和效率的交易者而设计,可帮助您自信地识别市场趋势、动量变化以及最佳进入和退出点。 主要特点: 超级趋势整合: 轻松跟随当前的市场趋势并乘上盈利浪潮。 RSI 精度: 检测超买和超卖水平,非常适合把握市场逆转时机,可用作 SuperTrend 的过滤器 随机精度: 利用随机振荡在波动的市场中寻找隐藏的机会, 用作超级趋势的过滤器 多时间范围分析: 从 M5 到 H1 或 H4,在不同时间范围内关注市场动态。 可定制的警报: 当您的自定义交易条件得到满足时收到通知,这样您就不会错过任何交易。 无论您是新手还是经验丰富的交易员,   Quantum TrendPulse 都能为您提供所需的优势,帮助您增强策略并自信地进行交易。借助这一强大的指标,将洞察力转化为利润 — 掌控您的交易! ***购买 Quantum TrendPulse,即可免费获得 Quantum Tr
Trend Catcher ind mt5
Ramil Minniakhmetov
5 (5)
趨勢捕捉指標 趨勢捕捉指標結合了作者獨有的客製化自適應趨勢分析指標,用於分析市場價格趨勢。它透過過濾掉短期噪音,並專注於潛在的動能強度、波動性擴張和價格結構行為,來識別真實的市場方向。此外,它還結合了平滑和趨勢過濾等客製化指標,例如移動平均線、相對強弱指標 (RSI) 和波動率過濾器。 您可以在這裡查看實際運行情況以及我的其他產品: https://www.mql5.com/en/users/mechanic/seller 請注意,我不會在 Telegram 上出售 EA 或任何設置,那是騙局。所有設定都可以在我的部落格上免費取得。 重要提示!購買後請立即聯繫我,以獲取使用說明和額外獎勵! 請注意,我不會在 Telegram 上出售 EA 或任何設置,那是騙局。所有設定都可以在我的部落格上免費取得。
M1 Quantum MT5
Hamed Dehgani
5 (2)
开发者说明: 仅剩 1 个许可证 可享受 129 美元 的价格。售出后,价格将上涨至 149 美元 。 M1 Quantum 是一款专业的 M1 交易系统,提供快速且精准的交易信号,并内置止损(Stop Loss)、止盈(Take Profit)以及智能资金管理功能。 M1 Quantum 包含专业的资金管理系统,通过专注于 连续盈利交易 ,帮助交易者更快地增长账户资金。 M1 Quantum 指标 的主要特点 专为 M1 时间周期 和所有 主要货币对 设计 所有交易均配备止损和止盈 内置 资金管理功能 ,并指导交易者轻松执行交易计划 高胜率,高比例的 连续盈利交易 无重绘,无延迟 适合各种类型的交易者,简单易懂 要使用 M1 Quantum ,您需要 M1 Quantum Assistant 。这款强大的工具对所有 M1 Quantum 用户 免费提供 。 下载 M1 Quantum Assistant 加入我的 MQL5 频道 ,获取最新更新和新产品发布信息。 价格将在下周上涨至149美元。
PrimeScalping
Temirlan Kdyrkhan
PrimeScalping is a powerful trading companion designed to generate high-probability entry signals with dynamic TP/SL/DP levels based on volatility. Built-in performance tracking shows win/loss stats, PP1/PP2 hits, and success rates — all updated live. Key Features: Buy/Sell signals with adaptive volatility bands Real-time TP/SL/DP levels based on ATR Built-in MA Filter with optional ATR/StdDev volatility Performance stats panel (Success, Profit/Loss, PP1/PP2) Alerts via popup, sound, push, or e
FX Trend MT5 NG
Daniel Stein
5 (6)
FX Trend NG:新一代多市场趋势智能分析工具 概述 FX Trend NG 是一款专业的多时间周期趋势分析与市场监控工具,帮助您在几秒钟内全面了解市场结构。 无需在多个图表之间来回切换,您可以立即看到哪些品种处于趋势中、哪里动能正在减弱,以及哪些时间周期之间存在强烈共振。 限时发布优惠 – 仅需 $30(6个月) 或 $80 终身授权 即可拥有 FX Trend NG 。 已经是 Stein Investments 客户? -> 发送消息 以获取专属客户群访问权限。 需要帮助或安装指导? -> 请访问 Stein Investments 官方页面 。 1. FX Trend NG 的核心优势 三状态趋势逻辑 —— 不只是 Buy 或 Sell • 大多数指标仅显示两种状态:Buy 或 Sell。 • FX Trend NG 增加第三种状态: Fade 。 • Fade 表示趋势强度正在减弱,在完全反转之前提前发出信号。 这种结构化逻辑让您看到趋势变化过程,而不仅仅是简单方向信号。 多时间周期分析(M1 至 MN1) • 从短线交易到中长线交易全面覆盖。 • 快速识别趋势
Power Candles MT5
Daniel Stein
5 (8)
Power Candles V3 - 自我优化的强度指标 Power Candles V3 把货币与品种的强度直接转化为图表上可执行的交易方案。指标不再仅根据强度给K线着色,而是在后台持续运行实时自动优化,为您正面对的品种给出最佳 Stop Loss、Take Profit 与信号阈值。一键采用,Entry、Stop Loss、Take Profit 线就以精确价格绘制在图表上,提醒消息中直接包含方向。 本工具是 Stein Investments 生态系统的一部分 - 18+ 款工具,加上 Max,您的一对一 AI 交易导师。  随时在线,深入了解每一款指标,在您需要梳理思路的那一刻就在那里。  立即认识他: https://stein.investments 每根收盘K线运行 3,000+ 次交易模拟。9 种强度状态。2 种策略并行测试。一键采用最优配置。 为什么需要这个 大多数强度指标只给您一个数值,然后留下三个问题:相信哪个阈值、用哪个 Stop Loss、走哪个交易方向。Power Candles V3 在每根收盘K线上自动回答这些问题。结果就是一个完整的交易方案 -
Gann Made Easy MT5
Oleg Rodin
5 (6)
Gann Made Easy   是一个专业且易于使用的外汇交易系统,它基于使用先生理论的最佳交易原则。 W.D.江恩。该指标提供准确的买入和卖出信号,包括止损和获利水平。您甚至可以使用推送通知在旅途中进行交易。 购买后请联系我,即可免费获得交易指导和超棒的额外指标! 您可能已经多次听说过江恩交易方法。通常 Gann 的理论不仅对于新手交易者而且对于那些已经有一定交易经验的人来说都是非常复杂的东西。这是因为江恩的交易方法在理论上并不那么容易应用。我花了几年时间来完善这些知识,并将最好的原则应用到我的外汇指标中。 该指标非常易于应用。您所需要的只是将其附加到您的图表并遵循简单的交易建议。该指标不断进行市场分析工作并寻找交易机会。当它检测到一个好的入口点时,它会为您提供一个箭头信号。该指标还显示止损和获利水平。 换句话说,当您像先生一样进行交易时,该指标会为您提供最佳江恩建议。江恩亲自告诉你此时此刻该做什么。但最好的部分是您不需要了解任何有关江恩交易原则的知识,因为该指标会为您完成整个市场分析工作。
SignalTech is an unique fully rule based trading system delivers an Institutional approach for both Independent Traders and Prop Firm Challengers. Never Repaint. Push Notification available. No over-optimization. All the winning trades with chart setups are published on the comments page. 2026-05 4107 Pips (Until 05-29 NY Closed) 2026-04 2243 Pips 2026-03 2165 Pips 2026-02 2937 Pips 2026-01 2624 Pips 2025-12 1174 Pips It can generate signals with Buy/Sell Arrows, Push Notification (To Mobile) an
GoldenX Entry MT5
Kareem Abbas
5 (12)
GoldenX Entry 是一款用于 MT5 的指标,包含自适应 Smart Entry Trend 算法、信号评分系统、市场状态识别器以及波动率过滤器。每个信号都包含计算得出的入场位、三个止盈位(TP1、TP2、TP3)以及止损位。它基于多个分析层构建,旨在适应不同市场条件,将多层分析系统与内置优化器及统计跟踪系统相结合。该指标基于风险收益比(RR)指标和历史交易行为提供量化分析。 开始使用非常简单——在所选时间周期上运行优化器,然后在图表上开始使用该指标。 核心功能 GoldenX Entry 将信号引擎与内置交易管理及历史统计跟踪整合在同一图表中: - 内置优化器: 优化器可在图表上单击运行。它通过两阶段搜索流程测试200种参数组合——先进行探索,再进行优化——并在完成后自动应用选定配置。结果会按时间周期缓存,因此当返回已优化的周期时,会立即恢复相同设置。 - 黄金品种自动周期识别: 将指标加载到任何 XAUUSD 图表(M1 到月线)。系统会自动识别当前周期并加载对应预设。共包含9个时间周期配置文件,专为黄金在标准周期上优化设计。切换周期时,参数会自动调整。 - 资金参考面
Atomic Analyst MT5
Issam Kassas
4.26 (35)
本产品已针对 2026 年市场进行更新,并针对最新 MT5 版本进行了优化。 价格更新通知: Atomic Analyst 目前价格为 $99 。 接下来的 30 次购买 后,价格将上涨至 $199 。 特别优惠: 购买 Atomic Analyst 后,请发送私信给我,即可免费领取 Smart Universal EA ,并将您的 Atomic Analyst 信号转换为自动交易。 Atomic Analyst 是一款不重绘、不回绘、不延迟的 Price Action 交易指标,专为手动交易、清晰信号和 EA 自动化而设计。 User manual: settings, inputs and strategy. 它分析价格行为、强度、动能、多周期方向和高级过滤器,帮助交易者减少噪音,避免弱势交易机会,并做出更有结构的交易决策。 该指标将复杂的市场计算转换为简单的视觉信号、彩色K线、趋势读数、止损水平和多个止盈区域,使交易者能够快速理解并应用于真实市场环境。 主要交易用途: 剥头皮和日内交易: 专为快速决策、清晰箭头、提醒、K线颜色和结构化进出场区域而设计。 日内交易和波段交易:
本产品已针对 2026 年市场进行更新,并针对最新 MT5 版本进行了优化。 价格更新通知: Smart Price Action Concepts 目前价格为 $200 。 接下来的 30 次购买 后,价格将上涨至 $299 。 特别优惠: 购买后,请发送私信给我,即可领取 免费赠品 + 礼物 。 首先需要强调的是,这款交易工具是不重绘、不回绘、不延迟的指标,因此非常适合专业交易使用。 Online course , and manual Smart Price Action Concepts 指标是一款非常强大的工具,适合新手和有经验的交易者使用。它将 20 多个实用指标整合到一个系统中,结合了 Inner Circle Trader Analysis 和 Smart Money Concepts Trading Strategies 等高级交易理念。该指标专注于 Smart Money Concepts,帮助交易者理解大型机构如何交易,并辅助预测其市场行为。 它特别擅长流动性分析,使交易者更容易理解机构交易逻辑。它也非常适合预测市场趋势并仔细分析价格走势。通过让交易与机构策略保
Gem SIGNAL
Shengzu Zhong
5 (1)
GEM Signal Pro GEM Signal Pro 是一款適用於 MetaTrader 5 的趨勢跟隨指標,專為希望在圖表上獲得更清晰訊號、更有結構的交易設定,以及更實用風險管理的交易者而設計。 它不僅僅顯示一個簡單的箭頭,GEM Signal Pro 還能以更清晰、更易讀的方式呈現完整的交易思路。當條件確認完成後,指標可在圖表上顯示進場價、止損價與止盈目標,幫助交易者更有效率地評估交易設定。 運作方式 該指標首先根據其內部邏輯識別有效的初始訊號。 當確認條件滿足後,GEM Signal Pro 會在圖表上顯示完整的交易設定。這讓交易者可以更清楚地看到交易結構,並減少手動分析與計算的工作量。 圖表上的交易價位 對於已確認的訊號,GEM Signal Pro 可顯示: 進場價 止損價 止盈 1 止盈 2 止盈 3 風險報酬比 這讓交易設定更容易理解,也有助於讓圖表分析更有條理。 內建風險管理 風險管理是此指標設計的重要部分。 止損位基於近期市場結構,結合附近的擺動高低點與可選的 ATR 緩衝距離。這能讓交易價位更貼近當前市場條件,而不只是依賴固定距離。 圖表資訊面板 GEM Si
UZFX {SSS} 短线智能信号 MT5 是一款无重绘的高性能交易指标,专为在快速波动的市场中需要精准、实时信号的短线交易者、日内交易者和波段交易者设计。该指标由 (UZFX-LABS) 开发,融合了价格行为分析、趋势确认和智能过滤技术,可在所有货币对和时间周期内生成高概率的买入和卖出信号。 我推荐*的最佳时间周期:15分钟及以上。 {1小时}是我的首选。效果令人惊叹……! 注意:与{ LTL 164343 }指标结合使用,可提高获胜信号率。 使用 LTL 信号判断趋势,利用 SSS 信号确定入场时机。 这种方法将最大化您的胜率,并有效规避虚假信号。 核心功能 智能信号检测——精准识别强劲的趋势反转与延续形态。 多周期短线交易——在所有时间周期内运行流畅。 可自定义提醒——针对每个信号接收弹出窗口、电子邮件及手机通知(可配置)。 清晰可视箭头——图表上醒目的蓝色(买入)和红色(卖出)箭头。 自适应信号强度——可调节信号强度,适用于短期、中期或长期交易。 用户友好界面——简洁的图表显示,无重绘或信号延迟。 工作原理 UZFX SSS指标通过扫描价格走势来检测: 看涨反转——价格
ARIPoint
Temirlan Kdyrkhan
1 (1)
ARIPoint is a powerful trading companion designed to generate high-probability entry signals with dynamic TP/SL/DP levels based on volatility. Built-in performance tracking shows win/loss stats, PP1/PP2 hits, and success rates all updated live. Key Features: Buy/Sell signals with adaptive volatility bands Real-time TP/SL/DP levels based on ATR Built-in MA Filter with optional ATR/StdDev volatility Performance stats panel (Success, Profit/Loss, PP1/PP2) Alerts via popup, sound, push, or email Cu
Crystal Heikin Ashi Signals
Muhammad Jawad Shabir
5 (2)
Crystal Heikin Ashi Signals - Professional Trend & Signal Detection Indicator Advanced Heikin Ashi Visualization with Intelligent Signal System for Manual & Automated Trading Final Price: $149 ---------> Price goes up $10 after every 10 sales . Limited slots available — act fast . Overview Crystal Heikin Ashi Signals is a professional-grade MetaTrader 5 indicator that combines pure Heikin Ashi candle visualization with an advanced momentum-shift detection system. Designed for both manual traders
Azimuth Pro
Ottaviano De Cicco
5 (7)
Azimuth Pro V2:MT5合成分形结构分析与确认入场 概述 Azimuth Pro 是 Merkava Labs 推出的多层级波段结构指标。四层嵌套波段层级、锚定波段的VWAP、ABC形态识别、三时间框架结构过滤以及收盘确认入场——一个图表,一个从微观波段到宏观周期的完整工作流程。 这不是盲目的信号产品。它是一个以结构为先的工作流程,专为重视位置、背景和时机的交易者打造。 V2上市优惠 — Azimuth Pro V2售价USD 399(接下来的100份)。最终价格:USD 499。 1. V2的变化 合成多时间框架引擎 高时间框架分析从零开始重建,采用与Meridian Pro相同的专有合成架构。更清晰的HTF背景、稳定的实时行为、无经典MTF同步问题。合成引擎还解锁了 固定比率时间框架级联 (x2、x3、x4、x6)——不再在经纪商的固定时间框架之间任意跳转,您可以按图表时间框架的固定倍数分析结构,在每个尺度上保持相同的分形关系。 确认入场箭头 作为稳定且可恢复的执行层而设计的收盘确认箭头。当ABC设置形成且自适应确认逻辑在收盘K线上验证方向时,箭头会写入下一根K线的
KURAMA GOLD SIGNAL PRO(MT5)— 7层过滤 · 自动止盈止损 · 质量评分 · 信号历史保存 | 完整的XAUUSD交易系统 实时不重绘。信号出现的瞬间,箭头、入场、止盈、止损当场锁定,之后绝不移动。你交易的就是这个实时信号。而且在v7.20中,每一个真正发出的信号都会自动保存,并在重启后精确还原。 购买者专属赠品 购买永久授权,即可免费获得 AI Zone Radar(价值$59)+ 完整PDF手册。在产品价格之外,额外附赠价值$59的赠品。购买后在MQL5上给我留言即可。 AI Zone Radar: https://www.mql5.com/en/market/product/175834 在黄金交易者社区中被实际使用,因精度与易用性而广受好评。 你的难题 —— 以及解决方案 黄金一天波动$30–$50。你知道机会就在那里。但这些情况是否似曾相识: - 入场太早,价格逆行$10后才朝你的方向
Quant Direction MT5
Georgios Kalomoiropoulos
Quant Direction 是一款三维市场分析工具。它通过同时计算多个维度上的精确百分比偏差,提供完全客观的、基于算法的市场分析视角。该算法采用先进的人工智能建模工具开发,并经过全面测试,旨在以独特的精准度解读市场。它可以分析您平台上的任何货币对或金融工具。 无论您是短线 交易者、日内 交易者还是波段交易者,Quant Direction 都是您的理想之选。 交易者的真正优势 Quant Direction 的真正优势在于彻底消除情绪、屏幕疲劳和过度思考。它无需手动点击十几个图表来寻找方向并反复质疑自己的偏好,引擎即可在几毫秒内即时处理 8 个时间周期(从 5 个月到月线)。它能准确告诉你任何时刻谁在掌控市场,确保你始终朝着概率最高的方向进行交易。 市场分析的三个维度 该算法将市场分为三个不同的交易维度,为您提供完整的宏观和微观视角: 超短线交易分析: 捕捉即时、快速的动量变化和较低时间框架的执行点。 日内分析: 识别真实的、潜在的每日方向性偏差。 波动分析: 专注于宏观趋势,确保您不会与大盘机构的走势背道而驰。 独家评分引擎 Quant Direction 的底层采用了一套
Market Structure Order Block Dashboard MT5 是一款专为希望直接在图表上解读市场结构和主要价格反应区域的交易者设计的MT5指标。它结合了BOS、ChoCH、订单块(Order Blocks)、公允价值缺口(FVG)、流动性、Kill Zones、成交量分布图以及一个紧凑的面板,便于快速分析。 本指标面向使用市场结构、ICT和Smart Money概念作为决策框架的交易者。它可以帮助以更结构化的方式识别趋势延续、可能的反转、价格失衡、流动性目标和关注区域。 面向买家的资源 购买后可通过MQL5私信申请获取完整的PDF使用指南和参数配置建议。通过MQL5私信提供直接技术支持。 1.20版本带来两项重要新增: Pending BOS / Pending ChoCH 检测 和 可拖动面板 (按住面板标题栏即可将其拖动到图表任意位置,不影响图表本身)。当K线收于前一摆动点之外时,Pending Breaks 立即显示待确认的结构突破,无需等待经典的摆动确认。 重要 本产品仅为指标。它不会自动开仓、平仓或管理仓位。它不是EA(智能交易系统)。 主要功能 市场
Meridian Pro
Ottaviano De Cicco
5 (2)
Meridian Pro 2.00:MT5 专业多周期趋势矩阵 Meridian Pro 2.00 是面向 MetaTrader 5 的专业自适应趋势矩阵。它结合了原始 Meridian 趋势引擎、清晰的图表 ribbon、收盘柱确认箭头、8 周期 dashboard、Fuel 动量、加权共识、合成 HTF 处理,以及直接显示在当前图表上的高周期环境线。 目标很简单:在一个有纪律的 workflow 中读取当前趋势、多周期结构、强度、动量和 EA-ready 状态,而不是在多个图表上堆叠互不关联的指标。 Meridian Pro 的不同之处 一个自适应引擎 - 同一套波动率感知 Meridian 逻辑应用于 M1 到 W1。 合成 HTF 架构 - 高周期行由低周期数据推导,减少传统零售 MTF 中常见的 repaint、同步延迟和 broker-dependent HTF 质量问题。 完整矩阵输出 - Bias、Strength、Fuel 和加权 Consensus 一起显示,而不是拆成独立工具。 图表执行层 - ribbon 和箭头专注于当前周期,选配 HTF 线在同一图表上增加高
FX Volume MT5
Daniel Stein
4.79 (24)
FX Volume:从经纪商视角洞察真实市场情绪 简要概述 想要提升您的交易策略? FX Volume 可提供零售交易者和经纪商的持仓实时数据——远早于诸如 COT 之类的延迟报告。不论您希望获得持续稳定的收益,还是想在市场中多一分制胜的砝码, FX Volume 都能帮您识别重大失衡、确认突破以及完善风险管理。立即开启体验,让真实的成交量数据为您的交易决策带来革新! 1. 为什么 FX Volume 对交易者格外有用 极具准确度的早期预警 • 快速捕捉有多少交易者正在买入或卖出某个货币对——比大多数人提前一步。 • FX Volume 是 唯一 能够整合多家零售经纪商真实成交量数据并以简洁方式呈现的工具。 强力风险管理 • 及时识别多头或空头仓位的巨大不平衡,这往往预示着潜在的趋势反转,帮助您更自信地设置止损和目标位。 • 独家而真实的数据让每一次交易决策更具可靠性。 优化进场与出场点 • 发现“过度集中”的交易(大多数交易者都在同一方向),并通过真实成交量来确认突破。 • 避免依赖常见指标可能带来的误导信号,而是利用真实的实时成交量。 适配各种交易策略 • 将 FX
Grabber System MT5
Ihor Otkydach
4.83 (24)
向您介绍一款优秀的技术指标——Grabber,它是一套即开即用的“全包式”交易策略。 在一个代码中集成了强大的市场技术分析工具、交易信号(箭头)、提醒功能和推送通知。 每位购买该指标的用户还可免费获得以下内容: Grabber辅助工具:用于自动管理已开仓位 视频操作指南:逐步教学如何安装、设置和使用该指标进行交易 原创Set文件:可快速自动配置,帮助实现最佳交易效果 忘掉其他策略吧!只有Grabber能够真正激励你在交易中攀登新高峰! Grabber策略的主要特点: 交易周期:从M5到H4 适用资产:任意,但我推荐我亲自测试过的品种(GBPUSD、GBPCAD、GBPCHF、AUDCAD、AUDUSD、AUDSGD、AUDCHF、NZDUSD、NZDCAD、EURCAD、EURUSD、EURAUD、EURGBP、EURCHF、USDCAD、USDSGD) 交易时间:全天候 24/7 交易效果:我分享自己的真实交易结果,并在此教学如何操作: https://www.mql5.com/ru/market/product/134563?source=Site+Market+MT5+Indic
介绍     Quantum Breakout PRO   ,突破性的 MQL5 指标,正在改变您交易突破区域的方式!由拥有超过13年交易经验的资深交易员团队开发,     量子突破 PRO     旨在通过其创新和动态的突破区域策略将您的交易之旅推向新的高度。 量子突破指标将为您提供带有 5 个利润目标区域的突破区域的信号箭头,以及基于突破框的止损建议。 它既适合新手交易者,也适合专业交易者。 量子 EA 通道:       点击这里 重要的!购买后请私信我领取安装手册。 建议: 时间范围:M15 货币对:GBPJPY、EURJPY、USDJPY、NZDUSD、XAUUSD 账户类型:ECN、Raw 或 Razor,点差极低 经纪商时间:GMT +3 经纪商:IC Markets、Pepperstone with Raw 和 Razor 的点差最低 规格: 不重漆! 最多 5 个建议利润目标区域 建议止损水平 可定制的盒子。您可以设置自己的 Box Time Start 和 Box Time End。 接触 如果您有任何疑问或需要帮助,请通过私人消息与我联系。
SmartScalping
Temirlan Kdyrkhan
SmartScalping is a powerful trading companion designed to generate high-probability entry signals with dynamic TP/SL/DP levels based on volatility. Built-in performance tracking shows win/loss stats, PP1/PP2 hits, and success rates — all updated live. Key Features: Buy/Sell signals with adaptive volatility bands Real-time TP/SL/DP levels based on ATR Built-in MA Filter with optional ATR/StdDev volatility Performance stats panel (Success, Profit/Loss, PP1/PP2) Alerts via popup, sound, push, or e
作者的更多信息
Pullback Arrows
Pieter Gerhardus Van Zyl
5 (1)
Gāi zhǐbiāo tígōng mǎi rù hé mài chū jiàntóu yǐjí jīyú EMA de yídòng píngjūn xiàn hé tiáo xíng yánsè yídòng píngjūn xiàn shàngfāng jǐn xiǎnshì mǎi rù jiàntóu, yídòng píngjūn xiàn xiàfāng jǐn xiǎnshì mài chū jiàntóu jiàntóu jīyú fǎn zhuǎn suànfǎ, yīncǐ shìtú zhǎodào huítiáo diǎn kěyǐ gēnjù xūyào jīhuó jǐngbào  shìhé rènhé shíjiān fànwéi huò xuǎnzé de gōngjù gòumǎi qián qǐng xiān jìnxíng yǎnshì cèshì xiǎngshòu -----------------------
Wavelet Pro
Pieter Gerhardus Van Zyl
Wavelet Pro is a precision-engineered market analysis indicator designed for traders who demand clarity in complex price movement. It blends wavelet-style trend detection , quantum momentum shifts , and adaptive candle visualization into a unified trading framework. The system’s goal is to provide a refined visual representation of trend strength, phase changes, and market balance without lag or repainting behavior. At its core, Wavelet Pro constructs a dynamic dual-line wave structure that rea
Zig Zag Support Resistance Mt4
Pieter Gerhardus Van Zyl
Zig Zag Support Resistance Mt4 is a ZigZag-based Support and Resistance indicator designed to automatically highlight key market structure levels. It uses the classic ZigZag logic (Depth, Deviation, Backstep) to detect significant swing highs and lows, then converts these turning points into horizontal support (lows) and resistance (highs) levels. The indicator can also draw color-coded ZigZag lines directly on the chart to visualize price waves and trend direction. To keep charts clean and prac
Dragonfire Arrows
Pieter Gerhardus Van Zyl
Dragonfire Arrows is a mythical-themed arrow signal indicator that blends adaptive trend-following logic with multiple types of moving averages—reimagined as “Dragon Breaths.” It generates Buy (Ice Arrow ↑) and Sell (Fire Arrow ↓) signals directly on the chart using a multi-layered pulse system inspired by fantasy creatures, each with its own moving average logic. The system uses three magical “pulse” layers: Dragon’s Quick Pulse (fast MA), Wyvern’s Slow Pulse (slow MA), and Mage’s Sight (weight
Reversal Spiker
Pieter Gerhardus Van Zyl
5 (1)
Reversal Spiker is a dynamic momentum–volatility fusion indicator designed to highlight extreme market conditions where price is statistically stretched and prone to reversal. It operates in a separate window, displaying a normalized histogram that expands toward high values when multiple internal forces align. A dynamic threshold line adapts in real time to changing market volatility, helping distinguish ordinary movement from true exhaustion spikes. At its core, the indicator blends several mo
Phase Angle Cycle Mt5
Pieter Gerhardus Van Zyl
Phase Angle Cycle Mt5  is a precision timing oscillator designed to reveal the underlying rhythm of price movement. Instead of relying on traditional momentum or overbought/oversold logic, it focuses on identifying the market’s internal phase progression and dominant cycle structure. Displayed in a separate window, it blends phase positioning with adaptive frequency smoothing to help traders recognize where price is within its current rotational path. The main PhaseAngle line reflects the market
Quantum Core Phase Shift
Pieter Gerhardus Van Zyl
Quantum Core – Phase Shift is a neural synchronization engine designed for intermarket phase diagnostics. Harnessing temporal displacement algorithms and flux harmonics, it decodes the hidden oscillatory behavior of market energy fields. The NeuroLink Trace renders the core stability vector, while the Quantum Phase Core tracks phase divergence through a smoothed temporal conduit. Anchored to a central gravity threshold, it expands and contracts dynamically, visualizing phase shifts in real ti
Core Index
Pieter Gerhardus Van Zyl
Core Index is a precision momentum oscillator designed to highlight high-probability continuation zones in the market. It operates within a normalized range (0–100), delivering a clean and stable signal that avoids erratic spikes and misleading noise. The indicator is built to remain consistent after candle close, ensuring dependable analysis without recalculating past values. At its core, the indicator tracks underlying market strength and weakness through a refined internal process, then smoot
Phase Angle Cycle
Pieter Gerhardus Van Zyl
Phase Angle Cycle is a precision timing oscillator designed to reveal the underlying rhythm of price movement. Instead of relying on traditional momentum or overbought/oversold logic, it focuses on identifying the market’s internal phase progression and dominant cycle structure. Displayed in a separate window, it blends phase positioning with adaptive frequency smoothing to help traders recognize where price is within its current rotational path. The main PhaseAngle line reflects the market’s re
Non Repaint Diamonds
Pieter Gerhardus Van Zyl
Non Repaint Diamonds is a precision-engineered MT5 indicator designed to provide traders with highly reliable chart signals that remain stable once confirmed. Unlike repainting tools that shift or vanish after the fact, this indicator locks its signals in place, allowing traders to analyze with confidence. It marks the chart with distinct diamond-shaped signals that highlight potential turning points in market structure. The tool offers flexible customization of signal appearance, offsets, an
Spinosaurus
Pieter Gerhardus Van Zyl
The indicator is a histogram that is great for showing when to enter the market When the hump moves above the median go long and when it moves below the median go short The colors can be adjusted as preferred  Suitable for any timeframe Test in demo before purchase Enjoy -------------------------------------------------------------------------------
Arrow Wizard
Pieter Gerhardus Van Zyl
Arrow Wizard v1.1 – The Spellcaster of Precision Signals Step into the mystical world of technical sorcery with Arrow Wizard , your trusted arcane companion for revealing buy and sell portals on any price chart. Powered by a fusion of ATR incantations , Fibonacci alignments , and pivot-based foresight , this indicator weaves price action and volatility into clear directional arrows – each one a magical glyph pointing toward trade opportunity. Arcane Mechanics Arrow Wizard channels the
Gold Strength Index Pro
Pieter Gerhardus Van Zyl
Gold Strength Index Pro (GSI Pro)  is an indicator designed to analyze gold's strength across multiple currency pairs. It aggregates weighted price data from 7 XAU pairs (e.g., XAUUSD, XAUEUR) over a user-defined lookback period, calculating a composite strength value. Key features include: Color-Coded Histogram : Displays bullish (green) and bearish (red) - momentum based on a threshold zone (±0.2 default). Smoothed Lines : A gold-colored EMA (SmoothPeriod) reduces noise, while a DodgerBlue si
AlienCore Oscillator
Pieter Gerhardus Van Zyl
AlienCore Oscillator is a futuristic market momentum analyzer inspired by intergalactic signal processing. Based on the enhanced MACD concept, it measures the energy flux between fast and slow warp fields, then decodes the telepathic sync signal to reveal alien-level insights into trend strength and shifts. Quantum Surges (strong bullish moves) and Void Collapses (strong bearish moves) are visualized through vibrant histograms, while Nebula Drifts and Gravity Pulls signal moderate momentum. Des
XauUsd Net Strength
Pieter Gerhardus Van Zyl
The XauUsd Net Strength indicator is a professional-grade market strength tool designed to track and compare the relative performance of Gold (XAU) against the U.S. Dollar (USD) across a diversified basket of currency pairs. Instead of relying on a single chart, it aggregates information from multiple gold- and dollar-based pairs, applies weighting factors, and translates the results into an easy-to-read strength comparison. The indicator plots six components in a separate window: Green & Red Hi
Multi Currency Strength Index
Pieter Gerhardus Van Zyl
The Multi-Currency Strength Index is a professional analytical tool designed to reveal relative strength and weakness across major currencies and Gold in a single, unified view. Instead of focusing on one symbol at a time, the indicator evaluates multiple instruments simultaneously and plots smooth strength lines in a separate window, making cross-market comparison fast and intuitive. Each colored line represents a currency’s aggregated performance over the selected analysis period. Values above
Non Repaint Dots
Pieter Gerhardus Van Zyl
The indicator is designed to highlight potential buy and sell opportunities on the chart using green and red dots . A green dot suggests that price has broken upward past a calculated threshold, signaling a possible bullish move. A red dot suggests that price has broken downward past a calculated threshold, signaling a possible bearish move. It adapts to market conditions by factoring in both trend movement and volatility , so the signals adjust when markets are more or less active. Because it o
NeuroSlope
Pieter Gerhardus Van Zyl
NeuroSlope is a precision-tuned market strength indicator that enhances RSI analysis using adaptive neuro-style smoothing. It intelligently filters out noise and volatility spikes while maintaining the RSI’s natural rhythm, creating a clean, flowing signal that better reflects underlying price momentum. The dual-histogram structure — the smart smoothed RSI (blue) and its advanced slope curve (yellow) — provides a clear visual framework for identifying directional bias, shifts in market strength,
Astral Energy
Pieter Gerhardus Van Zyl
Astral Energy (MT4) From the Astral Mechanics Lab – Ptr777 Overview Astral Energy is an advanced subwindow indicator designed to visualize the directional “flow” of market energy through a harmonic dual-stream histogram. It interprets the balance of internal strength and weakness within price movement — revealing when the market’s astral momentum is aligning for expansion (ascending phase) or contraction (descending phase). Behind the scenes, Astral Energy translates complex volatility and di
Cosmic Flow
Pieter Gerhardus Van Zyl
Cosmic Flow  From the Astral Mechanics Lab – Ptr777 , Cosmic Flow is the harmonic oscillator at the heart of astral motion and energetic balance. It visualizes the subtle rhythm between celestial expansion and contraction — the hidden pulse that governs the market’s energetic tides. Each bar in the histogram represents the phase alignment between astral momentum and harmonic strength, capturing the invisible ebb and surge of flow between creation (rise), dissolution (fall), and the void of ba
Goldin Line
Pieter Gerhardus Van Zyl
Goldin Line is a precision momentum oscillator designed to reveal hidden shifts in market pressure. It plots a dynamic Gold Line together with a Signal Line inside a normalized 0–100 scale, allowing traders to quickly identify momentum transitions and potential trend opportunities. The indicator blends market activity with a gold-influenced component to create a unique view of price strength and weakness. Horizontal guide levels help visualize overextended conditions and equilibrium zones, maki
Gold Ripper Oscillator
Pieter Gerhardus Van Zyl
The Gold Ripper Oscillator is a specialized momentum-pressure gauge designed for XAUUSD. It visualizes the real-time tug-of-war between bullish gold strength (“GoldRush”) and opposing USD pressure (“USDCrush”). The indicator displays two color-coded histogram streams that expand or contract based on shifting market drive. When the gold side dominates, golden bars rise above the baseline, reflecting strong upward energy. When USD-driven weakness takes control, crimson bars form below the baseline
Cosmic Nexus
Pieter Gerhardus Van Zyl
Cosmic Nexus is a pure momentum-direction histogram designed to show the dominant force in the market with instant visual clarity. Instead of plotting fluctuating values, it simplifies momentum into two clean states: Cosmic Ascension (green) when upward pressure dominates, and Celestial Descent (violet) when downside energy takes control. This makes trend recognition fast and intuitive, even during volatile periods. You can use Cosmic Nexus as a directional filter, a trend confirmation layer, or
Cosmic Nebula
Pieter Gerhardus Van Zyl
Cosmic Nebula is an advanced MT4 momentum and trend-state oscillator that transforms classical ADX directional flow into a multi-state market structure model. By combining directional pressure, triple-EMA (TEMA) smoothing, and weighted signal comparison, it visualizes market conditions as distinct “cosmic phases,” allowing traders to instantly recognize trend strength, transitions, and exhaustion. The indicator runs in a separate window and plots four color-coded histogram states around a zero e
Neuro Lines
Pieter Gerhardus Van Zyl
Neuro Lines is an advanced visual momentum-mapping indicator designed to overlay intelligent oscillation lines directly onto the price chart. Instead of working in a separate sub-window, it transforms internal market rhythm into dynamic, price-scaled lines that move with the chart itself. This creates a highly intuitive view of momentum shifts, trend bias, and timing without cluttering your workspace. The indicator plots two adaptive lines: a fast-reacting signal line and a smoother guidance lin
Gold Force Index
Pieter Gerhardus Van Zyl
Gold Force Index is a relative strength oscillator designed to compare Gold and the US Dollar in a clean, intuitive way. It visualizes which side of the market currently holds dominance by transforming multi-market data into two normalized strength curves displayed in a separate indicator window. The focus is clarity: instead of reacting to short-term price noise, the indicator highlights sustained shifts in strength that often precede meaningful market moves. Both strength readings are plotted
Gold Oscillator Pro
Pieter Gerhardus Van Zyl
Gold Oscillator Pro is a professional momentum and strength oscillator designed to give a clear, structured view of gold market conditions across multiple related instruments. It condenses complex market behavior into a single, easy-to-read histogram with an adaptive signal line, helping traders identify bullish and bearish phases, momentum shifts, and potential continuation or exhaustion zones. The indicator is displayed in a separate window and uses color-coded histogram bars to reflect four d
Wavelet Energy Pro
Pieter Gerhardus Van Zyl
Wavelet Energy Pro is an advanced momentum and pressure-analysis oscillator designed to reveal how much directional “energy” is present in the market, not just which way price is moving. Instead of focusing on raw price alone, it highlights the balance between bullish and bearish force, how strong that force is, and—most importantly—when that strength begins to fade. The indicator is displayed in a separate window and combines two perspectives: a fast, responsive energy reading and a smoother, r
Bitcoin Barometer
Pieter Gerhardus Van Zyl
Bitcoin Barometer  is a dual-strength oscillator designed to measure the relative momentum of Bitcoin versus the US Dollar in one clear view. It plots two smoothed lines in a separate window: BTC Strength (orange) and USD Strength (blue), both normalized on a 0–100 scale with a central equilibrium level at 50. The indicator calculates percentage return over a customizable lookback period (minutes, hours, or days), then converts that return into a strength score. USD strength is derived from a ba
Gold Barometer
Pieter Gerhardus Van Zyl
Gold Barometer is a dual-line strength indicator that measures relative momentum between Gold (XAUUSD) and the US Dollar. It calculates percentage change over a flexible lookback period (minutes, hours, or days), converts it into a normalized 0–100 strength scale, and smooths it with EMA filtering for cleaner signals. The gold line reflects XAUUSD performance over the selected lookback. The USD line is derived from a basket (EURUSD, GBPUSD, AUDUSD, USDJPY, USDCHF, USDCAD), giving a broader view
筛选:
无评论
回复评论