Vision Quant Atlas

Vision:产品说明

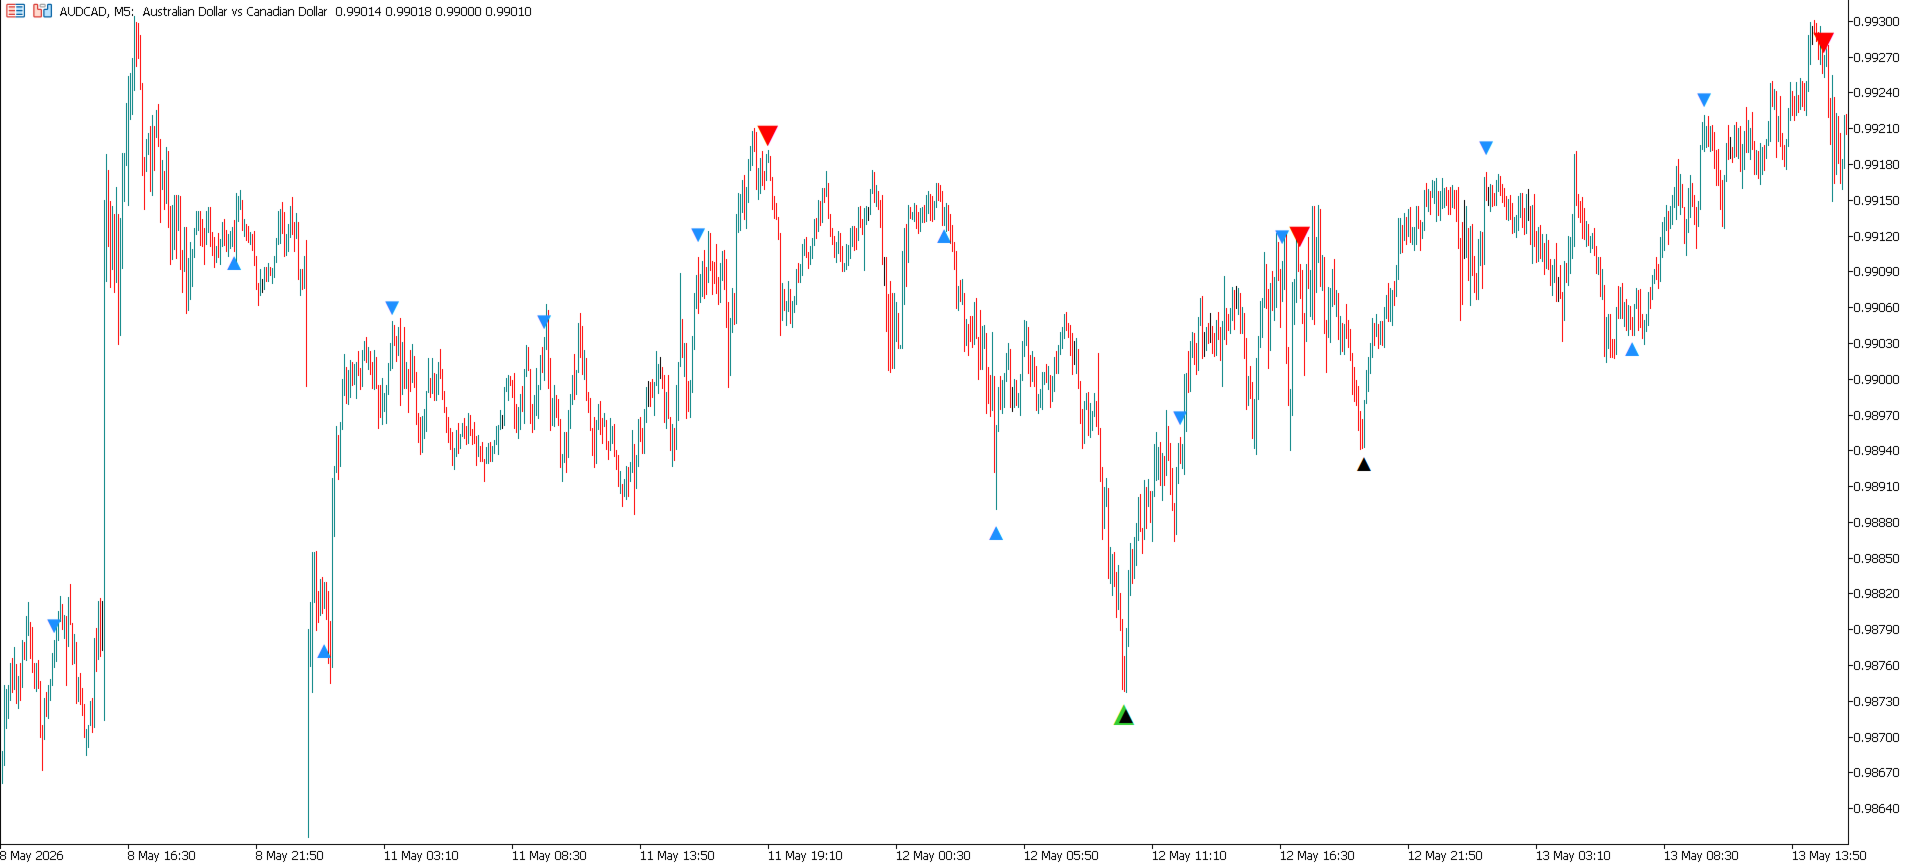
Quant Atlas 的 Vision 是一款多组件反转信号指标,旨在识别流动性市场中的短期看涨和看跌衰竭点。该模型整合了多个独立的技术证据层,包括动量行为、均值回归压力、基于波动率的条件、趋势互动、时机结构,以及与移动平均线相关的确认因素。最终结果会直接转换为图表上的可视化信号强度标记。

该指标主要用于反转分析。它的目标是突出价格可能已经过度延伸、结构上变得脆弱,或正在接近潜在方向转换的区域。Vision 最适合作为决策辅助层,与价格行为、市场结构、蜡烛图行为、支撑与阻力、流动性区域,以及更广泛的趋势背景结合使用。

信号理念

Vision 不会以相同方式处理所有反转条件。每个信号都会根据其背后的证据数量和质量进行分类。

只有当模型的综合评分达到预设的信号强度区域时,信号才会生成。内部组件之间的一致性越强,信号分类的重要性就越高。

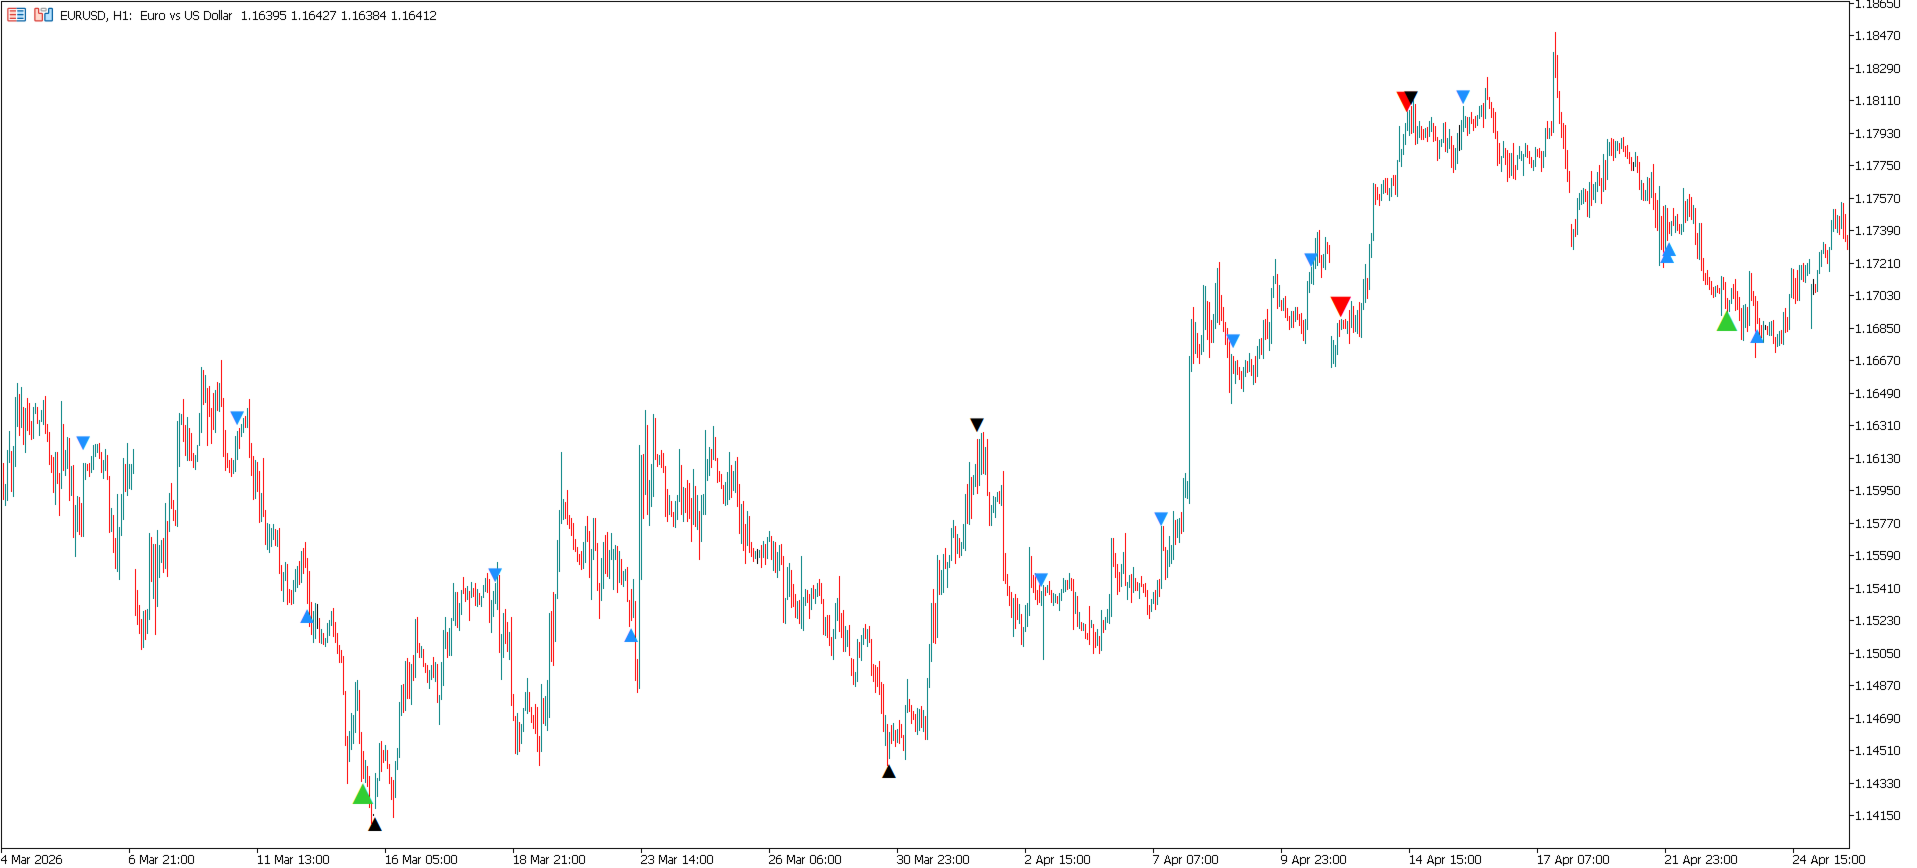
该指标使用三个实用的信号强度等级:

蓝色三角形:中等信号强度

蓝色三角形代表中等反转信号强度。

这些信号表示模型已经检测到有意义的看涨或看跌反转条件,但证据还不足以将其归类为高强度信号。

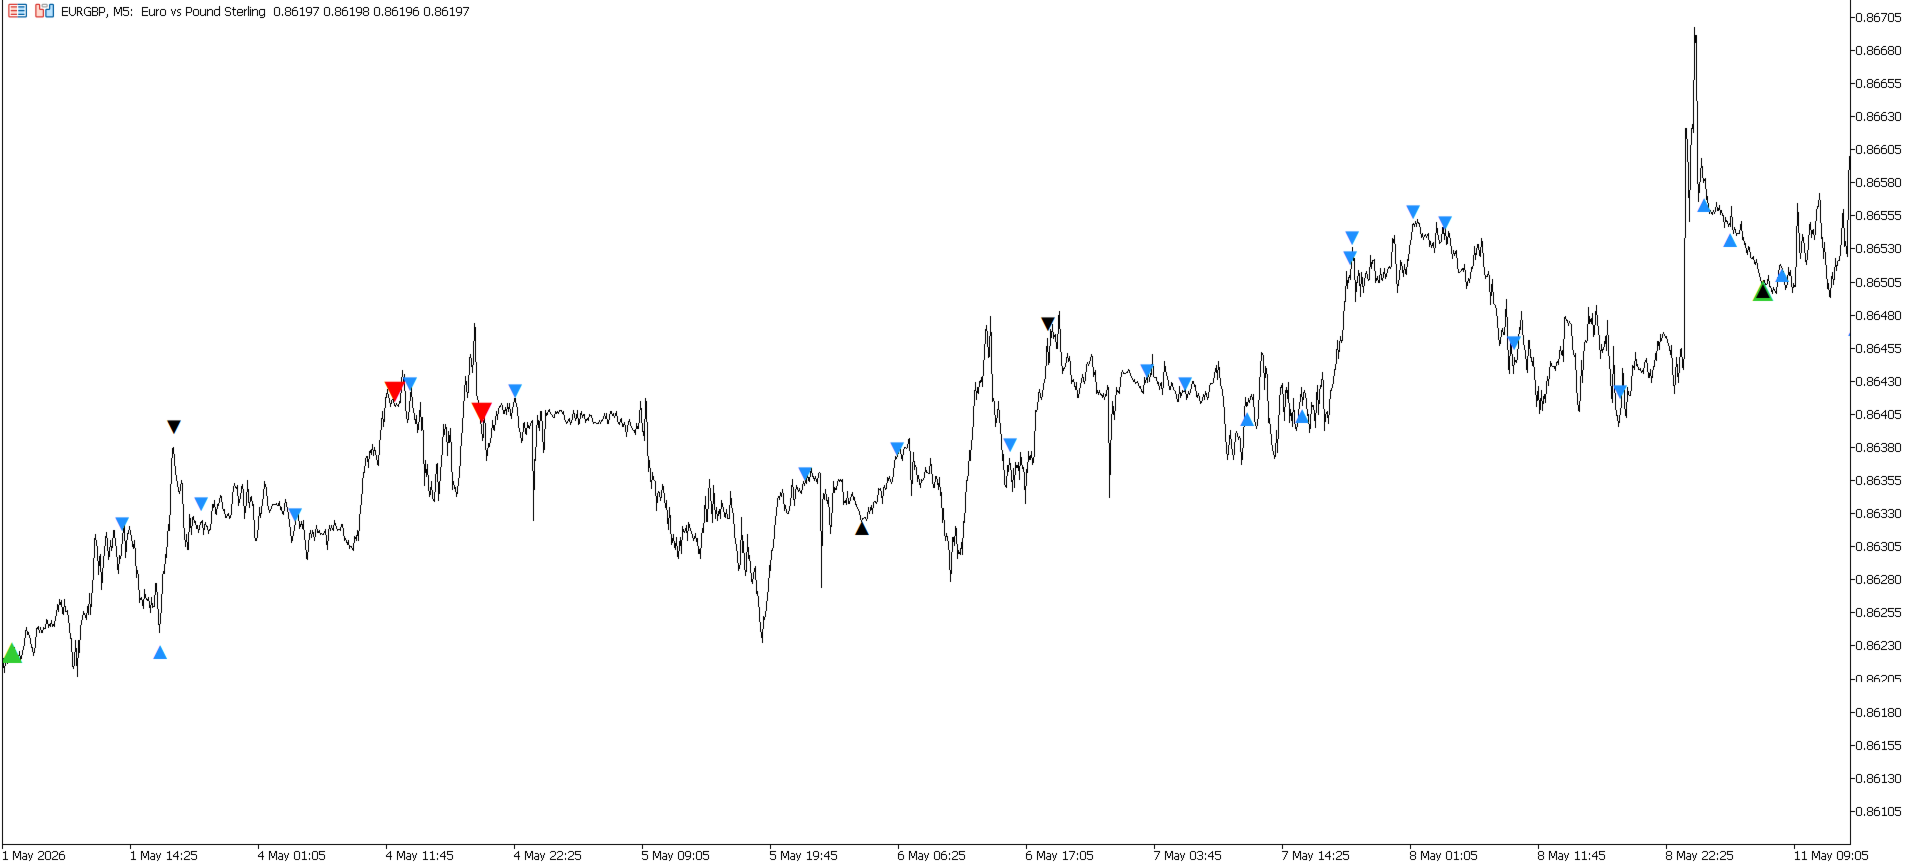
当模型检测到中等看涨反转倾向时,蓝色看涨三角形会出现在价格下方。

当模型检测到中等看跌反转倾向时,蓝色看跌三角形会出现在价格上方。

蓝色信号适合用于早期识别。它们最好结合可见的价格行为进行确认,例如拒绝蜡烛、延续失败、局部结构变化,或价格在关键区域附近出现反应。

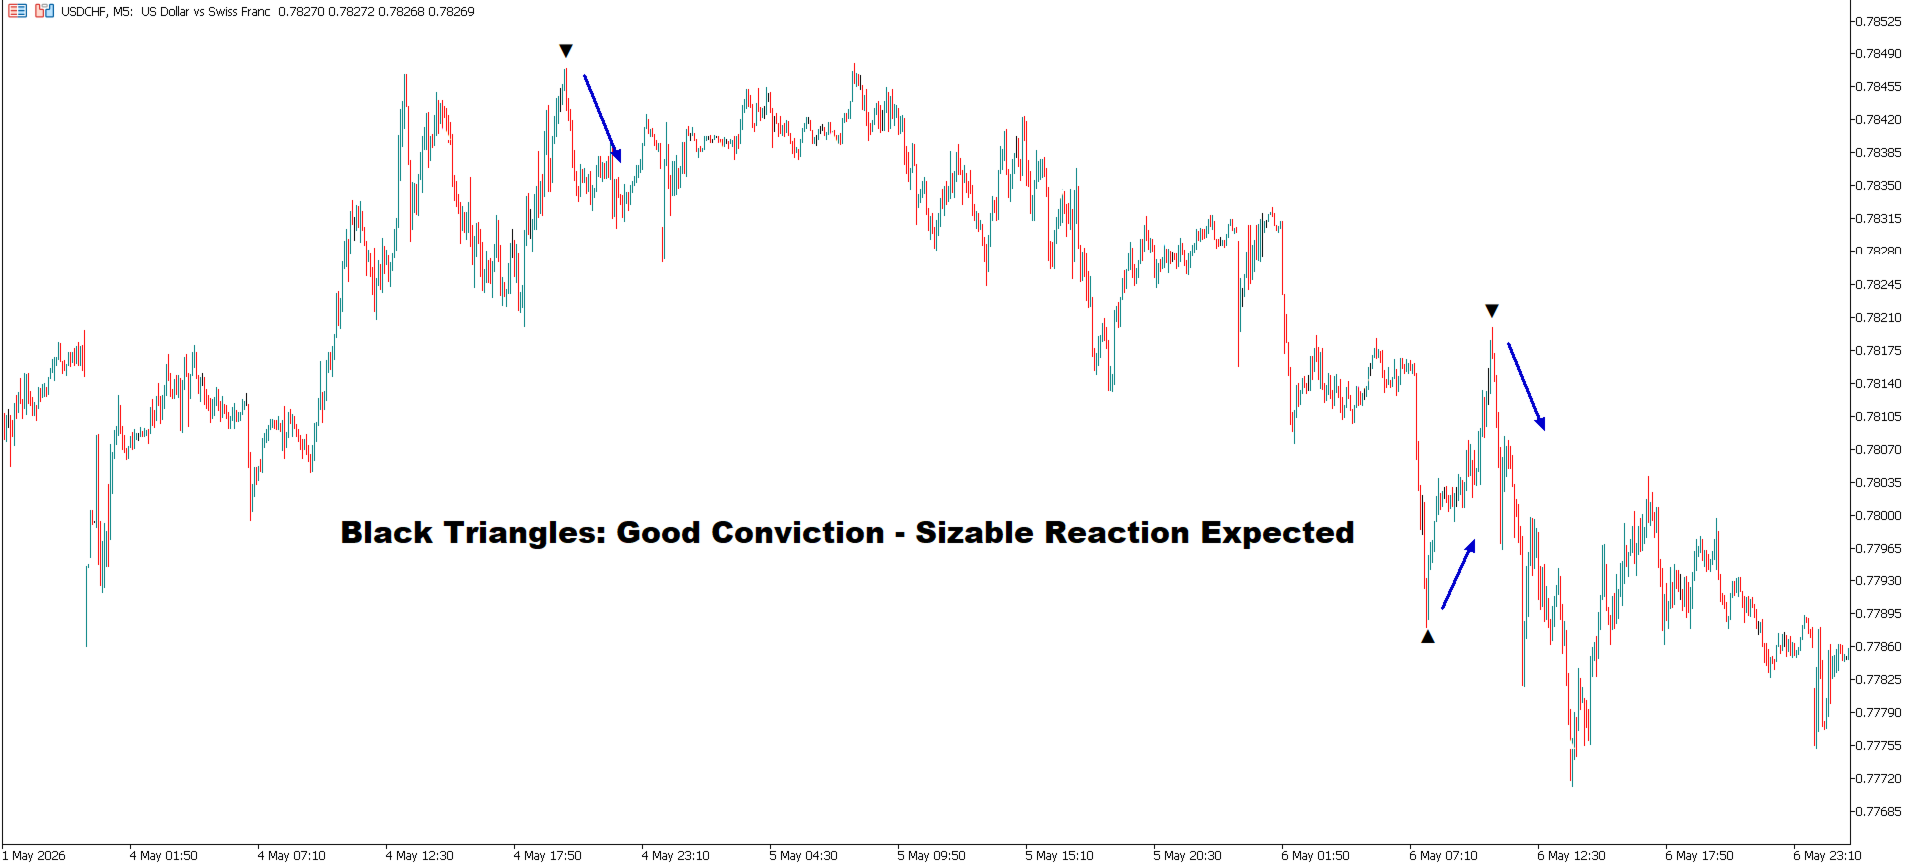
黑色三角形:良好信号强度

黑色三角形代表良好的信号强度。当一个信号得到更多同方向内部指标支持时,就会出现黑色三角形。

黑色看涨三角形表示模型识别到了一个具有更广泛内部确认的看涨反转条件。

黑色看跌三角形表示模型识别到了一个具有更广泛内部确认的看跌反转条件。

这些信号通常比蓝色信号更具选择性。它们表明反转条件并不是来自单一孤立的技术触发因素,而是来自模型内部多个一致区域的共同确认。

对于主观交易者来说,黑色三角形可以被视为质量更高的反转提醒,尤其是在它们出现在清晰的支撑或阻力附近、长时间走势之后,或明显的衰竭蜡烛附近时。

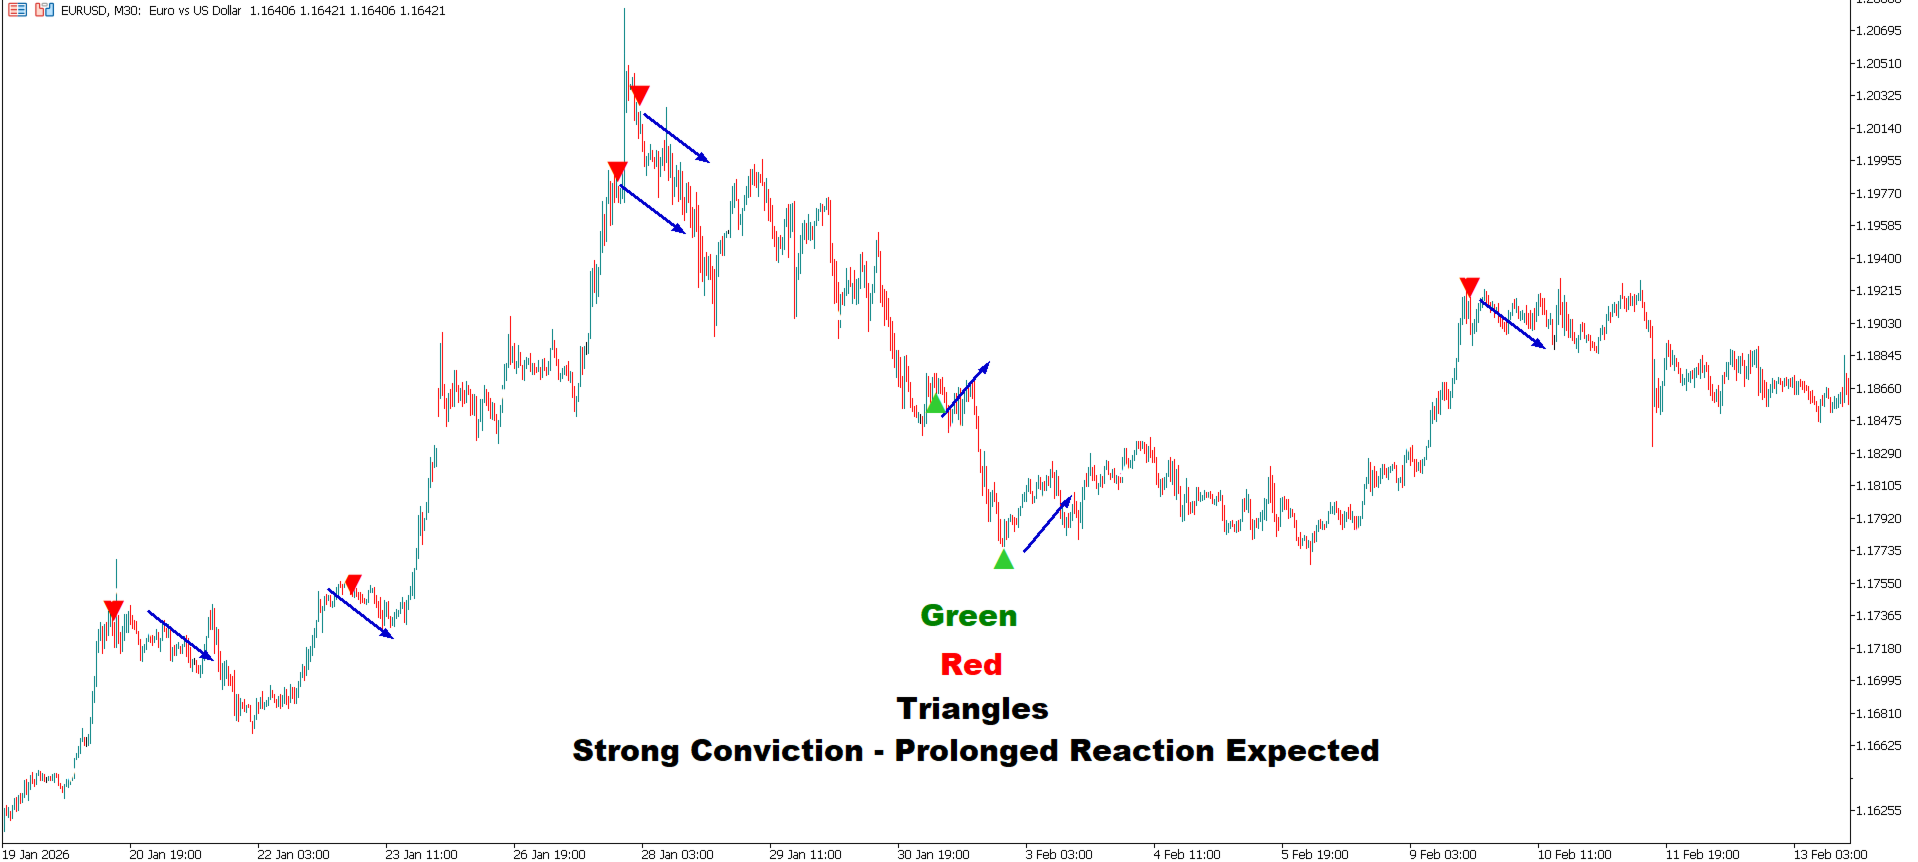
绿色和红色三角形:强信号强度

绿色和红色三角形代表强信号强度。

绿色三角形表示强看涨反转信号。

红色三角形表示强看跌反转信号。

这些信号旨在捕捉更高强度的反转条件。

如何解读信号

Vision 应被视为一张反转信号强度地图。最好的使用方式不是机械地交易每一个信号。更合理的方法是通过价格行为对信号进行过滤。

例如,当一个看涨信号出现在下跌之后、支撑附近、卖压放缓时,或伴随拒绝影线、向下突破失败,或短期结构转变时,它会更有意义。

当一个看跌信号出现在上涨之后、阻力附近、买盘压力减弱时,或伴随拒绝蜡烛、向上突破失败,或上涨延续性丧失时,它会更有意义。

适用市场场景

Vision 主要为短期交易和战术性市场择时而设计。

它非常适合较低和中等时间周期,因为这些时间周期中反转时机非常重要,例如日内交易和波段交易。对于希望以更结构化方式识别潜在衰竭区域,而不是仅依赖主观图表解读的交易者来说,该信号框架尤其有用。

该指标也可以用于日线周期。在日线图上,信号出现频率较低,但在结合市场结构、趋势状态,以及宏观或跨市场背景时,它可以帮助识别更大范围的战术性反转区域。

最佳使用方式

Vision 最适合作为确认工具,而不是独立的入场系统。

最清晰的流程如下:

识别更广泛的市场背景。

等待 Vision 信号出现。

用价格行为确认信号。

根据图表结构定义失效位置。

通过仓位大小和风险控制来管理交易。


推荐产品
FFXMV Forex Dashboard Indicator MT5
Opengates Success International
FULL FOREX MARKET VIEW 仪表盘指标 MT5 这是一个为 MT5 平台开发的自定义指标,旨在为交易者提供对市场的全面了解。它使用实时数据来分析市场,并显示成功交易所需的所有信息。 安装: 在将此指标附加到图表窗口之前,请进入 MT5 的“市场报价”面板,隐藏所有不需要或不交易的货币对,只保留你交易的那些。原因是 FFMV 仪表盘会显示 MT5 市场报价中的所有货币对,最多可显示 26 种。如果超过 26 种,FFMV 仪表盘上的字体和图像会变得模糊并失真!将无法正确显示。 用途: 单一交易 组合交易(请参阅截图) 也可用于多订单交易 用于确认来自你交易系统的信号等 组件: 时间框架:从 M1 到 MN1 当前蜡烛状态(买/卖) 趋势:货币整体趋势 影响:货币波动的幅度/波动性(见下): Build-up: 货币刚开始形成趋势 Good: 货币走势逐渐增强 High: 值得关注 Strong: 方向应予以考虑 Very strong: 接近完美 Excellent: 信号达到最佳,可以交易 变化:货币横盘、上涨或下跌 评级:交易可靠性 如何使用仪表盘: 所有时间框架从
Institutional Orderflow Entry Scanner Volume Profile • Value Area • Order Blocks • Multi-Symbol Scanner Turn your chart into a professional institutional order-flow cockpit. This indicator scans up to 60 Market Watch symbols in real time, detects high-probability setups from three proven Value-Area strategies, and delivers clean, actionable entries with institutional-grade risk management — all on a single, flicker-free interface. What It Does The scanner continuously analyses the previous sess
Ha Pullback Resume
Ich Khiem Nguyen
HA Pullback Resume MT5 Systematic Trend Retracement and Momentum Resumption Engine The HA Pullback Resume indicator for MetaTrader 5 provides an objective analytical framework designed to identify high-probability trend-continuation setups following shallow corrective pullbacks. Active intraday traders and scalpers frequently encounter execution timing errors during trend pauses: entering prematurely before a correction completes, suffering stop-outs from erratic boundary wicks during quiet cons
Pure Diamond Trend Exhaustion Pure Diamond Trend Exhaustion 指标旨在识别市场动能枯竭区域及潜在的价格反转点。核心算法基于价格极值和蜡烛图影线结构分析,能够精准识别超买和超卖水平,且无需使用传统的滞后型振荡指标。 技术特性: 无重绘 (No Repaint): 指标信号(菱形)在当前蜡烛关闭后立即固定。一旦信号形成,不会随价格后续波动而消失或改变位置。 噪声过滤算法: 程序分析蜡烛实体与影线的比例,有效过滤既定价格区间内的虚假波动。 通用性: 指标适用于所有资产类型,包括外汇 (Forex)、加密货币、股指和商品。可在任何时间周期内使用。 极简界面: 采用图形化符号显示,避免占用交易者过多的图表空间,便于与其他技术分析方法结合。 使用方法: 该指标生成两种类型的信号: 粉色菱形 (Pink Diamond): 形成于局部高点,指示上涨动能枯竭。 蓝色菱形 (Blue Diamond): 形成于局部低点,指示下跌动能枯竭。 默认设置: 指标自带的预设参数已针对 M15 和 M30 时间周期进行了优化。这些设置在信号准确性与出现频率
E2C Lines
Eduardo Cristian De Carvalho
Descubra o poder do nosso indicador de alta precisão, projetado para identificar as regiões de alvo e exaustão de qualquer ativo. Testado e validado por mais de 3 anos nos mercados de mini dólar e mini índice, ele oferece confiabilidade e eficácia incomparáveis. Transforme sua estratégia de trading e alcance novos patamares de sucesso com nossa ferramenta inovadora.
No Wick Candle Scanner is a powerful, lightweight tool built for MetaTrader 5 designed to isolate pure market momentum. In trading, candles that close without an upper or lower tail (wick) represent absolute dominance by buyers or sellers. This indicator scans your charts in real-time, instantly flagging these high-probability momentum bars with clean visual markers, allowing you to catch strong trend continuations and sudden breakouts with ease. Key Advantages & Features: 6-in-1 Filtering Matr
FREE
EA MARS SCALP PRO Professional Automated Scalping Expert Advisor for MetaTrader 5 EA MARS SCALP PRO is a professional automated trading system designed for traders who want fast, disciplined, and systematic execution on MetaTrader 5 . The EA is built to identify short-term trading opportunities and execute orders automatically according to its programmed trading logic, helping reduce emotional decision-making and manual execution errors. Key Features Fully Automated Trading Automatically analyz
Gann Box MT5
Frederic Jacques Collomb
Gann Box 指标是一个强大且多功能的工具,旨在帮助交易者识别和利用市场的关键水平。该指标允许在图表上绘制一个矩形,该矩形会自动划分为多个区域,并带有战略水平 0, 0.25, 0.50, 0.75, 1 。当价格触及其中一个水平时,会触发警报,从而为交易决策提供宝贵的帮助。您可以即时了解市场相对于您绘制区域的变化情况。要绘制一个区域,只需绘制一个简单的矩形并将其命名为 GannBox 。 该指标适用于所有类型的交易者,无论是使用 支撑和阻力 概念、 供需 理论的交易者,还是 ICT 技术或 公平价值缺口 (FVG) 专家。 无论您是 日内交易者 、 波段交易者 还是 趋势交易者 , Gann Box 都可以帮助您更好地理解和预测市场走势,同时提高您的反应能力和交易表现。 MT4 版本 Gann Box 是一个 多时间框架 指标:它可以绘制在更大的时间框架上,比如 H1,同时允许在较小的时间框架(如 15 分钟图表)上进行更精确和快速的交易。 除了其灵活性之外,该工具还可以通过直观的 管理面板 在图表上进行全面自定义。此面板允许根据您的偏好激活或禁用每个级别,并启用或禁用相关的警
Pressure Indicator Buyers vs Sellers
PEDRO JOAQUIM GONCALVES GOMES
Advanced Market Pressure Indicator - Professional Trading Tool Stop Guessing. Start Trading with Precision. WHAT IT DOES This indicator reveals WHO controls the market - Buyers or Sellers - and predicts their next move using advanced algorithms. 5 Powerful Systems in ONE Indicator: Real-Time Pressure Analysis - Shows exact buyer/seller force (0-100%) Automatic Divergence Detection - Catches reversals BEFORE they happen AI Confidence Score (70-100%) - Filters out false signals automat
PriceActionToolKit - Professional ICT & Smart Money Concepts Indicator Transform Your Trading with Institutional-Grade Analysis PriceActionToolKit is a comprehensive indicator that brings the power of Inner Circle Trader (ICT) methodology and Smart Money Concepts directly to your MetaTrader 5 platform. This all-in-one solution eliminates the guesswork from your trading decisions by automatically identifying the key market structures that institutional traders use to move the markets. Why This
Orderflow7
Antony Kiragu Maina
NY OPEN ORDERFLOW The Intelligence Behind the Market. NY OPEN ORDERFLOW is an intelligent algorithmic trading system engineered to interpret market structure, identify liquidity traps, and recognize failed auctions around the New York trading session. Inspired by the analytical precision of institutional trading, it transforms price action into systematic trading decisions. Rather than blindly chasing momentum, NY OPEN ORDERFLOW observes how price behaves around key levels, detects potential bre
WaveBreaker Pro MT5 —— 市場動能分析領域的佼佼者。 WaveBreaker Pro 是一款高科技綜合交易指標,專為精準視覺化市場結構而設計。它能幫助識別潛在的反轉區域並捕捉強勁的價格動能。其核心演算法建立在經典指標與震盪指標的巧妙結合之上,並經過了深度改良與嚴格測試。 此指標能有效適應各種交易風格-從激進的日內超短線交易(scalping)到穩健的中長期交易,均能游刃有餘。 多週期雷達(12個週期):其獨特架構可同時掃描12個時間週期,讓交易者無需切換圖表標籤頁,即可全面掌握這12個週期內的市場概況。 支撐與阻力:直觀顯示目前的支撐位和阻力位區域,非常適合用於設定停損(Stop Loss)和停盈(Take Profit)訂單。 趨勢斜率分析器(EMA指標):內建儀表板,以度數形式顯示移動平均線的斜率角度。這使您能夠即時評估當前趨勢的真實強度及市場所處階段(是活躍波動還是動能減弱)。 訊號不重繪(Non-Repainting):所有箭頭及關鍵標記均在K線收盤時固定在圖表上,不會發生變動。 終端內音訊提醒:直接在交易平台內播放訊號通知。 行動端推播通知:直接傳送至您智
Account Nuclear
Putu Hery Siswanto
FOX CUSTOMER BENEFITS Verified customers with qualifying MQL5 Market purchases may be eligible for complimentary FOX commercial Expert Advisors. Learn more about the FOX Customer Benefits Program: https://www.mql5.com/en/blogs/post/774575 ACCOUNT NUCLEAR One account. One control panel. Full manual authority when you need it. Account Nuclear is a free MetaTrader 5 utility built for traders who manage multiple positions, pending orders, manual trades or several Expert Advisors on the same account
FREE
XAU SOVEREIGN MESH PROTOCOL  Multi-Terminal Coordinated Trading Intelligence Network Xau Sovereign Mesh Protocol  represents the next generation of automated trading technology. Most commercial EAs run in complete isolation—restricted to a single terminal window, blind to the exposures and risks building up across the rest of your portfolio. Xau Sovereign Mesh Protocol breaks these boundaries. Built as a serverless, zero-DLL Distributed Mesh Network, multiple nodes running across different MT5
Algo Trading Indicaor MT5 The ATC ALGO indicator has been developed to work on the MetaTrader 5 platform. It has the same specifications and zones as the MetaTrader 4 version. There may be slight lag, which we believe is due to differences in MetaTrader 5 programming. We will work on improving it, God willing. MT5 Version                    https://www.mql5.com/en/market/product/170028 MT4 Version                    https://www.mql5.com/en/market/product/88034 With this indicator , you’ll have
EFX RETAIL GRADE SIGNAL DASHBOARD v5.2.5 —  Multi-Layer Decision Engine with V11 Divergence Fusion, CSD Trust Matrix & Precision Entry System     Institutional Logic. Retail Accessibility.  Transforming market complexity into clear trade probability.                                                                              
Isolated Peak & Bottom – Trend Exhaustion and Reversal Indicator for MT5 An uptrend defined by higher highs does not create new highs every single day. At some point, price pauses, corrects, or reverses. The key challenge for traders is distinguishing between a temporary correction and the actual end of a trend . The Isolated Peak & Bottom indicator is designed to address this exact problem. Concept Behind the Indicator This indicator is based on the Isolated High / Low technique , a proven pric
XAU Amnesia Protocol
Napat Puangjunkum
XAUUSD AMNESIA PROTOCOL AI     Amnesia Protocol - Exploiting the chaotic moments when the market forgets all technical analysis.    XAUUSD Amnesia Protocol AI is a breakthrough trading system based on "The Market Amnesia Hypothesis". When high-impact news hits or panic ensues, the market experiences temporary "Amnesia". Support and resistance levels become meaningless, and chaos takes over. This EA is specifically designed to remain dormant during normal market conditions and instantly awaken th
Glazing Index Pullback
Dharma Surya Sadhana
Glazing Index Pullback buys short, sharp pullbacks in US stock indices (S&P 500, Nasdaq 100, Dow 30) while their long-term trend is up, and exits on the first bounce. It makes one decision per day per index. Every trade has a stop and is sized by a fixed risk percentage of equity. How it works Once per day, the EA checks each index for a long-term uptrend and a short-term oversold pullback. When both are present, it buys at the next open. It exits when the price has recovered. A typical trade la
SunSignal ML — AI Gold Signals with Multi-Timeframe Confluence SunSignal ML is an advanced AI-powered signal indicator purpose-built for XAUUSD gold trading. It combines a proprietary adaptive trend algorithm with six machine learning models trained on confirmed price pivots to produce high-confidence entry signals with multi-timeframe validation. The indicator runs efficiently on M1, M5 and M15 timeframes and is designed for traders who want precision entries guided by data rather than guesswor
Multi Timeframe Currency Strength Panel
Narayanan Mohanan Mohanan Krishnan
MTF Currency Strength Panel for MetaTrader 5 多时间框架货币强度指标:全部 28 个主要货币对集中显示在一张图表上。 这款货币强度面板显示八大货币当前的相对位置,以及 28 个主要货币对在九个时间框架(M1 至 MN1)上的走势。两组读数同处一张图表,并按计时器刷新。 单纯对货币对进行排名容易产生误导。当某一种货币出现波动时,所有包含它的货币对都会随之波动,因此排名的顶端往往是同一种货币重复出现七次。本面板将整个矩阵分解为各货币自身的强弱,从而把真正的驱动因素与重复项区分开来。 分解的原理 八种货币中的每一种都出现在 28 个货币对中的 7 个之中。它的强弱是这 7 个读数的平均值,并在该货币作为报价货币时反转符号——AUDJPY 下跌意味着日元走强,而不是走弱。 每个货币对恰好影响两种货币:对基础货币为正、对报价货币为负。因此在完整的 28 个货币对中,这些贡献相互抵消,八个强弱值之和为零。面板将此作为内部校验:如果这些数值无法相互平衡,说明分解出了问题。这同时意味着,读数是彼此相对的,而非绝对的。一种货币本身并不"强",它只是相对于这一组
FREE
Synthesis X Neural EA
Thanaporn Sungthong
Forget Everything You Know About Trading Robots. Introducing Synthesis X Neural EA , the world's first Hybrid Intelligence Trading System . We have moved beyond the limitations of simple, indicator-based EAs to create a sophisticated, two-part artificial intelligence designed for one purpose: to generate stable, consistent portfolio growth with unparalleled risk management. Synthesis X is not merely an algorithm; it is a complete trading architecture. It combines the immense analytical power of
Brekaut
Chukwuemeka Kingsley Anyanwu
Brekaut, a powerful and intuitive trading indicator designed to take your trading experience to the next level. Built to simplify market analysis and provide timely insights, Brekaut offers traders a reliable way to identify key breakout opportunities across various asset classes, including stocks, forex, and cryptocurrencies. Brekaut cuts through the noise by highlighting potential breakout points where the market is poised for strong movement. This allows traders to make informed decisions a
FREE
Geek Engine
VALU VENTURES LTD
Geek Engine EA is a professional-grade automated trading system that combines multiple proven technical analysis strategies with sophisticated risk management and performance tracking capabilities. Designed for both novice and experienced traders seeking consistent, rule-based trading execution. KEY FEATURES Multi-Strategy Trading System - MA Crossover Strategy with multi-timeframe confirmation - RSI Momentum Strategy with divergence detection - MACD Signal Strategy with histogram analysis -
The   Clean Trading Sessions indicator  shows the most significant trading sessions for the Forex market, such as London, New York, Tokyo. The   Clean Trading Sessions indicator is a simple and, at the same time, quite functional Forex sessions indicator, developed for the MT5 terminal. It is available to download for free. How is this Forex market session indicator used? Traders normally use trading sessions to determine the volatile hours throughout the day, since the trading activities vary
FREE
Multi-Timeframe (MTF) MACD Indicator with Color Trend Modes & Anti-Flicker Overview This is an optimized, high-performance Multi-Timeframe (MTF) MACD Custom Indicator for MetaTrader 5 (MQL5). It allows you to monitor MACD dynamics from higher timeframes (e.g., H1, H4, D1) directly on your lower timeframe execution chart without chart lag or repainting issues. Key Features Zero Repaint / Anti-Flicker: Includes an optional strict closed-bar calculation mode ( InpStrictClosed ). It locks higher-tim
FREE
Shyft Lab Fattah Engulfing Block Zones is a gold-focused analytical indicator for MetaTrader 5. It turns the chart into a simple battle map: where the higher timeframe is strong, where price is likely to react, and where price is likely heading. It does not place trades. You stay in control. WHAT YOU GET - Fort zones: the higher timeframe areas that matter, drawn for you on the chart. - Kill zones: the areas where price may react, marked on the M30 chart. - Objective lines: the nearest target
Tradify unity
Saiful Izham Bin Hassan
Tradify 是一套量化交易系统,专为机构级的市场分析与执行而设计。该系统结合多时间框架协同策略、分形几何与斐波那契数学,以识别高概率的入场区域。 核心方法 系统基于三屏框架运行,确保仅在短期入场、中期趋势和长期偏向完全同步时才执行交易。该方法最大限度减少逆势波动的风险,并过滤市场噪音。 主要特点 多时间框架同步:自动对齐三个不同时间框架以确认趋势方向。 分形摆动分析:利用数学分形点识别关键支撑与阻力位。 斐波那契入场逻辑:在既定趋势内的优化回撤水平执行订单。 量化过滤器:采用赫斯特指数和香农熵来衡量趋势持续性及市场复杂度。 隐匿执行:使用内部止损和止盈水平管理仓位,不向经纪商服务器暴露这些水平。 自营交易公司风控:包含符合专业交易要求的硬性权益止损和每日回撤限额。 参数概览 宏观体制风险标量 宏观体制:可选择“强一致”、“冲突”或“危机”体制,以调整全局风险暴露和止损大小。 三屏设置 低时间框架:用于分形检测和入场执行的主图表。 中时间框架:用于二次确认趋势的中间图表。 高时间框架:用于确定主要市场偏向的最高级别图表。 风险管理 每日亏损限额:在EA停止前,
FJ UNIVERSE YIELD MACHINE(YILM):MetaTrader 5 多实例补仓智能交易系统,Wealth Index 槽位隔离 FJ Universe Yield Machine (简称 YILM )是一款 可多实例运行的 MetaTrader 5 补仓型 EA ,它的每一笔加仓手数都只根据 自己名下的持仓 计算,从不读取您的账户余额。正是这一个设计决定,让您可以 在同一个 MT5 账户上同时运行多个副本 ,覆盖多个品种、多个方向,而其中任何一个都不会抬高其他副本的风险。它是 FJ Universe M Printer 背后那套引擎的多实例版本,重写之后 不再需要一个专用的独立账户 。专为 外汇主要货币对 设计:EURUSD、GBPUSD、AUDUSD、NZDUSD、USDJPY、USDCAD 与 USDCHF。 重要风险提示,请在购买前务必读完: Yield Machine 是一套 补仓与加仓系统 ,属于马丁格尔类逻辑。它会对逆势的持仓继续加仓,并且 在设计上就是要持有浮动亏损 的。一段持续的单边行情可能造成 很深且持续很久的回撤 ,而相对账户资金明显过大的参数
该产品的买家也购买
Boba Analysis Suite
Trade Ready Solutions LLC
5 (1)
Boba Analysis Suite Boba Analysis Suite 是一款适用于 MetaTrader 5 的分析指标。它将市场结构、关键价格区域和整体市场背景整合到同一图表视图中。 该指标源于交易及交易教学的实践经验,旨在帮助用户建立有条理的分析流程:评估市场方向、识别重要价位,并结合多个时间周期进行分析。 结合市场背景进行分析 单个信号的意义取决于市场背景。Boba Analysis Suite 帮助用户将当前图表状况与更大范围的市场结构相结合,并根据预先制定的规则评估交易思路。 分析功能包括: **趋势与市场结构:**评估市场方向及相关结构背景。 **关键价格区域与价位:**在图表上直观标示值得进一步分析的重要区域。 **多时间周期:**整合不同时间周期的信息,评估整体市场背景。 **可视化分析流程:**直接在图表上查看分析信息。 自主做出交易决策 Boba Analysis Suite 适合希望系统分析图表并结合多个时间周期信息的交易者。 该指标用于辅助分析,不会开仓或平仓,也不能替代交易策略或风险管理。每一笔交易的决策均由用户自行做出。 使用与许可 平台:Meta
ARIPoint
Temirlan Kdyrkhan
1 (4)
ARIPoint is a powerful trading companion designed to generate high-probability entry signals with dynamic TP/SL/DP levels based on volatility. Built-in performance tracking shows win/loss stats, PP1/PP2 hits, and success rates all updated live. Key Features: Buy/Sell signals with adaptive volatility bands Real-time TP/SL/DP levels based on ATR Built-in MA Filter with optional ATR/StdDev volatility Performance stats panel (Success, Profit/Loss, PP1/PP2) Alerts via popup, sound, push, or email Cu
您好,交易员! 大多数散户交易者依赖于滞后的网页脚本。真正具有交易优势需要机构化的架构。 Astro AI 指标并非标准的图表叠加层。它是一个编译后的神经网络,包含两个代理,直接运行在您的终端上。 以下是该系统背后的具体技术: 1. 代理 1:分析师(图神经网络 - GNN) 市场并非孤立的价格柱;它们是相互关联的数据网络。 功能:代理 1 使用图神经网络来映射这些复杂的非线性关系。 优势:标准指标仅考虑单一的历史移动平均线,而我们的 GNN 可以实时处理深层的市场结构关系,在散户交易量发挥作用之前揭示隐藏的相关性。 2. 代理 2:执行器(近端策略优化 - PPO) 模式识别只是成功的一半。基于当前市场波动做出正确的决策,才是预测模型与滞后模型之间的区别所在。 功能:代理 2 使用 PPO(一种先进的强化学习算法)来确定最佳入场点。 优势:它持续调整交易策略,而非使用静态的“超买”或“超卖”线。它会分析当前市场状况并计算最可能的成交点。 执行桥接:通过 ONNX 集成到交易终端 如果执行速度慢,模式识别就毫无用处。我们已通过 ONNX(开放神经网络交换平台)
UZFX {SSS} 超短线智能信号 v5.0 MT5 是一款无重绘的高性能交易指标,专为在快速波动的市场中需要精准、实时信号的超短线交易者、日内交易者和波段交易者设计。该指标由 (UZFX-LABS) 开发,融合了价格行为分析、趋势确认和智能过滤技术,可在所有货币对和时间周期内生成高概率的买卖信号、预警信号以及趋势延续机会。 别再对交易犹豫不决了,开始遵循这一专为追求清晰、精准和纪律性市场执行的交易者设计的结构化信号系统吧。 相信我,这是 MQL5 上最优秀的指标之一,所以千万不要错过!!“为睿智交易者打造的智能信号” 最新 5.0 版本现已发布,价格可能会在未事先通知的情况下上涨至 499.99 美元,所以请尽快入手,以免错失良机!! 最终购买前!如果您想获取免费试用版,请通过 WhatsApp 号码 +923030751987 联系我!! 如果您遇到任何问题“或”有任何不明白的地方,请在私聊中向我咨询!!! 主要功能更新 • 自动买入和卖出信号检测 • 先进的反转识别逻辑 • 潜在市场反转前的预警信号 • 趋势延续确认信号 • 内置风险管理功能,包含入场点、止损点、TP1、
Azimuth Pro
Ottaviano De Cicco
5 (7)
Azimuth Pro V2:MT5合成分形结构分析与确认入场 概述 Azimuth Pro 是 Merkava Labs 推出的多层级波段结构指标。四层嵌套波段层级、锚定波段的VWAP、ABC形态识别、三时间框架结构过滤以及收盘确认入场——一个图表,一个从微观波段到宏观周期的完整工作流程。 这不是盲目的信号产品。它是一个以结构为先的工作流程,专为重视位置、背景和时机的交易者打造。 ️ 夏季促销 — 庆祝夏至与 The Oracle Pro 上市:Azimuth Pro 七折优惠,现价 279 美元(原价 399 美元)。限时夏季优惠。 1. V2的变化 合成多时间框架引擎 高时间框架分析从零开始重建,采用与Meridian Pro相同的专有合成架构。更清晰的HTF背景、稳定的实时行为、无经典MTF同步问题。合成引擎还解锁了 固定比率时间框架级联 (x2、x3、x4、x6)——不再在经纪商的固定时间框架之间任意跳转,您可以按图表时间框架的固定倍数分析结构,在每个尺度上保持相同的分形关系。 确认入场箭头 作为稳定且可恢复的执行层而设计的收盘确认箭头。当ABC设置形成且自适应确认逻辑
Spike Fakeout Detector
Brighton Mufaro Mudzingwa
PainX 400 FAKEOUT DETECTOR MT5 Custom Indicator  ·  Sell-Side Bias  ·  Scalping  ·  RSI(6) Filtered   OVERVIEW   The Spike Fakeout Detector is a non repaint precision technical indicator built exclusively for Crash / PainX synthetic indices on the platform. It is engineered around one of the most consistent and exploitable patterns on this instrument — the false breakout above resistance followed by a sharp price drop. Crash/PainX is a growing index that produces a significant price drop appr
ARICoins
Temirlan Kdyrkhan
ARICoin is a powerful trading companion designed to generate high-probability entry signals with dynamic TP/SL/DP levels based on volatility. Built-in performance tracking shows win/loss stats, PP1/PP2 hits, and success rates all updated live. Key Features: Buy/Sell signals with adaptive volatility bands Real-time TP/SL/DP levels based on ATR Built-in MA Filter with optional ATR/StdDev volatility Performance stats panel (Success, Profit/Loss, PP1/PP2) Alerts via popup, sound, push, or email Cust
AriFocus
Temirlan Kdyrkhan
AriFocus - Non-Repainting Buy/Sell Signals AriFocus - one clear signal. AriFocus marks buy and sell signals directly on the chart and suggests a stop-loss level for each one. Every signal is confirmed on bar close and never repaints. - Buy/sell arrows, confirmed on bar close - Suggested stop-loss level for every signal - Trend band and candle coloring to show direction at a glance - 10 ready-made presets, or your own settings (14 calculation methods) - Pop-up, push and email alerts with entr
GE Scalping Sniper
Jaturakoop Saoloek
• G signals are counter-move entries taken after an extended move. • E signals are entries in the direction of the prevailing trend. • Signals appear only after the candle has closed. A signal that is displayed will not disappear or move. 1. Entering a Trade Wait for the signal candle to close. Enter at the open of the next candle, or at the close of the signal candle if your platform allows it. Take only the signal types you have chosen to trade. Treat G and E as separate strategies with sepa
Gem SIGNAL
Shengzu Zhong
5 (1)
GEM Signal Pro GEM Signal Pro 是一款適用於 MetaTrader 5 的趨勢跟隨指標,專為希望在圖表上獲得更清晰訊號、更有結構的交易設定,以及更實用風險管理的交易者而設計。 它不僅僅顯示一個簡單的箭頭,GEM Signal Pro 還能以更清晰、更易讀的方式呈現完整的交易思路。當條件確認完成後,指標可在圖表上顯示進場價、止損價與止盈目標,幫助交易者更有效率地評估交易設定。 運作方式 該指標首先根據其內部邏輯識別有效的初始訊號。 當確認條件滿足後,GEM Signal Pro 會在圖表上顯示完整的交易設定。這讓交易者可以更清楚地看到交易結構,並減少手動分析與計算的工作量。 圖表上的交易價位 對於已確認的訊號,GEM Signal Pro 可顯示: 進場價 止損價 止盈 1 止盈 2 止盈 3 風險報酬比 這讓交易設定更容易理解,也有助於讓圖表分析更有條理。 內建風險管理 風險管理是此指標設計的重要部分。 止損位基於近期市場結構,結合附近的擺動高低點與可選的 ATR 緩衝距離。這能讓交易價位更貼近當前市場條件,而不只是依賴固定距離。 圖表資訊面板 GEM Si
Chimera Volume
Marko Milenkovic
适用于 MetaTrader 5 的 Chimera Volume 高级成交量分析与市场活跃度可视化 Chimera Volume 是一款为 MetaTrader 5 设计的自定义指标,旨在通过动态视觉框架分析标准化成交量活跃度,并展示市场参与度的变化。 该指标利用自适应标准化算法处理 Tick 成交量数据,生成关于成交量强度、累积阶段以及不同市场条件下活跃度变化的结构化表达。 与显示原始成交量数值的标准成交量指标不同,Chimera Volume 应用了额外的计算方法,以突出市场活动的相对变化并提高图表的可读性。 主要功能 根意图直方图 (Root Intent Histogram): 一种动态直方图,用于可视化标准化成交量强度和市场参与度。该直方图使用自适应颜色过渡,以区分活跃度增加时期与参与度减弱时期。 惯性线 (Inertia Line): 一条由标准化成交量计算得出的平滑分析线。旨在帮助交易者观察成交量动能的变化,并监控扩张期与收缩期之间的转换。 信号线 (Signal Line): 一个用于比较短期和长期成交量表现的次级计算层,在评估市场状况时可作为辅助参考。 自适应成交量
Meravith Scanner
Ivan Stefanov
5 (3)
MERAVITH SCANNER 是一款适用于 MetaTrader 5 的专业金融市场指标,将多种分析工具整合为一个统一的系统。它基于专有的成交量加权平均价格(VWAP)方法自动完成所有计算,完全消除主观判断。 该指标适用于所有资产类别(外汇、股票、指数、大宗商品、加密货币)以及从 M1 到 Monthly 的所有时间周期。其核心原理是价格跟随成交量。MERAVITH 识别机构资金成交量的集中区域,并从该集中区域中推导出数学上精确的价格水平。它不预测,不推测。它只计算。 使用 MERAVITH SCANNER,您可以在 2–3 分钟内扫描全部 28 个主要外汇货币对的所有时间周期。您也可以扫描任何您选择的市场——例如,大约 100 只股票约需 10 分钟。 该指标计算耗尽水平、平衡线、偏差、统计水平以及目标投射。 图表元素 Origin Point 标记所有计算的起始位置。指标会自动将其放置在最佳位置。红色标签(TOP)表示市场高点并带有看跌倾向。绿色标签(BOTTOM)表示市场低点并带有看涨倾向。 Sentiment Line 是一条动态曲线,反映基于成交量加权计算得出的市场情绪。
TrendMaestro5
Stefano Frisetti
note: this indicator is for METATRADER4, if you want the version for METATRADER5 this is the link:  https://www.mql5.com/it/market/product/108106 TRENDMAESTRO ver 2.5 TRENDMAESTRO recognizes a new TREND from the start, he never makes mistakes. The certainty of identifying a new TREND is priceless. DESCRIPTION TRENDMAESTRO identifies a new TREND in the bud, this indicator examines the volatility, volumes and momentum to identify the moment in which there is an explosion of one or more of these da
Meravith MT5
Ivan Stefanov
5 (3)
MERAVITH 是一款适用于 MetaTrader 5 的多周期成交量与流动性指标,它在每一个时间周期上显示趋势、支撑与阻力区域、入场、目标和止损。它为您提供完整的市场流动性地图,一个对冲基金风格的流动性工具,并用专有的成交量加权平均价格方法自动完成全部计算,因此没有主观解读。 适用于外汇、黄金(XAUUSD)、指数和加密货币,适用于所有时间周期。 购买后赠送:一套关于如何用 MERAVITH 交易的视频课程。购买后请给我发消息。 MERAVITH 的功能 分析所有时间周期,并显示每个周期上正在生效的趋势。 标记流动性区域(Volume Equilibrium),即多头与空头成交量相等的位置。 将所有时间周期的流动性水平直接显示在您的图表上。 写出市场的文字分析供您参考。 根据当前趋势计算入场、目标、支撑位和止损。 计算您交易的风险回报比。 按您的账户余额计算仓位大小,并估算潜在利润。 在市场出现重要变化时提醒您:警报、电子邮件和推送到手机的通知。 主要线条 Bullish / Bearish Volume Exhaustion 线:目标位。 趋势线:随趋势改变颜色(多头或空头),显
Cycles Plotter
Edoardo Centorame
Cycles Plotter 带移动平均线和开始日期的可自定义周期指标 Cycles Plotter 是一种高级技术指标,可根据用户输入绘制两个完全可自定义的正弦周期。它不会自动生成周期:所有周期都完全根据用户设置的参数计算,为交易者提供一种视觉工具,用于研究价格波动和潜在的趋势变化,而不产生自动信号或预测。 关键点: 用户定义的周期:周期 1 P1 和 2 P2 完全由用户配置。可以设置周期长度、幅度、移动平均线以及精确的开始日期和时间。如果用户未输入参数,则不会绘制任何周期。 幅度控制:每个周期可以具有不同的幅度,从而可以相对于参考移动平均线调整波动的高度。 趋势检测:快速和慢速移动平均线表示周期的方向: Fast MA 大于 Slow MA 上涨阶段 绿色 lime Fast MA 小于 Slow MA 下跌阶段 magenta 红色 Fast MA 约等于 Slow MA 横向阶段 flat 橙色 蓝色 周期绘图:每个周期有三条独立的线: 上涨阶段 绿色 lime 下跌阶段 magenta 红色 横向阶段 flat 橙色 蓝色 可自定义的开始日期和时间:可以定义每个周期开始绘制
AriX
Temirlan Kdyrkhan
1 (4)
AriX Indicator for MT5 A powerful trend-following and signal-evaluation tool AriX is a custom MT5 indicator that combines Moving Averages and ATR-based risk/reward logic to generate clear buy/sell signals. It visualizes dynamic SL/TP levels, evaluates past trade outcomes, and displays win/loss statistics in a clean on-chart panel. Key features include: Buy/Sell signals based on MA crossovers ATR-based SL/TP1/TP2/TP3 levels with visual lines and labels Signal outcome tracking with real-time stat
看清市场真正在做什么。   在您眼前实时观察三大市场阶段(收缩、扩张、趋势),并在趋势阶段的早期阶段抓住更优的入场点。   不要再猜测。开始像机构和聪明钱那样解读市场。   Apex Market Structure Pro(MT5 版)是一款精准的聪明钱分析工具,它剥离噪音,向您展示每根 K 线之下的真实结构:流动性、结构转变、吸   筹区域与趋势偏向,全部呈现在一个简洁、专业的图层中。专为厌倦了滞后指标、准备以清晰视角交易的严肃交易者打造。   重要提示:本指标专为 Heikin Ashi(平均足)K 线设计。使用前请将图表切换为 Heikin Ashi,以释放其全部威力。全部分析都围绕 Heikin   Ashi 的价格流构建。正是在这里,Apex Market Structure Pro 发挥出最佳表现。   交易者为何选择 Apex Market Structure Pro:   流动性,一览无遗: 瞬间看清止损池所在之处。卖方与买方流动性会被自动标注。实时关注尚未被扫的价位,捕捉价格攫取流动性并反转的精确时   刻。在聪明钱交易的地方交易。   会说话的结构:
FX-AIEA 供给需求区智能识别指标(Supply and Demand Indicators MT5)——技术原理与参数讨论 版本:2.51 | 适用平台:MetaTrader 5 引言 供给需求区是机构订单流的重要表现形式,相比传统支撑阻力位能更直接地反映买卖力量的失衡。本指标尝试通过算法自动识别高概率供需区域,以减少手动绘制的耗时与主观性。其核心逻辑基于自适应 ZigZag 算法,提取波峰波谷并生成区域标识 。 核心技术特点 全自动绘制机制 :基于改良版 ZigZag 动态提取有效极值,标记潜在供给区与需求区。指标遵循 MQL5 原生   prev_calculated   机制,在新 K 线生成时自动重绘,支持跨周期强制计算( Forced_TimeFrame   参数)。 区域边界模式 :支持宽带(覆盖K线影线极值)与窄带(仅覆盖实体)两种模式,用户可通过   use_narrow_bands   参数切换,以适应不同交易风格。 滤噪算法 :启用   kill_retouch   后,自动剔除被后续行情反复轻触但未有效突破的弱势区域,以提升信号有效性。 视觉与性能 :支持自

ORB Seeker MT5
Marcela Goncalves De Oliveira
特价促销,限量供应,保持产品稀缺性! 仅售 599 美元! 购买后请联系我以获取奖励的 ORB Seeker EA 和个人优化设置文件。 自信地捕捉干净利落的比赛片段! ORB Seeker MT5 是一款专业的开盘区间突破 (ORB) 指标,专为追求准确性、简洁性、灵活性和清晰图表结构的交易者而设计。 它能自动绘制任何交易品种的盘前或自定义交易时段区间,然后给出清晰的突破信号,包括入场点、止损点、止盈点以及可选的50%部分止盈位。所有数据均实时计算并直接显示在图表上。 您可以选择交易伦敦开盘、纽约交易时段、亚洲交易时段,或者自定义交易时段。ORB Seeker MT5 会自动适应您选择的交易时段,让您精准掌握市场波动范围、突破位和交易位。 每次购买均免费赠送 ORB Seeker EA 智能交易系统。该 EA 系统读取指标的突破信号并可自动下单,您可以选择手动交易,也可以让 EA 系统根据指标的信号逻辑自动处理入场。   为什么选择 ORB Seeker MT5 支持多个交易时段 - 您可以自行设置伦敦、纽约、亚洲或自定义交易时段的盘前交易时间和交易时段。 完整的突破视觉效果 -
Volume Arrow Signal Product Description Volume Arrow Signal is a smart trading indicator designed to help traders identify potential buy and sell opportunities using price action, volume behavior, and directional arrow signals. The indicator places clear arrows directly on the chart, making it easy to spot possible market reversals, trend continuations, and entry opportunities without spending hours analyzing charts manually. Whether you are trading Gold (XAUUSD) , Forex pairs, Indices, or Crypt
Gold Xausd Hunter
Metin Erkamoglu
5 (2)
MATADOR GOLD XAUUSD M5 Scalp Signals for MT5 MATADOR GOLD is a decision-support indicator for MetaTrader 5, designed for traders who analyze short-term Gold movement on the M5 timeframe. The indicator does not open, close, or manage trades automatically. It provides buy and sell signal guidance so the user can make their own trading decisions according to their risk plan, broker conditions, and trade management rules. Main purpose MATADOR GOLD is built to help traders avoid noisy signal flow and
Footprint 是一款用于分析订单流 (Order Flow) 和成交量的指标。 它有助于在聚类层面识别市场结构,寻找活动增加的关键区域,并直接在图表上使用过滤器,无需不断打开设置窗口。 Footprint 指标功能 Bid x Ask, Delta 聚类图表; 图表上的控制面板; 用于调整过滤器的滑块; Absorption; Initiative; Stacked Imbalances; Big Trades; dPOC / Dynamic Point of Control; Delta; 侧边市场轮廓 (Market Profile); 累计 Delta (Cumulative Delta)。 核心优势 在密集的 Tick 流上快速计算和渲染数据; 图表内管理 — 主要模式和过滤器可直接在图表上切换,无需打开设置; 通过过滤突出显示重要的价格水平和聚类; 视觉信号高亮:吸收、主动性、失衡和大单交易; 按日、周或当前可见范围显示的侧边轮廓; 包含总成交量、Delta 和累计 Delta 的面板。 Footprint 帮助您确定: 重要成交量集中的位置; 主动性压力出现的位置;
Zain Gold ScalpingV5
Ahmed Gamal Abdel Nasser Mohamed
Zain Gold Scalping V5 is a technical analysis indicator for MetaTrader 5 designed for Forex and Gold markets. It provides chart-based market information, trend analysis, signal conditions, and an on-screen dashboard to help traders analyze price movement across multiple timeframes. Main Features The indicator supports multiple timeframes, including M1, M5, M15, M30, H1 and higher timeframes. It can be used with Gold (XAUUSD), Forex currency pairs, indices and other supported instruments. The in
Quantum Momentum Guard (QMG) Advanced Breakout & Momentum Indicator for MetaTrader 5 Quantum Momentum Guard (QMG) is a next-generation MetaTrader 5 trading indicator designed to identify high-probability breakout opportunities using a powerful combination of advanced momentum analysis and high-level mathematical calculations . Unlike ordinary indicators that generate signals based on a single condition, QMG confirms every breakout with momentum strength and mathematical validation , ensuring
KenKem Master Volume Profiler - Brief Introduction A Display-only volume-profile cockpit for XAUUSD, BTCUSD and other liquid symbols. Draws profile structure, multi-timeframe flow, EMA trend and study-only setup markers. Places no orders. Not a signal service.  It maps where the market has actually traded and reads recent order flow, so you can see structure and lean at a glance.  What it shows: Master and local volume profiles (POC and value-area high/low) - the price shelves that matter. A liv
VTrende Pro
Andrii Diachenko
5 (1)
VTrende Pro - MTF indicator for trend trading with a display panel for MT5 *** Videos can be translated into any language using subtitles (video language - Russian) Although the signals of the VTrende Pro indicator can be used as signals of a full-fledged trading system, it is recommended to use them in conjunction with the Bill Williams TS. VTrende Pro is an extended version of the VTrende indicator. Difference between Pro version and VTrende: - Time zones - Signal V - signal 1-2 waves -    S
First time on MetaTrader, introducing IQ Star Lines, an original Vedic Astrology Based Intraday Trading Indicator. We don't offer free or bonus indicators in exchange of reviews from you. You won't need any free products with this indicator to make it work. ;) Enjoy! Welcome to the new and updated  IQ Star Lines , the ultimate fusion of ancient planetary cycles and modern quantitative trading, published for the first time on Metatrader. This is an indicator built by the developer, who has spent
Navigator Equilibrium:在一个窗口中同时呈现市场阶段、动量、峰值与背离 不必再在动量震荡指标、趋势过滤器、波动率指标和背离扫描工具之间来回切换。Navigator Equilibrium 将它们整合到一个彩色编码的窗口中,让您一眼看出动量是在增强还是减弱、哪一方占主导、市场处于趋势还是盘整,以及价格与动量在哪里出现分歧。 它既适合希望清晰解读市场的主观交易者,也适合需要干净、有文档说明的缓冲区的 EA 开发者。 与众不同之处 五种状态的柱状图,而不仅仅是多或空。 除了方向之外,颜色还显示动量是在增强、在减弱,还是已经处于峰值状态。 零轴兼具市场状态指示器的作用。 它会变色,告诉您市场处于趋势还是盘整。 一眼看清“谁在主导”。 柱状图顶部的标记线会相对于慢速均线变色,同时提示何时可以考虑逆势交易。 峰值跟踪。 每个柱状图峰值都会与同侧的上一个峰值比较,让您看出动量是在扩张还是收缩。 自动识别四种背离: 常规与隐藏、看涨与看跌。它们以箭头绘制,并可附带文字;滚动或缩放图表时,文字与箭头之间始终保持固定的像素间距。 可切换的计算模式 ,包括柱状图、盘整检测和峰值检测,便于
Boom & Crash & PainX & GainX Ultimate Spike Detector Trade Spikes With Confidence — Not Guesswork Catching spikes should be one of the most profitable strategies in synthetic markets. But for most traders, it becomes one of the most frustrating. You enter too early… price goes against you. You wait for a spike… it never comes. You finally catch one… but don’t know whether to hold or close. You make profit… then give it all back because there’s no exit plan. This is exactly the problem the Ultim
作者的更多信息
The Time Above Equilibrium Pattern identifies potential exhaustion points by measuring how long price remains above or below a dynamic equilibrium level. Creator:  https://www.quant-atlas.com/ The equilibrium line acts as a smoothed reference point for market balance. When price spends an extended period above this line, the indicator tracks the duration of that move and monitors whether upward support is beginning to weaken. A bearish exhaustion signal may appear when price has remained above e
FREE
Fibonacci Timing Indicator by Quant Atlas Creator:  https://www.quant-atlas.com/ Fibonacci Timing Indicator is a clean signal based trading tool designed to identify potential turning points through a timing sequence framework inspired by Fibonacci spacing. The indicator studies price behavior across selected historical reference points and looks for repeated directional pressure. When the sequence reaches completion, it plots a clear signal directly on the chart. Signal Display • Green upward t
FREE
Orange Indicator by Quant Atlas Creator:  https://www.quant-atlas.com/ Orange Indicator is a clean reversal focused indicator for MetaTrader 5, designed to highlight potential turning points directly on the chart using simple orange buy and sell markers. The indicator focuses on moments where price may be transitioning out of short term exhaustion and into a possible reaction phase. When a bullish setup appears, an orange upward triangle is displayed below the candle. When a bearish setup appear
FREE
Yellow Indicator by Quant Atlas Creator:  https://www.quant-atlas.com/ Yellow Indicator is a clean reversal focused trading tool designed to highlight potential turning points using momentum behavior and RSI structure. The indicator looks for moments where momentum has moved through an important zone and begins to show signs of exhaustion. When conditions align, it plots dark yellow triangle signals directly on the chart. Both bullish and bearish signals use the same dark yellow visual identity,
FREE
Creator:  https://www.quant-atlas.com/ Freyja is a visual pattern based indicator designed to highlight potential exhaustion and reversal areas using a structured time and price framework. The indicator studies how price behaves across repeated timing sequences and marks areas where the market may be approaching a potential turning point. It is built to give traders a clean visual layer that can be added to their existing analysis process. Signal Categories • Blue triangles Low conviction patte
FREE
K's Synapse is a market structure indicator designed to provide a clear visual reading of bullish pressure, bearish pressure, and uncertainty directly on the price chart. Creator:  https://www.quant-atlas.com/ The indicator evaluates recent price structure across multiple reference points and converts the results into colored dots, rolling market surety percentages, and high intensity triangle signals. Dot Structure • Blue dots represent bullish price structure • Red dots represent bearish price
FREE
Red Indicator  by Quant Atlas Creator:  https://www.quant-atlas.com/ Red Indicator is a clean reversal focused tool designed to highlight moments where price may be moving away from an extreme condition and entering a potential turning zone. The indicator uses a price derived volatility framework to detect areas where market pressure may have become stretched. When conditions align, it plots red triangle signals directly on the chart. Both bullish and bearish signals use the same red visual iden
FREE
Green Indicator by Quant Atlas Creator:  https://www.quant-atlas.com/ Green Indicator is a clean reversal focused trading tool designed to highlight potential turning points using momentum pressure and directional slope behavior. The indicator studies the relationship between momentum position and momentum direction. When market pressure reaches an extended condition and begins to shift, the indicator plots green triangle signals directly on the chart. Both bullish and bearish signals use the sa
FREE
Blue Indicator by Quant Atlas Creator:  https://www.quant-atlas.com/ Blue Indicator is a clean reversal focused trading tool designed to detect potential turning points through a slope based momentum framework. The indicator studies the momentum of price slope and highlights moments where that momentum begins to move away from an extreme zone. When conditions align, it plots blue triangle signals directly on the chart. Both bullish and bearish signals use the same blue visual identity, giving th
FREE
Violet Indicator  by Quant Atlas Creator:  https://www.quant-atlas.com/ Violet Indicator is a clean reversal focused trading tool designed to identify moments where price may be shifting away from an extended directional condition. The indicator uses a price derived trend framework to detect moments where market structure may be changing. When conditions align, it plots violet triangle signals directly on the chart. Both bullish and bearish signals use the same violet visual identity, giving the
FREE
Median is a clean price structure indicator designed to plot the rolling median of recent highs and lows directly on the chart. Creator:  https://www.quant-atlas.com/ The indicator calculates the 50th percentile of recent low prices and high prices over a selected lookback window. This creates two dynamic reference lines that can help traders read the central structure of recent price behavior. Signal Display • Purple line: rolling median of lows • Red line: rolling median of highs These lines
FREE
SwapGuard
Sofien Kaabar
Swap Guard Pro is a non directional MT5 dashboard designed to help traders understand overnight holding costs before they become a silent drag on performance. The indicator displays long and short swap values, estimated daily holding cost, triple swap day, next rollover timing, current spread, tick value, margin requirement, open exposure, accrued swap, floating PnL, and projected next rollover cost directly on the chart. It is built for traders who hold positions overnight, trade multi asset po
FREE
Trader Cockpit
Sofien Kaabar
Trader’s Cockpit is a simple non directional dashboard for MetaTrader 5 designed to give traders a quick, clear view of their trading environment directly on the chart. Creator:  https://www.quant-atlas.com/ The indicator does not generate buy or sell signals, does not predict market direction, and does not perform any trading action. Its purpose is to make the trader’s daily workflow easier by centralizing useful account, symbol, spread, session, and broker condition information in one compact
FREE
Indigo Indicator by Quant Atlas Creator:  https://www.quant-atlas.com/ Indigo Indicator is a clean reversal focused trading tool designed to identify potential turning points through a price sequence framework. The indicator studies how price has behaved across multiple prior reference points and highlights moments where that sequence may be shifting. When conditions align, it plots indigo triangle signals directly on the chart. Both bullish and bearish signals use the same indigo visual identit
FREE
Reversal Indicator I   by Quant Atlas Creator:  https://www.quant-atlas.com/ Reversal Indicator I is a clean reversal focused indicator designed to help traders identify potential bullish and bearish turning points directly on the chart. The indicator highlights moments where the market may be approaching exhaustion and where a tactical reversal setup may be forming. Signals are displayed with simple visual triangles, making the tool easy to read without cluttering the chart. Key idea Markets of
Three Dimensional Reversal Indicator  by Quant Atlas Creator:  https://www.quant-atlas.com/ Three Dimensional Reversal Indicator is a clean and focused reversal tool designed to identify potential market turning points through a three dimensional view of price behavior. The model combines three key dimensions: • Time How long market pressure has remained one sided. • Price Where price is currently positioned relative to its recent behavior. • Price Derived Structure A transformed view of pric
Fibonacci Moving Average by Quant Atlas Fibonacci Moving Average is a visual trend structure indicator built around a layered Fibonacci based moving average framework. The indicator plots two dynamic average lines directly on the price chart, creating a clean view of how price behaves relative to broader trend structure. The lines automatically change color depending on the position of price, making market direction easier to read at a glance. Visual Logic • Blue line state: price is trading abo
The Rainbow Dragon Indicator by Quant Atlas Creator:  https://www.quant-atlas.com/ The Rainbow Dragon is a composite signal engine that aggregates the seven Rainbow indicators — Blue, Green, Indigo, Red, Violet, Yellow, and Orange — into a single confluence-based reading. Rather than relying on any one model, it treats each Rainbow component as an independent voter and fires only when enough of them agree, giving you a diversified, multi-method read on the market instead of a single point of vie
HorizonsFX Stability is a multi currency Expert Advisor for MetaTrader 5 designed to trade major FX pairs using a structured daily signal model. The system scans several major currency pairs, evaluates directional pressure, volatility behavior, and market structure conditions, then opens trades when the internal score reaches a valid setup. Creator:  https://www.quant-atlas.com/ The product is designed for traders who want a systematic FX robot with clear risk controls, multi pair diversificatio
Yubel Divergence Detection is a momentum exhaustion indicator for MetaTrader 5 designed to help traders identify potential directional turning points when price movement begins to lose internal strength. Creator:  https://www.quant-atlas.com/ The indicator focuses on divergence style behavior and momentum fatigue, highlighting moments where the market may be preparing for a reversal, continuation failure, or short term directional shift. It is built as a visual signal tool, giving traders a fast
Dynamic RSI Volatility Based Creator:  https://www.quant-atlas.com/ Dynamic RSI Volatility Based is an adaptive momentum indicator designed to adjust its RSI sensitivity according to changing market volatility. Instead of relying on one fixed RSI period at all times, the indicator adapts its internal lookback based on recent volatility conditions. When volatility changes, the RSI calculation becomes more responsive or smoother depending on the current market environment. This gives traders a mor
Euro Pulse is a MetaTrader 5 Expert Advisor designed specifically for EURUSD trading. The system focuses on short holding periods, controlled exposure, and structured trade selection instead of aggressive recovery methods or high risk position scaling. Creator:  https://www.quant-atlas.com/ The Expert Advisor is built for traders who want a focused EURUSD robot with simple risk behavior, clear execution logic, and a clean trading profile. It does not use martingale, grid trading, averaging down,
Hyper Reversal Pattern Hyper Reversal Pattern (HRP) is a market-turning-point indicator designed to identify moments when a directional move may be reaching exhaustion and price begins to show evidence of reversal. Rather than reacting to a single technical condition, HRP evaluates multiple dimensions of market behavior and waits for a meaningful reversal setup to form before printing a signal. The result is a selective visual indicator intended to help traders identify potential short-term and
筛选:
无评论
回复评论