Hyper Reversal Pattern

Hyper Reversal Pattern

Hyper Reversal Pattern (HRP) is a market-turning-point indicator designed to identify moments when a directional move may be reaching exhaustion and price begins to show evidence of reversal.

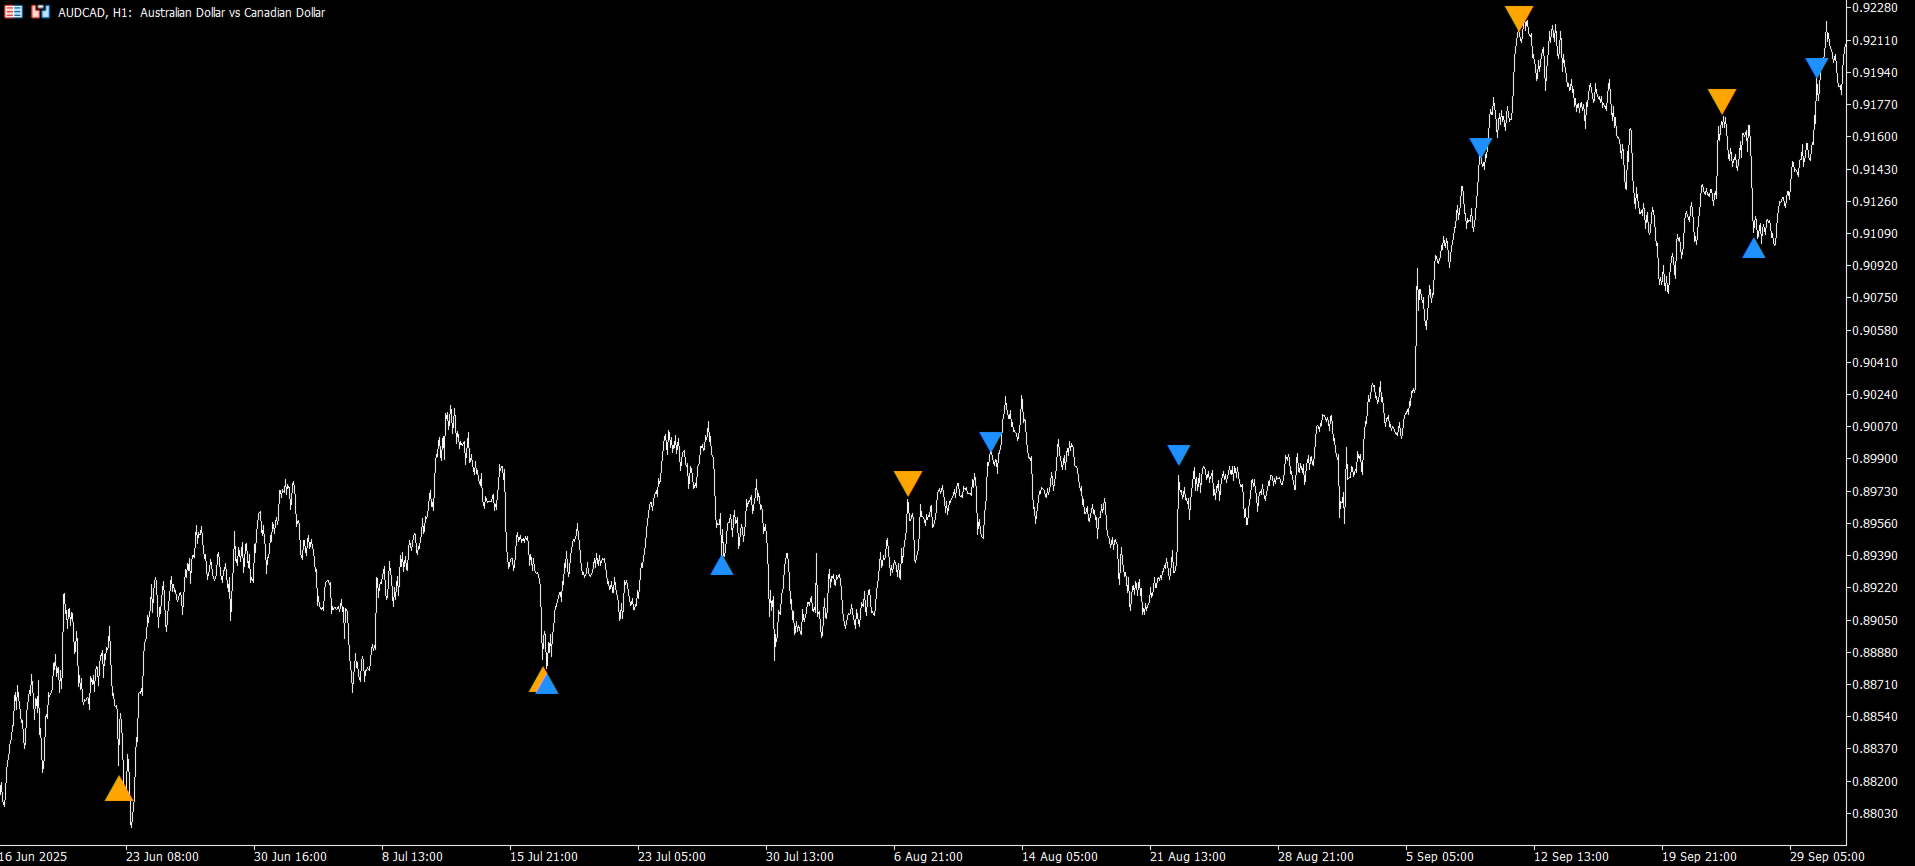
Rather than reacting to a single technical condition, HRP evaluates multiple dimensions of market behavior and waits for a meaningful reversal setup to form before printing a signal. The result is a selective visual indicator intended to help traders identify potential short-term and medium-term turning points without cluttering the chart.

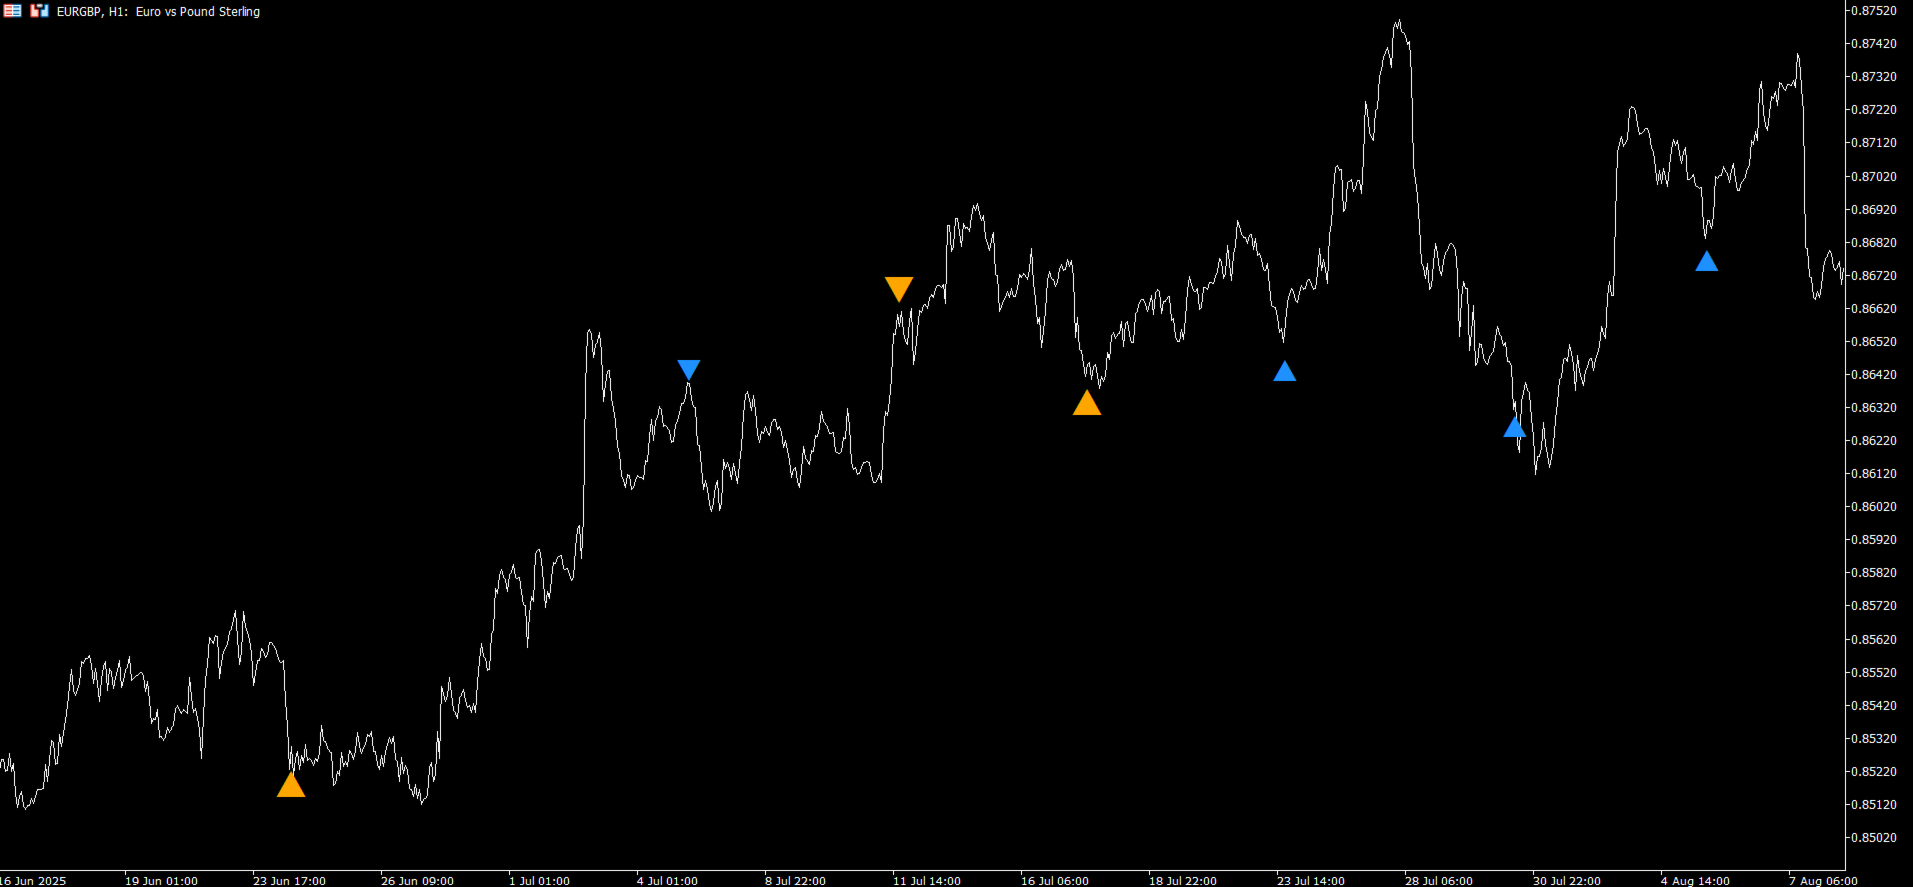
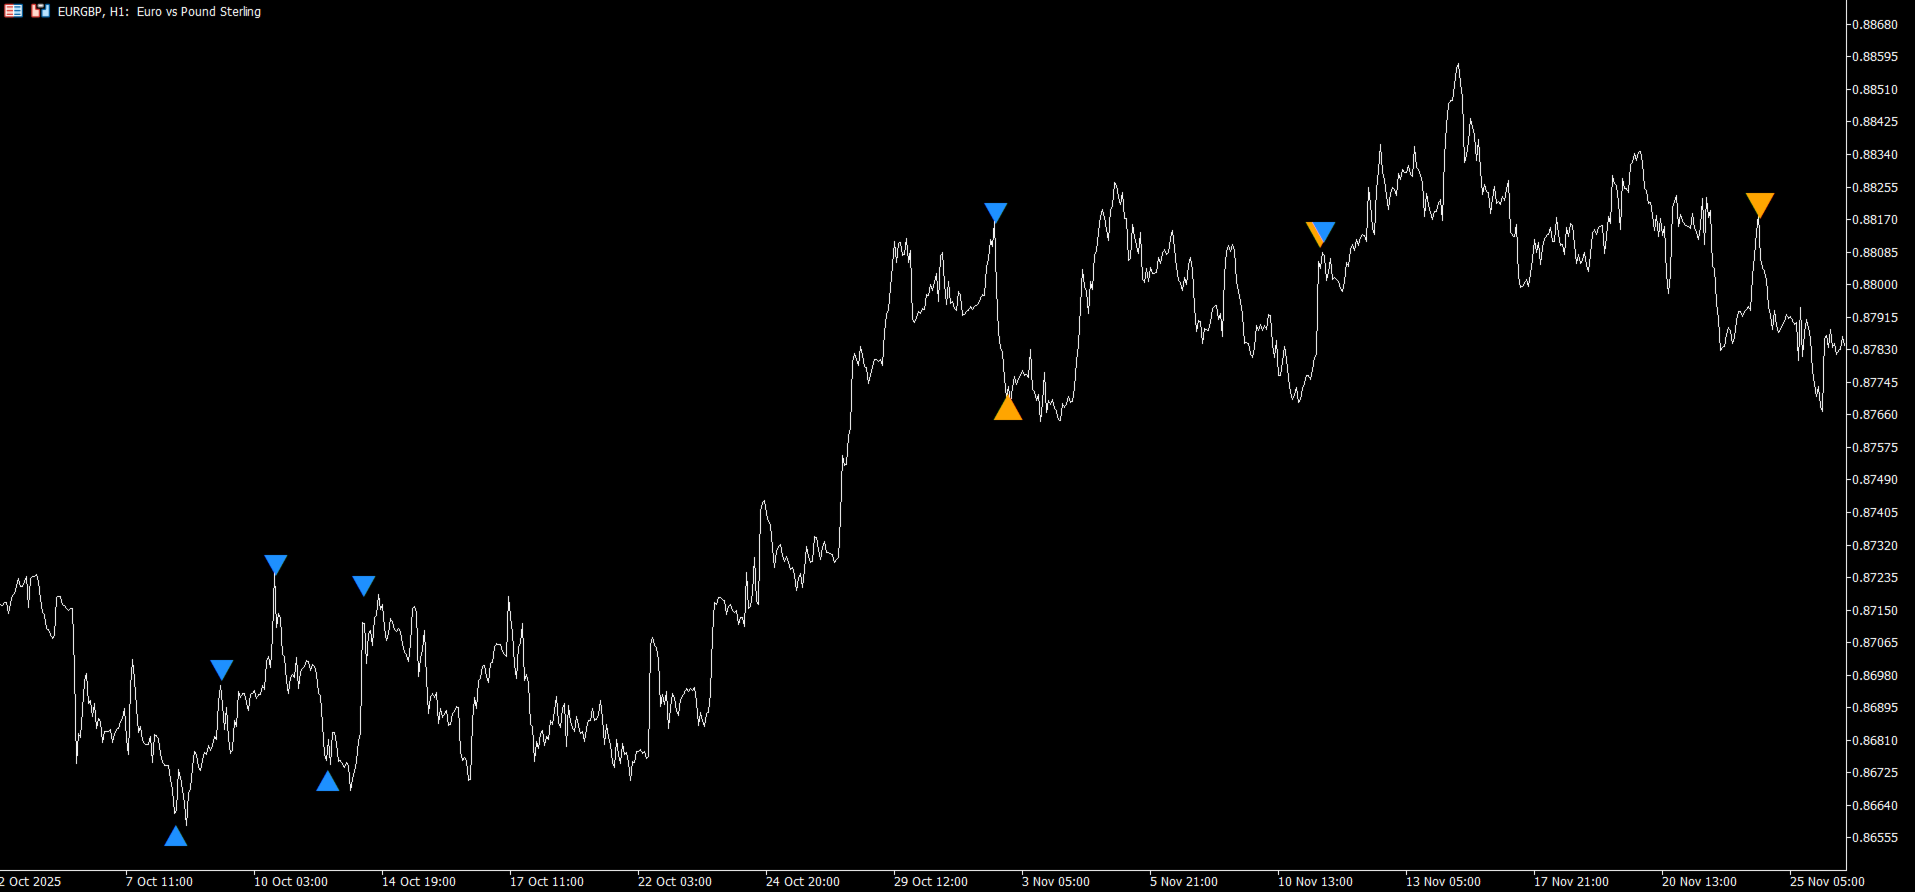
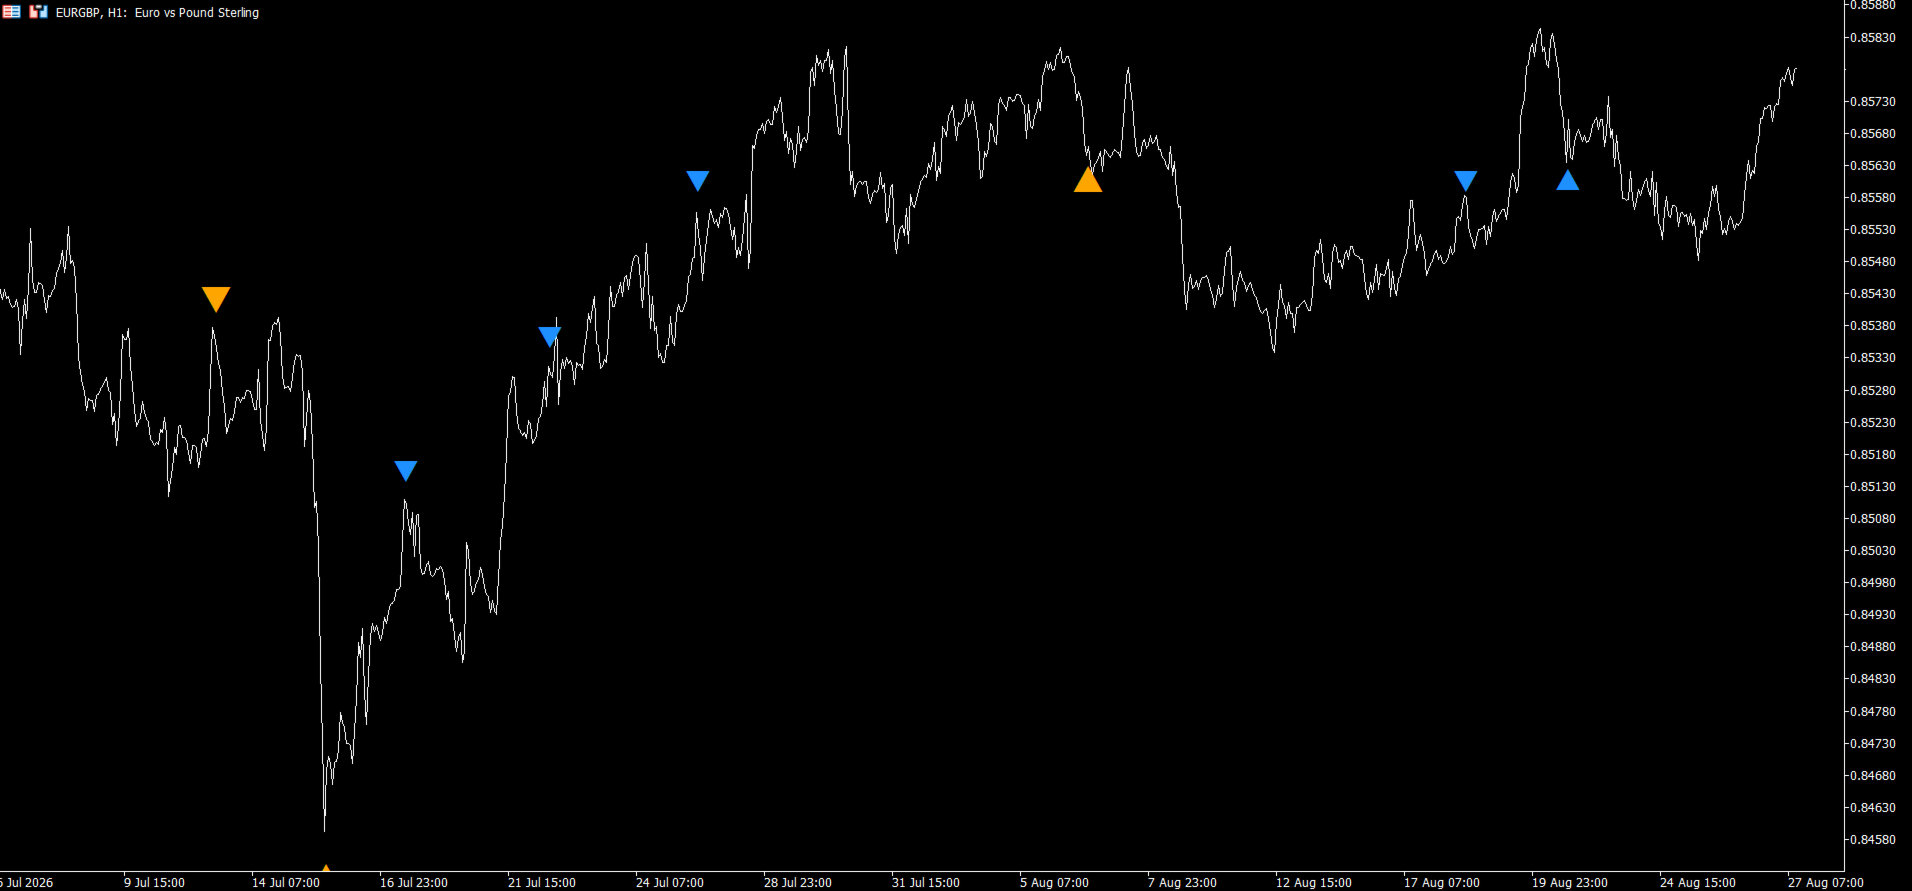
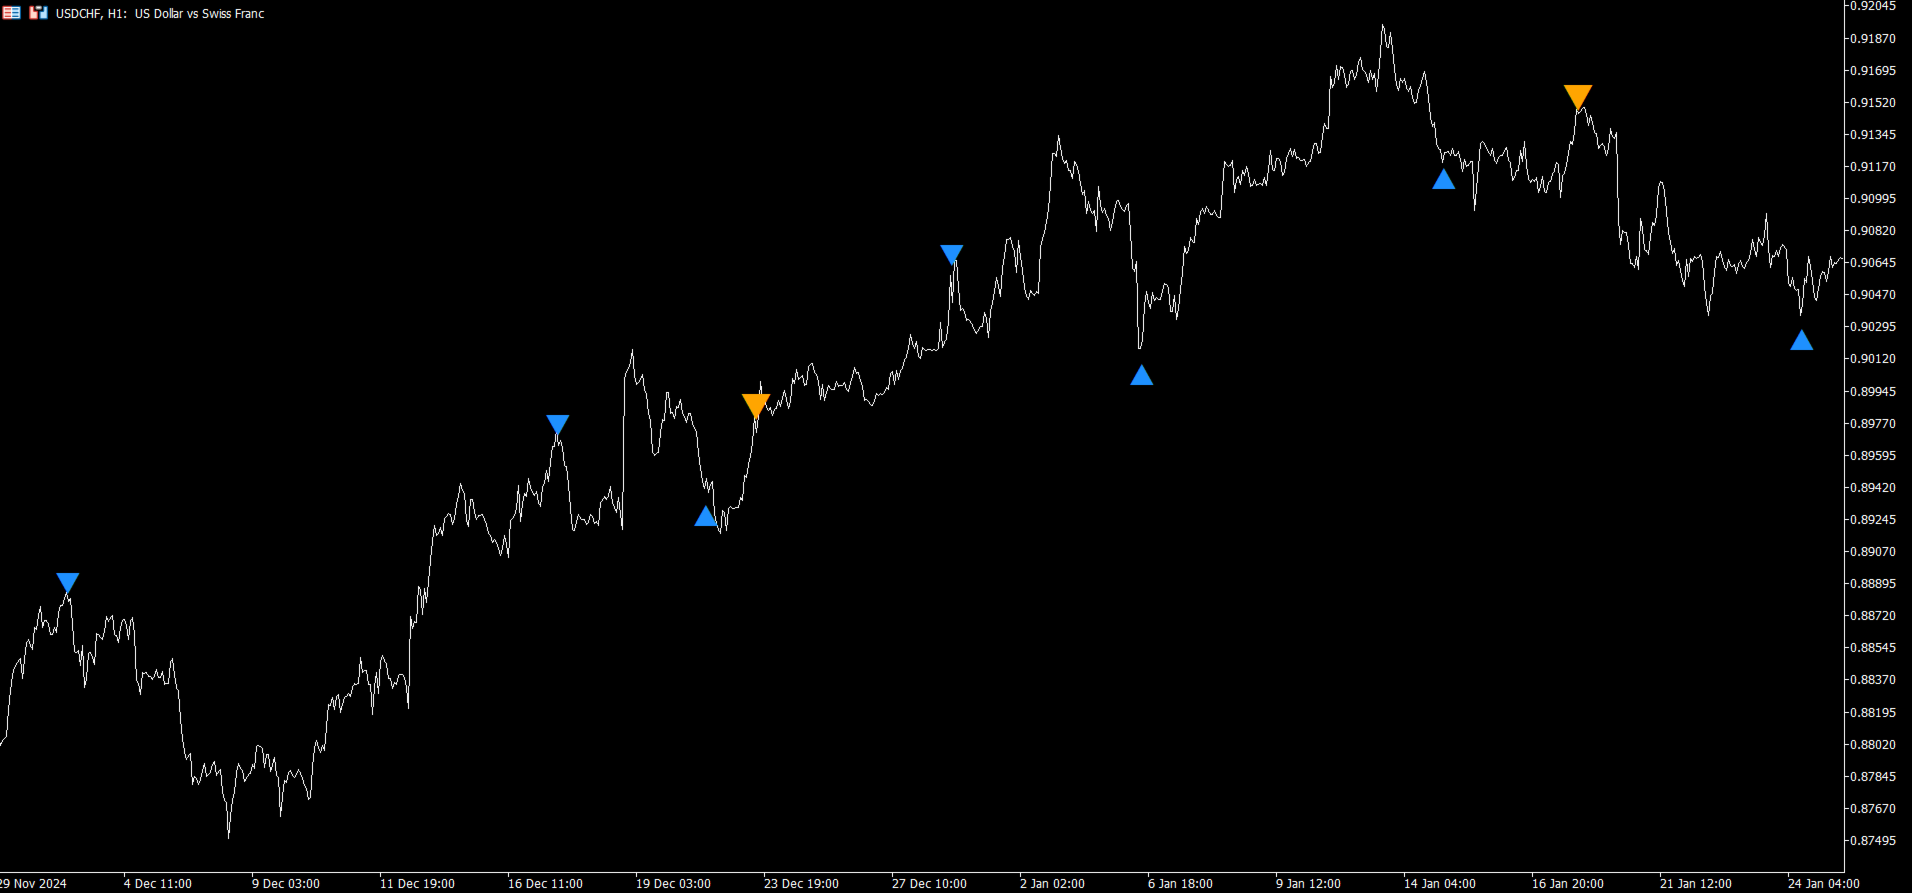
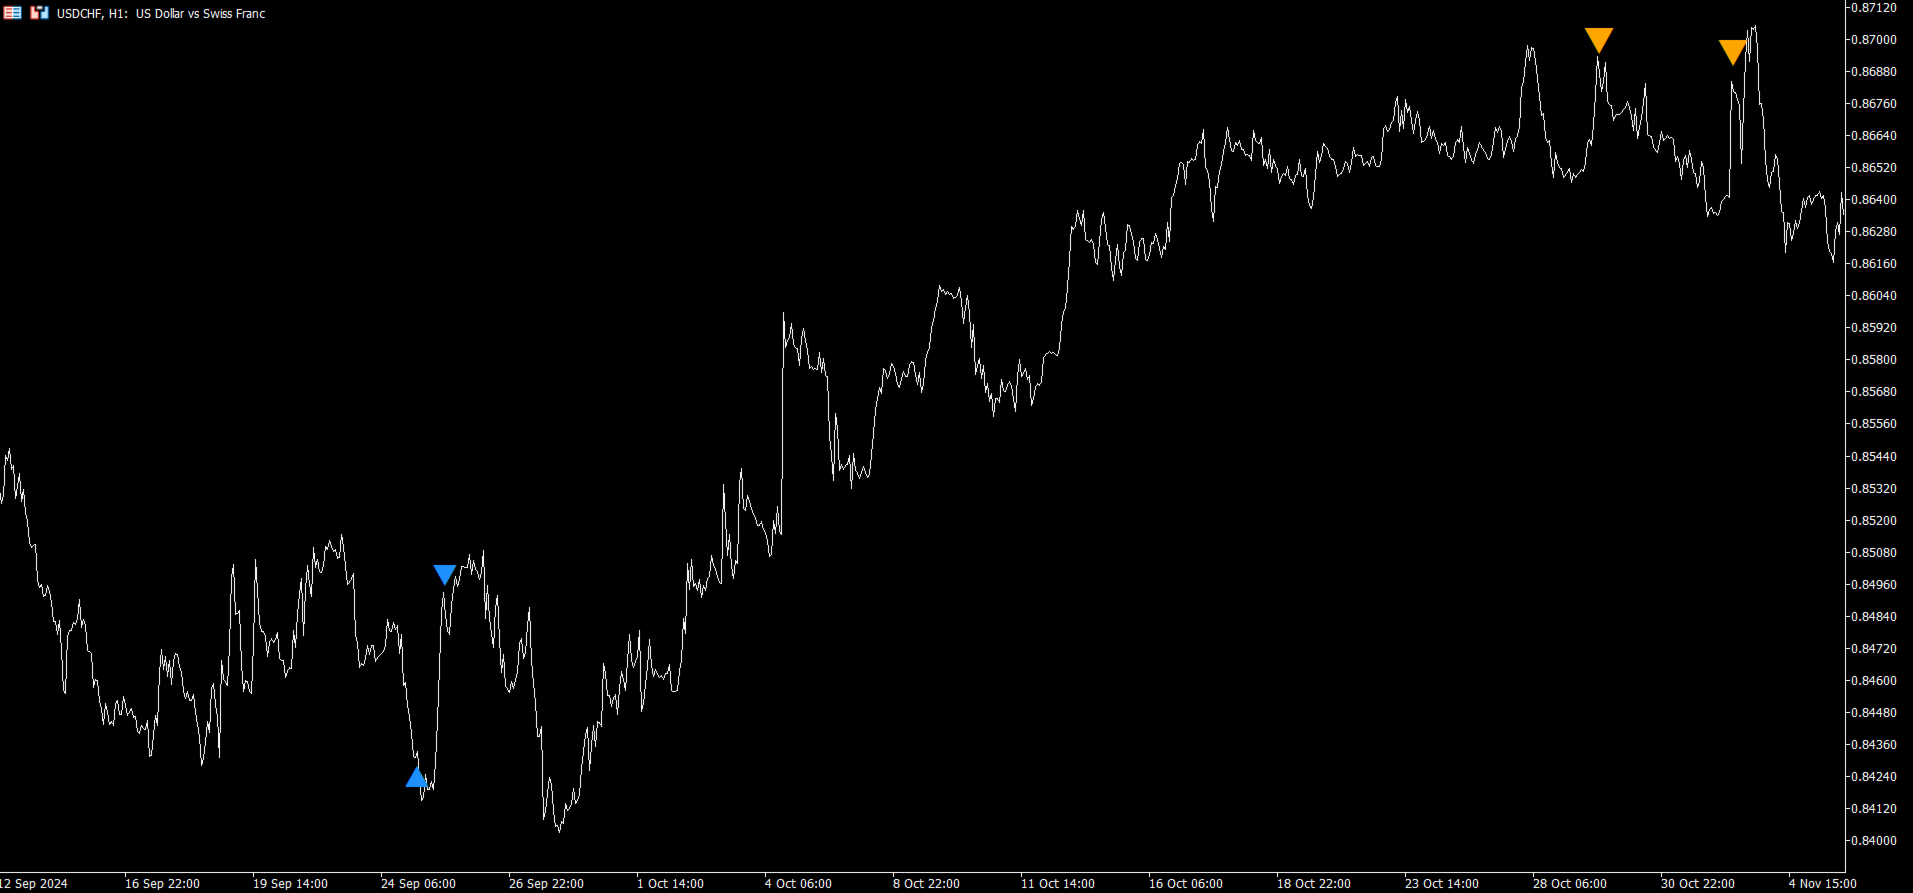
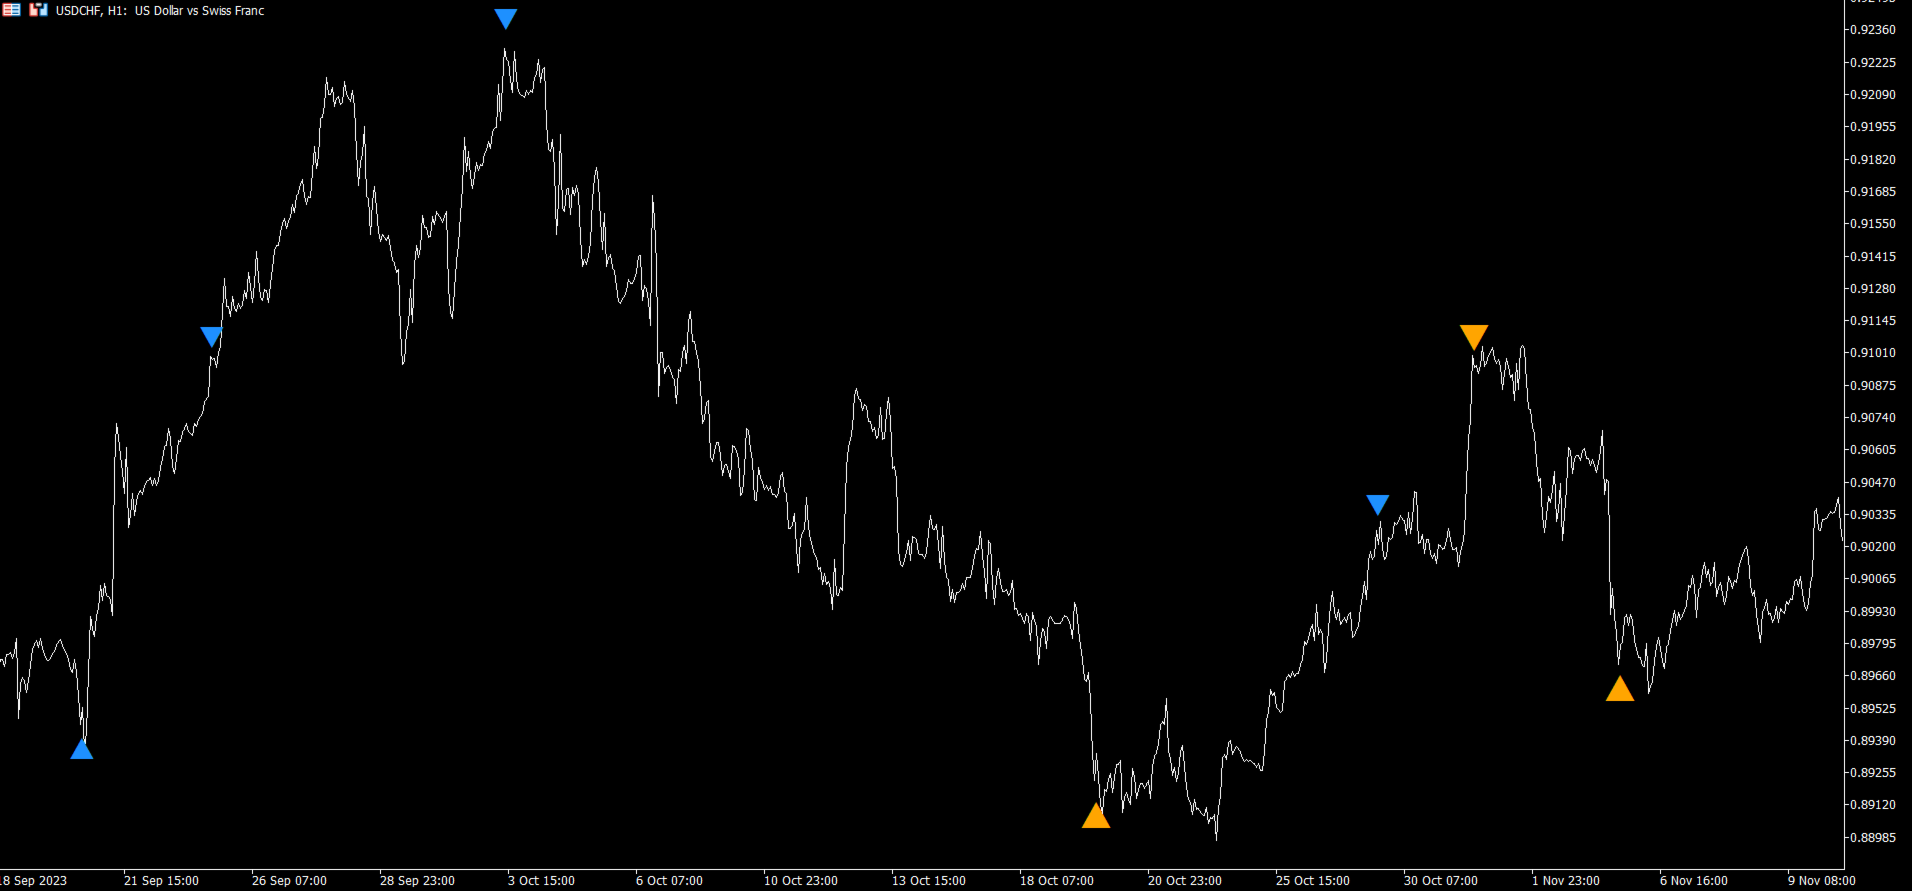
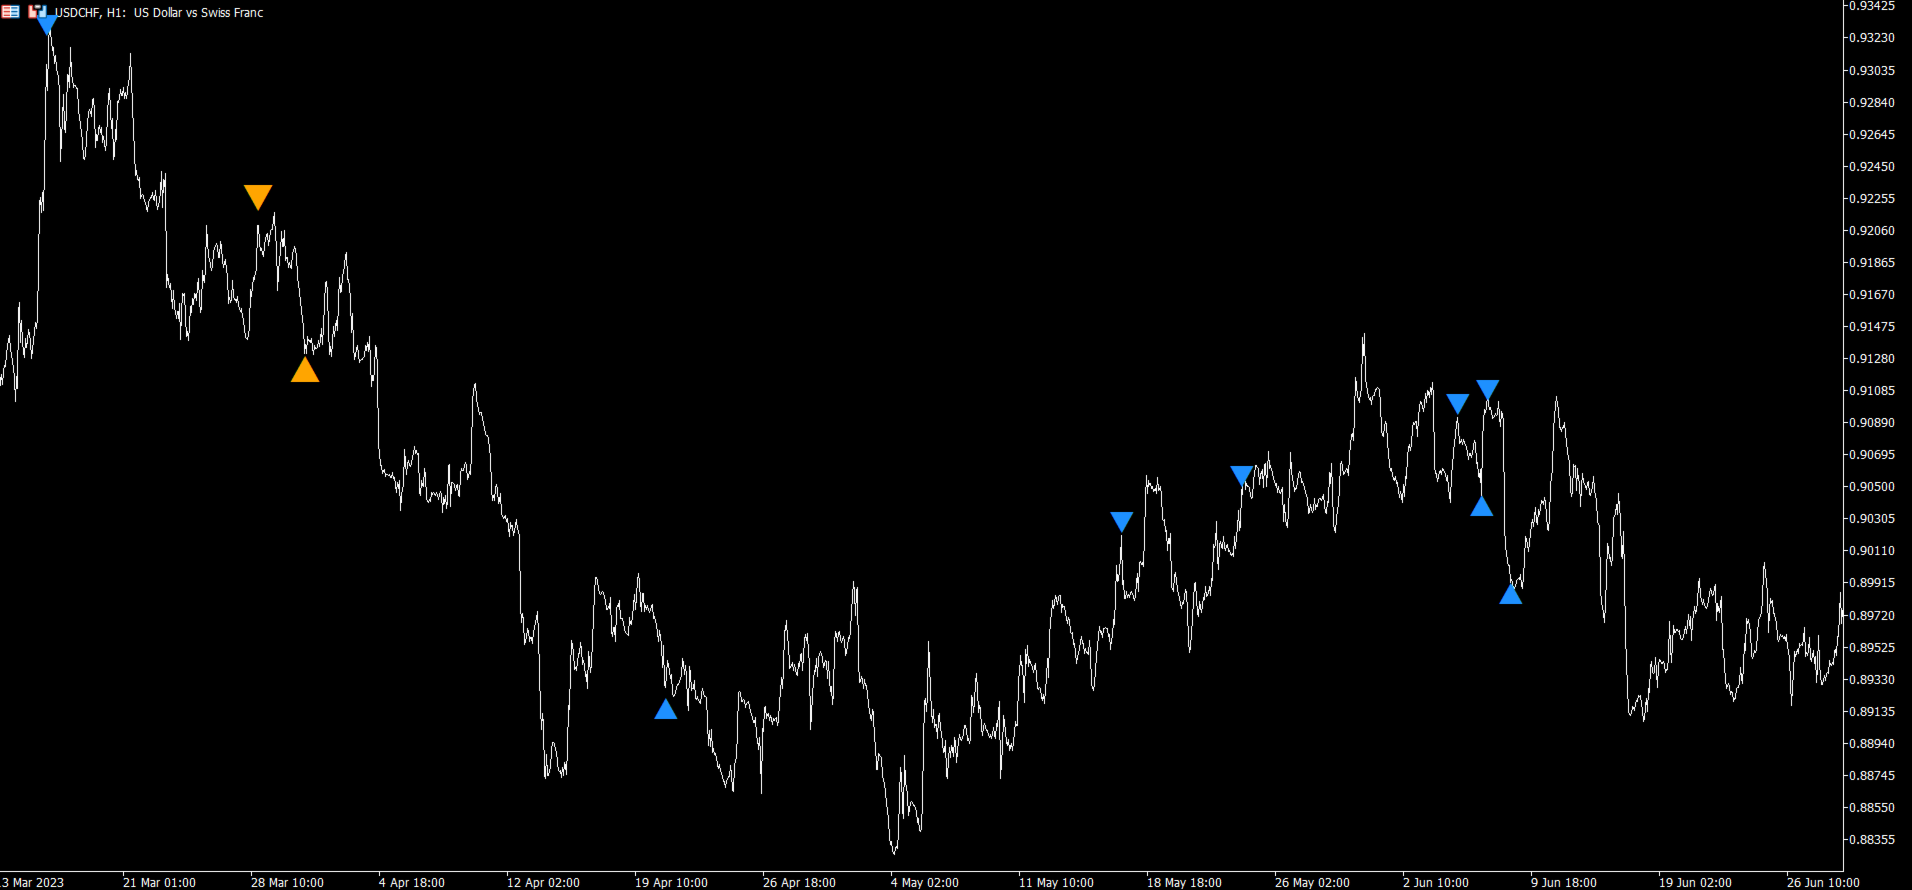
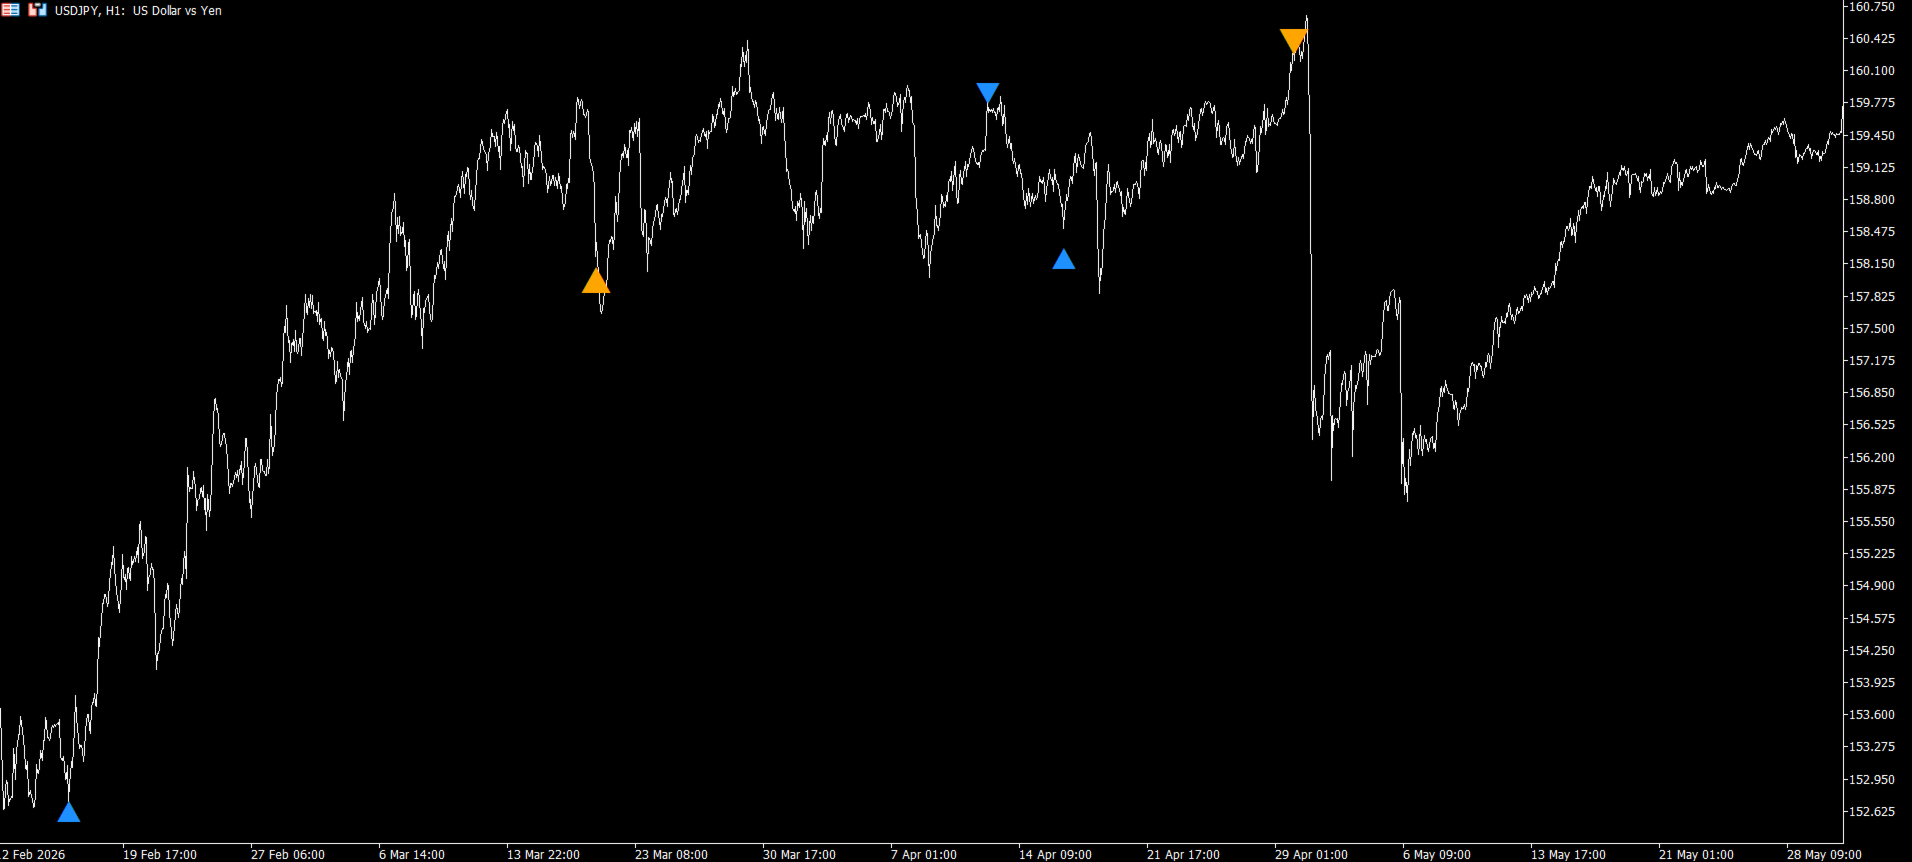
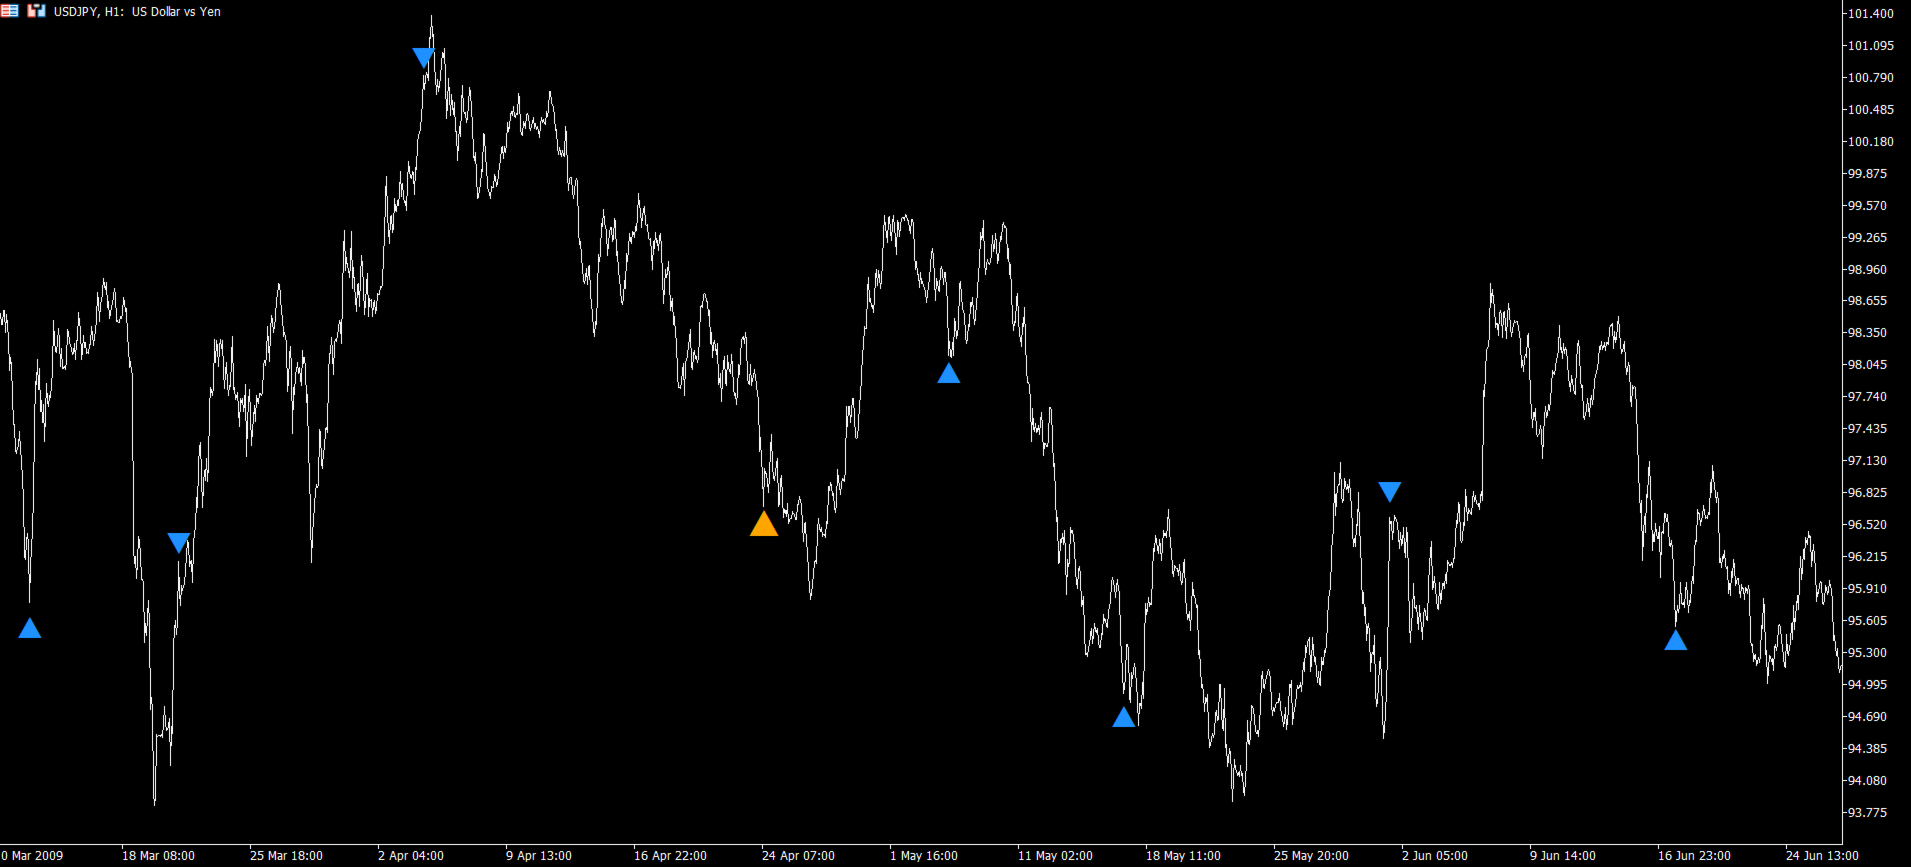
HRP displays simple directional markers:

  • ▲ Bullish signal: conditions are consistent with downside exhaustion and a potential recovery or upward reversal.

  • ▼ Bearish signal: conditions are consistent with upside exhaustion and a potential decline or downward reversal.

The indicator is designed around completed market data only. Signals do not rely on future bars and are intended to remain fixed once the relevant candle has closed.

Normal vs High Conviction

Hyper Reversal Pattern separates signals into two confidence levels.

Normal

Normal signals represent a strong reversal setup where several components of the HRP framework are aligned.

They are the more frequent signal type and are useful for traders who want broader coverage of potential reversal opportunities.

Normal signals can be particularly useful for:

  • identifying emerging reversal zones;

  • timing entries after extended directional moves;

  • complementing support and resistance analysis;

  • adding a reversal layer to discretionary trading;

  • screening markets for potential mean-reversion opportunities.

A Normal signal should be interpreted as:

“A meaningful reversal setup is present.”

High Conviction — HC

High Conviction signals occur when the full HRP framework reaches its strongest level of agreement.

These signals are deliberately more selective and therefore generally occur less frequently than Normal signals.

HC signals are designed for situations where the trader prefers quality and selectivity over signal frequency.

A High Conviction signal should be interpreted as:

“The reversal setup shows the strongest level of internal confirmation available within HRP.”

HC does not mean that a reversal is guaranteed. It represents a stricter version of the same underlying pattern.

How to Use Hyper Reversal Pattern

HRP is best used as a timing and confirmation tool, rather than as a mechanical instruction to immediately buy or sell every signal.

Reversal Trading

After an extended decline, a bullish HRP signal can be used to identify a potential area where selling pressure may be becoming exhausted.

After an extended advance, a bearish HRP signal can highlight an area where buying pressure may be losing strength.

Traders can then combine the signal with their preferred entry technique, such as:

  • price-action confirmation;

  • support or resistance;

  • market structure;

  • trend-line breaks;

  • moving-average recovery;

  • volatility filters;

  • volume analysis.

Entry Confirmation

A useful approach is to treat HRP as the setup and let price action provide the entry.

For example, following a bullish signal, a trader may wait for price to recover above a short-term moving average, break a nearby swing high, or produce additional bullish confirmation.

The bearish case is simply reversed.

This can help avoid treating every reversal signal as an attempt to catch the exact top or bottom.

Position Management

HRP does not force a particular exit methodology.

Depending on the trading style, positions may be managed using:

  • moving-average exits;

  • ATR-based targets;

  • previous swing levels;

  • trailing stops;

  • fixed risk/reward levels;

  • partial profit-taking;

  • an opposite HRP signal.

This makes the pattern adaptable to intraday, swing, and systematic workflows.

Normal and HC Together

One practical way to use both signal classes is:

Normal = opportunity detection
HC = higher-selectivity opportunity detection

A trader seeking more activity may use both Normal and HC signals.

A trader who prefers fewer setups may focus only on HC.

Another approach is to use Normal signals for standard position sizing while reserving larger conviction or additional confirmation for HC setups, subject to the trader's own risk-management framework.

Multi-Timeframe Use

Hyper Reversal Pattern can also be used across multiple timeframes.

For example:

  • a higher-timeframe HRP signal can define the potential reversal environment;

  • a lower timeframe can then be used to refine the entry;

  • agreement between timeframes can provide additional context.

The indicator can therefore function either as a standalone chart overlay or as one component of a broader trading framework.

What HRP Is Designed to Do

Hyper Reversal Pattern is designed to answer one practical question:

“Is the current directional move showing enough evidence of exhaustion and reversal behavior to deserve attention?”

It does not attempt to predict every market top or bottom.

Instead, HRP filters the market for situations where reversal characteristics become unusually compelling and presents those situations through a simple, visually intuitive signal system.

Normal signals identify qualified reversal setups.

High Conviction signals identify the most strongly confirmed subset of those setups.
作者的更多信息
The Time Above Equilibrium Pattern identifies potential exhaustion points by measuring how long price remains above or below a dynamic equilibrium level. Creator:  https://www.quant-atlas.com/ The equilibrium line acts as a smoothed reference point for market balance. When price spends an extended period above this line, the indicator tracks the duration of that move and monitors whether upward support is beginning to weaken. A bearish exhaustion signal may appear when price has remained above e
FREE
Orange Indicator by Quant Atlas Creator:  https://www.quant-atlas.com/ Orange Indicator is a clean reversal focused indicator for MetaTrader 5, designed to highlight potential turning points directly on the chart using simple orange buy and sell markers. The indicator focuses on moments where price may be transitioning out of short term exhaustion and into a possible reaction phase. When a bullish setup appears, an orange upward triangle is displayed below the candle. When a bearish setup appear
FREE
Yellow Indicator by Quant Atlas Creator:  https://www.quant-atlas.com/ Yellow Indicator is a clean reversal focused trading tool designed to highlight potential turning points using momentum behavior and RSI structure. The indicator looks for moments where momentum has moved through an important zone and begins to show signs of exhaustion. When conditions align, it plots dark yellow triangle signals directly on the chart. Both bullish and bearish signals use the same dark yellow visual identity,
FREE
Fibonacci Timing Indicator by Quant Atlas Creator:  https://www.quant-atlas.com/ Fibonacci Timing Indicator is a clean signal based trading tool designed to identify potential turning points through a timing sequence framework inspired by Fibonacci spacing. The indicator studies price behavior across selected historical reference points and looks for repeated directional pressure. When the sequence reaches completion, it plots a clear signal directly on the chart. Signal Display • Green upward t
FREE
K's Synapse is a market structure indicator designed to provide a clear visual reading of bullish pressure, bearish pressure, and uncertainty directly on the price chart. Creator:  https://www.quant-atlas.com/ The indicator evaluates recent price structure across multiple reference points and converts the results into colored dots, rolling market surety percentages, and high intensity triangle signals. Dot Structure • Blue dots represent bullish price structure • Red dots represent bearish price
FREE
Red Indicator  by Quant Atlas Creator:  https://www.quant-atlas.com/ Red Indicator is a clean reversal focused tool designed to highlight moments where price may be moving away from an extreme condition and entering a potential turning zone. The indicator uses a price derived volatility framework to detect areas where market pressure may have become stretched. When conditions align, it plots red triangle signals directly on the chart. Both bullish and bearish signals use the same red visual iden
FREE
Green Indicator by Quant Atlas Creator:  https://www.quant-atlas.com/ Green Indicator is a clean reversal focused trading tool designed to highlight potential turning points using momentum pressure and directional slope behavior. The indicator studies the relationship between momentum position and momentum direction. When market pressure reaches an extended condition and begins to shift, the indicator plots green triangle signals directly on the chart. Both bullish and bearish signals use the sa
FREE
Blue Indicator by Quant Atlas Creator:  https://www.quant-atlas.com/ Blue Indicator is a clean reversal focused trading tool designed to detect potential turning points through a slope based momentum framework. The indicator studies the momentum of price slope and highlights moments where that momentum begins to move away from an extreme zone. When conditions align, it plots blue triangle signals directly on the chart. Both bullish and bearish signals use the same blue visual identity, giving th
FREE
Creator:  https://www.quant-atlas.com/ Freyja is a visual pattern based indicator designed to highlight potential exhaustion and reversal areas using a structured time and price framework. The indicator studies how price behaves across repeated timing sequences and marks areas where the market may be approaching a potential turning point. It is built to give traders a clean visual layer that can be added to their existing analysis process. Signal Categories • Blue triangles Low conviction patte
FREE
Violet Indicator  by Quant Atlas Creator:  https://www.quant-atlas.com/ Violet Indicator is a clean reversal focused trading tool designed to identify moments where price may be shifting away from an extended directional condition. The indicator uses a price derived trend framework to detect moments where market structure may be changing. When conditions align, it plots violet triangle signals directly on the chart. Both bullish and bearish signals use the same violet visual identity, giving the
FREE
Median is a clean price structure indicator designed to plot the rolling median of recent highs and lows directly on the chart. Creator:  https://www.quant-atlas.com/ The indicator calculates the 50th percentile of recent low prices and high prices over a selected lookback window. This creates two dynamic reference lines that can help traders read the central structure of recent price behavior. Signal Display • Purple line: rolling median of lows • Red line: rolling median of highs These lines
FREE
Indigo Indicator by Quant Atlas Creator:  https://www.quant-atlas.com/ Indigo Indicator is a clean reversal focused trading tool designed to identify potential turning points through a price sequence framework. The indicator studies how price has behaved across multiple prior reference points and highlights moments where that sequence may be shifting. When conditions align, it plots indigo triangle signals directly on the chart. Both bullish and bearish signals use the same indigo visual identit
FREE
SwapGuard
Sofien Kaabar
Swap Guard Pro is a non directional MT5 dashboard designed to help traders understand overnight holding costs before they become a silent drag on performance. The indicator displays long and short swap values, estimated daily holding cost, triple swap day, next rollover timing, current spread, tick value, margin requirement, open exposure, accrued swap, floating PnL, and projected next rollover cost directly on the chart. It is built for traders who hold positions overnight, trade multi asset po
FREE
Trader Cockpit
Sofien Kaabar
Trader’s Cockpit is a simple non directional dashboard for MetaTrader 5 designed to give traders a quick, clear view of their trading environment directly on the chart. Creator:  https://www.quant-atlas.com/ The indicator does not generate buy or sell signals, does not predict market direction, and does not perform any trading action. Its purpose is to make the trader’s daily workflow easier by centralizing useful account, symbol, spread, session, and broker condition information in one compact
FREE
Vision:产品说明 Quant Atlas 的 Vision 是一款多组件反转信号指标,旨在识别流动性市场中的短期看涨和看跌衰竭点。该模型整合了多个独立的技术证据层,包括动量行为、均值回归压力、基于波动率的条件、趋势互动、时机结构,以及与移动平均线相关的确认因素。最终结果会直接转换为图表上的可视化信号强度标记。 该指标主要用于反转分析。它的目标是突出价格可能已经过度延伸、结构上变得脆弱,或正在接近潜在方向转换的区域。Vision 最适合作为决策辅助层,与价格行为、市场结构、蜡烛图行为、支撑与阻力、流动性区域,以及更广泛的趋势背景结合使用。 信号理念 Vision 不会以相同方式处理所有反转条件。每个信号都会根据其背后的证据数量和质量进行分类。 只有当模型的综合评分达到预设的信号强度区域时,信号才会生成。内部组件之间的一致性越强,信号分类的重要性就越高。 该指标使用三个实用的信号强度等级: 蓝色三角形:中等信号强度 蓝色三角形代表中等反转信号强度。 这些信号表示模型已经检测到有意义的看涨或看跌反转条件,但证据还不足以将其归类为高强度信号。 当模型检测到中等看涨反转倾向时,蓝色看涨三角
Reversal Indicator I   by Quant Atlas Creator:  https://www.quant-atlas.com/ Reversal Indicator I is a clean reversal focused indicator designed to help traders identify potential bullish and bearish turning points directly on the chart. The indicator highlights moments where the market may be approaching exhaustion and where a tactical reversal setup may be forming. Signals are displayed with simple visual triangles, making the tool easy to read without cluttering the chart. Key idea Markets of
Three Dimensional Reversal Indicator  by Quant Atlas Creator:  https://www.quant-atlas.com/ Three Dimensional Reversal Indicator is a clean and focused reversal tool designed to identify potential market turning points through a three dimensional view of price behavior. The model combines three key dimensions: • Time How long market pressure has remained one sided. • Price Where price is currently positioned relative to its recent behavior. • Price Derived Structure A transformed view of pric
Fibonacci Moving Average by Quant Atlas Fibonacci Moving Average is a visual trend structure indicator built around a layered Fibonacci based moving average framework. The indicator plots two dynamic average lines directly on the price chart, creating a clean view of how price behaves relative to broader trend structure. The lines automatically change color depending on the position of price, making market direction easier to read at a glance. Visual Logic • Blue line state: price is trading abo
The Rainbow Dragon Indicator by Quant Atlas Creator:  https://www.quant-atlas.com/ The Rainbow Dragon is a composite signal engine that aggregates the seven Rainbow indicators — Blue, Green, Indigo, Red, Violet, Yellow, and Orange — into a single confluence-based reading. Rather than relying on any one model, it treats each Rainbow component as an independent voter and fires only when enough of them agree, giving you a diversified, multi-method read on the market instead of a single point of vie
HorizonsFX Stability is a multi currency Expert Advisor for MetaTrader 5 designed to trade major FX pairs using a structured daily signal model. The system scans several major currency pairs, evaluates directional pressure, volatility behavior, and market structure conditions, then opens trades when the internal score reaches a valid setup. Creator:  https://www.quant-atlas.com/ The product is designed for traders who want a systematic FX robot with clear risk controls, multi pair diversificatio
Yubel Divergence Detection is a momentum exhaustion indicator for MetaTrader 5 designed to help traders identify potential directional turning points when price movement begins to lose internal strength. Creator:  https://www.quant-atlas.com/ The indicator focuses on divergence style behavior and momentum fatigue, highlighting moments where the market may be preparing for a reversal, continuation failure, or short term directional shift. It is built as a visual signal tool, giving traders a fast
Dynamic RSI Volatility Based Creator:  https://www.quant-atlas.com/ Dynamic RSI Volatility Based is an adaptive momentum indicator designed to adjust its RSI sensitivity according to changing market volatility. Instead of relying on one fixed RSI period at all times, the indicator adapts its internal lookback based on recent volatility conditions. When volatility changes, the RSI calculation becomes more responsive or smoother depending on the current market environment. This gives traders a mor
Euro Pulse is a MetaTrader 5 Expert Advisor designed specifically for EURUSD trading. The system focuses on short holding periods, controlled exposure, and structured trade selection instead of aggressive recovery methods or high risk position scaling. Creator:  https://www.quant-atlas.com/ The Expert Advisor is built for traders who want a focused EURUSD robot with simple risk behavior, clear execution logic, and a clean trading profile. It does not use martingale, grid trading, averaging down,
筛选:
无评论
回复评论