
SFX Multi Trend Dashboard
- 指标
- 版本: 1.30
- 更新: 29 七月 2026
- 激活: 5

IMPORTANT NOTE: This indicator is designed exclusively for advanced traders who already possess sufficient experience and a deep understanding of standard technical indicators (such as Bollinger Bands, MACD, Ichimoku, etc.). This tool will not teach you how to trade; rather, it is a highly advanced confluence matrix built so that experienced traders can configure their own custom indicator alerts, track market conditions at a glance, and optimize their existing trading systems.
MQL5 Channel - For daily market insights, tips, & updates: Join here.
Disclaimer:
- Read the full product description before purchasing.
- Due to regulatory and compliance restrictions, our service, including personalized technical support and one-on-one troubleshooting, is unavailable in India, Pakistan, and Bangladesh. Products purchased from these regions are ineligible for these services after purchase. For setup, operation, and troubleshooting guidance, please refer to the user manual.
- Intraquotes products are sold exclusively on MQL5. We never contact users privately, sell off-platform, or provide personal trading advice.
Usage Notes:
The indicator supports one dashboard per MetaTrader terminal and displays trend data for up to 20 symbols, with 10 symbols per page.
A built-in pagination system lets you quickly navigate between all monitored symbols from a single dashboard. This keeps the interface compact and organized while eliminating the need to run multiple dashboard instances.
Overview
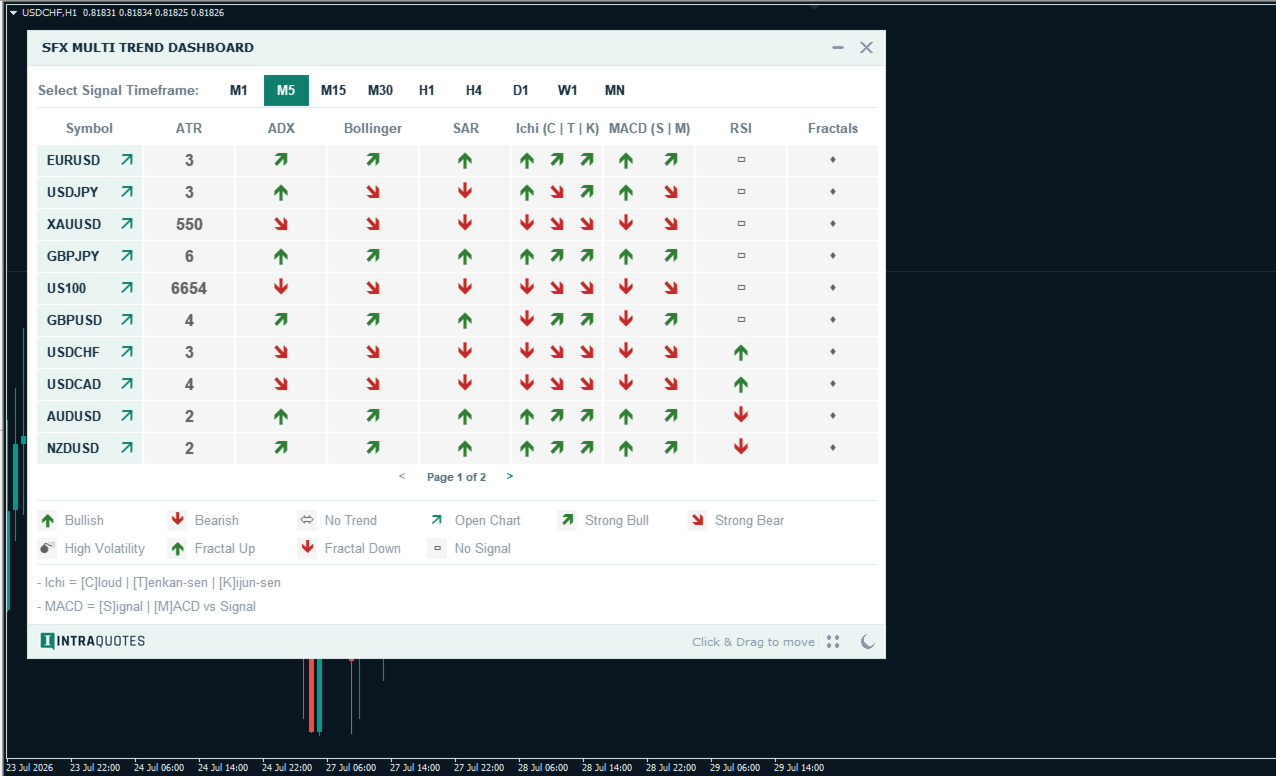
The SFX Multi Trend Dashboard is a state-of-the-art, multi-symbol, multi-indicator panel that allows you to monitor up to 12 different technical indicators across various timeframes and instruments, all from a single chart. Whether you are looking for trend alignment, momentum shifts, volatility breakouts, or divergence, this dashboard aggregates the data into a clean, modern, and highly responsive graphical interface.
Key Features
- 12 Dynamic Slots: Choose from 17 built-in technical indicators to display on the dashboard. The panel automatically resizes its width depending on how many indicators you activate.
- One-Click Timeframe Tabs: Instantly switch the dashboard's data calculation timeframe using the sleek, horizontal timeframe tabs (M1 through MN) located at the top of the panel.
- Smart Dynamic Legend: No more guessing what symbols mean. The legend at the bottom of the dashboard automatically updates to explain the icons for the specific indicators you have selected (e.g., displaying the complex Ichimoku cloud breakdown only if Ichimoku is active).
- Click-to-Chart: Click on any symbol row inside the dashboard, and your active chart will instantly switch to that instrument.
- Dark & Light Modes: Seamlessly toggle between premium Dark and Light themes via the sun/moon icon to match your charting environment.
User Inputs & How to Use Them
1. Dashboard Position
- Adjust X & Y Axis numeric values to move the dashboard left/right or up/down on your chart.
2. Indicator Selection (Up to 12)
- Use the dropdowns to assign an indicator to each column. You can choose from ATR, ADX, Alligator, BBands, SAR, Ichimoku, MACD, RSI, Momentum, Stochastics, Envelopes, Breakouts, Fractals, MA Cross, CCI, RSI Divergence, and Spread. If you don't need all 12 columns, simply set the unused slots to "None" and the dashboard will neatly shrink.
3. Symbol Settings
- Symbol Source: Choose whether to automatically pull symbols from your MetaTrader "Market Watch" window, or define a specific list manually.
- Manual Symbols: If "Manual" is selected above, type your desired symbols here, separated by commas (e.g., EURUSD,GBPUSD,XAUUSD). Supports up to 20 symbols.
4. Alert Settings
- Alert 1 & Alert 2: Select specific conditions to trigger alerts (e.g., "MACD Signal Bullish" or "Price Above Alligator"). If you only want one condition, set Alert 1 and leave Alert 2 as "None". If you want a combined signal (confluence), set both Alert 1 and Alert 2. The dashboard will only alert you when both conditions are met simultaneously.
- Email / Push: Enable these to receive notifications directly to your phone or inbox.
- Alert Timeframe: Select the specific timeframe the dashboard should monitor for these alerts.
5. Indicator Parameters
- Scroll through this extensive section to fine-tune the mathematical inputs (Periods, Shifts, Applied Prices, Deviations) for every single indicator on the dashboard. Your custom settings here dictate the signals shown on the panel.
Complete List of Available Alert Conditions
The SFX Multi Trend Dashboard features a powerful dual-alert engine. You can select a Primary Alert (Alert 1) and a Secondary Alert (Alert 2) simultaneously to trigger notifications only when both custom conditions align (Confluence Alert).
Alligator Alerts
Price Below AlligatorPrice Above Alligator
Price Inside Alligator
Bollinger Bands Alerts
Bollinger Bands Bullish BreakoutBollinger Bands Bearish Breakout
Price Bullish (Above Main Band)
Price Bearish (Below Main Band)
Parabolic SAR Alerts
Parabolic SAR BullishParabolic SAR Bearish
Ichimoku Kinko Hyo Alerts
Price Above CloudPrice Below Cloud
Price Inside Cloud
Price Above Tenkan-Sen
Price Below Tenkan-Sen
Price Equal to Tenkan-Sen
Price Above Kijun-Sen
Price Below Kijun-Sen
Price Equal to Kijun-Sen
MACD Alerts
MACD Signal Line Bullish (> 0)MACD Signal Line Bearish (< 0)
MACD Main Line Above Signal Line
MACD Main Line Below Signal Line
MACD Main Line Equal to Signal Line
RSI & Divergence Alerts
RSI Overbought (>= 70)RSI Oversold (<= 30)
RSI Classic Bullish Divergence
RSI Classic Bearish Divergence
RSI Hidden Bullish Divergence
RSI Hidden Bearish Divergence
Moving Average Cross & Price Breakout Alerts
Moving Average Bullish Cross (Fast MA > Slow MA)Moving Average Bearish Cross (Fast MA < Slow MA)
Breaking Bar High (Breakout above selected timeframe High)
Breaking Bar Low (Breakout below selected timeframe Low)
ADX Trend Strength Alerts
ADX BullishADX Bearish
ADX Strong Bullish (Main Line >= 70)
ADX Strong Bearish (Main Line >= 70)
Stochastic & Momentum Alerts
Stochastic Overbought (>= 80)Stochastic Oversold (<= 20)
Momentum Price Changes Above 100%
Momentum Price Changes Below 100%
Envelopes Alerts
Price Above Upper Envelope BandPrice Below Lower Envelope Band
Price Inside Envelope Bands
Fractals & CCI Alerts
Fractal Up FormedFractal Down Formed
CCI greater than 100 (Bullish Momentum)
CCI lesser than 0 (Bearish Momentum)
CCI Between 0 and 100 (Neutral Range)
Frequently Asked Questions (FAQ)
Q: Can I open multiple dashboards on the same MetaTrader terminal?
A: No. To ensure maximum terminal performance and eliminate visual clutter, the system is strictly limited to 1 dashboard per MT4 terminal. We designed the 12 dynamic indicator slots and the 20-symbol pagination system specifically so you will never need more than one dashboard.
Q: How do I change the timeframe of the dashboard signals?
A: Simply click the horizontal timeframe tabs (M1, M5, H1, etc.) located at the top of the dashboard inside the chart. Your selection is automatically saved, so if you switch charts, the dashboard will remember your last viewed timeframe.
Q: The dashboard is taking up too much space on my screen. Can I make it smaller?
A: Yes! The dashboard is completely dynamic. If you have all 12 indicator slots filled, it will be wide. To make it smaller, go into the indicator inputs and change the slots you aren't actively using to "None" (X18). The dashboard will automatically shrink its width.
Q: Why are there letters like (C , T , K) next to Ichimoku?
A: Complex indicators are split into segmented cells to give you detailed data. For Ichimoku, the cell is split into three arrows: [C]loud, [T]enkan-sen, and [K]ijun-sen. Check the dynamic legend at the bottom of the dashboard for a full breakdown of what each segment means.
Q: How do I switch my chart to the pair I see on the dashboard?
A: Click anywhere on the row of the symbol you wish to view. The dashboard will instantly change your current active chart to that symbol while maintaining your chosen timeframe.




































































用户没有留下任何评级信息