Volatility Master

4.33
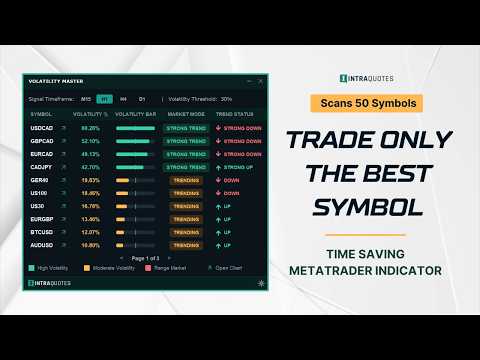
Volatility Master for MetaTrader is a real-time dashboard tool that scans up to 50 symbols to identify high-volatility, trending markets instantly. With bullish/bearish signals, customizable alerts, and a user-friendly interface, it helps you avoid range-bound conditions and focus on high-probability trades. Clarity leads to confidence. Trade confidently and protect your capital effectively with this powerful dashboard.

Quick Links:

User Manual & Guide: Here
MT5 Version: Here
MQL5 Channel - For daily market insights & updates: Join Here

    Disclaimer:

    • Read the full product description before purchasing.
    • Due to regulatory and compliance restrictions, our service, including personalized technical support and one-on-one troubleshooting, is unavailable in India, Pakistan, and Bangladesh. Products purchased from these regions are ineligible for these services after purchase. For setup, operation, and troubleshooting guidance, please refer to the user manual.
    • Intraquotes products are sold exclusively on MQL5. We never contact users privately, sell off-platform, or provide personal trading advice.

    1. How does Volatility Master help?

    Volatility Master eliminates chart clutter by consolidating high-volatility market data into a single, actionable interface. Designed to save time, it helps you filter out flat markets and focus exclusively on high-probability setups.


    • Indicator works best for scalpers, day traders, and swing traders, as it displays volatility of M15, H1, H4 and D1.
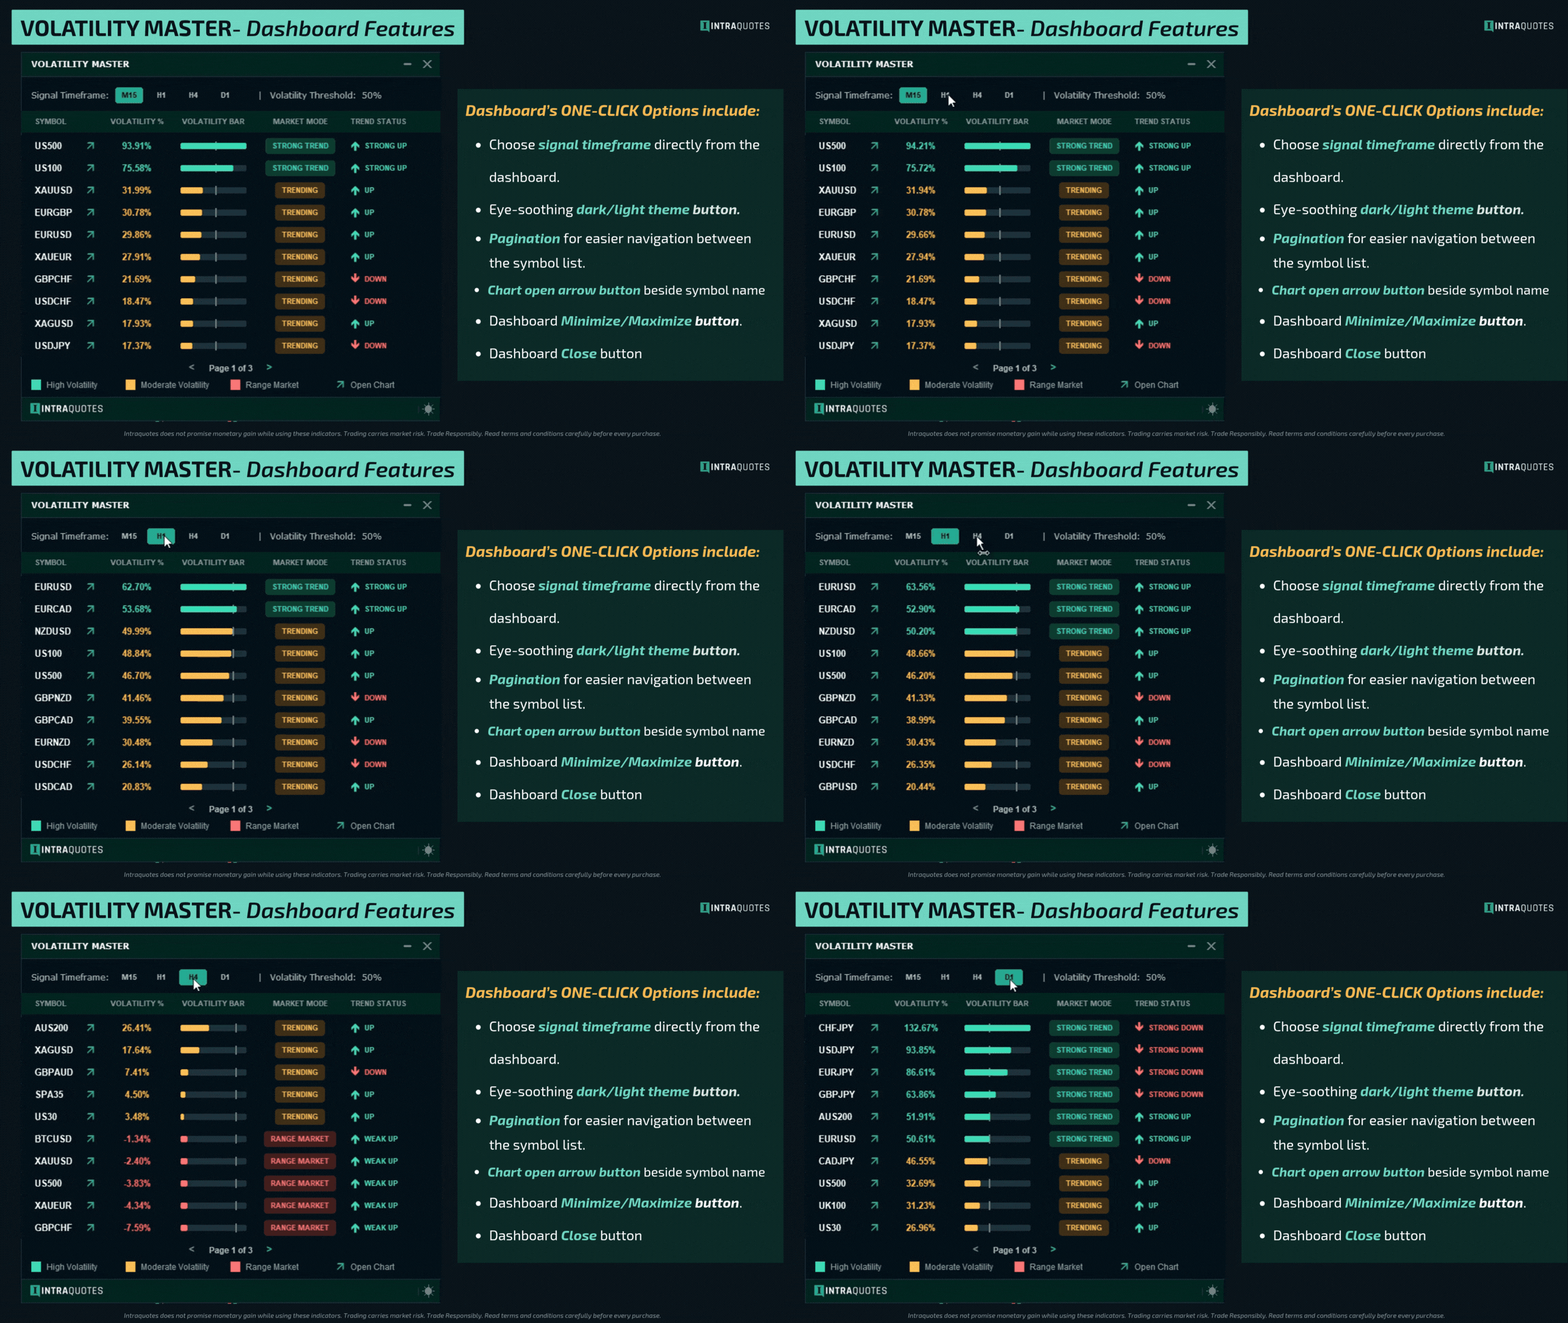
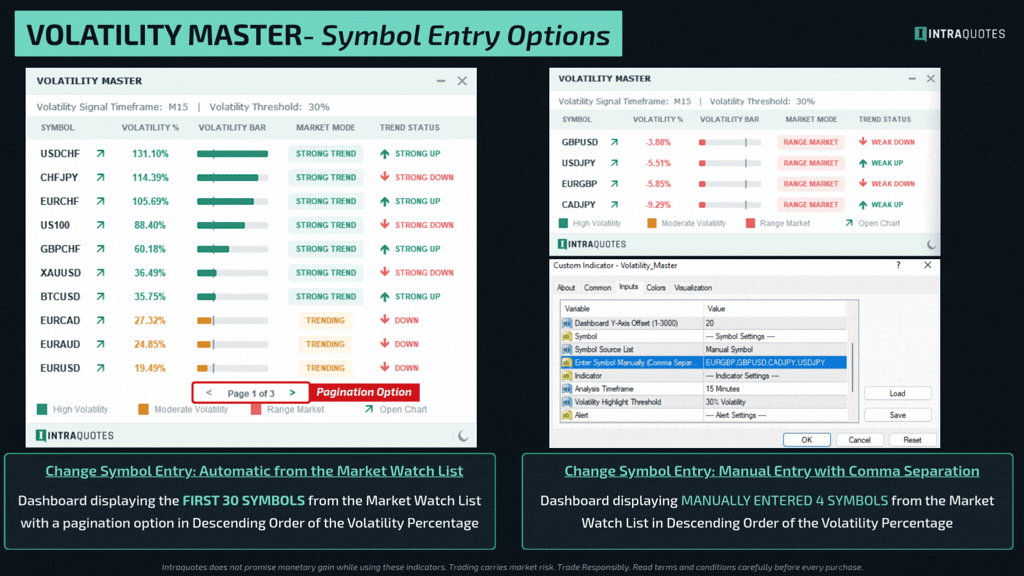
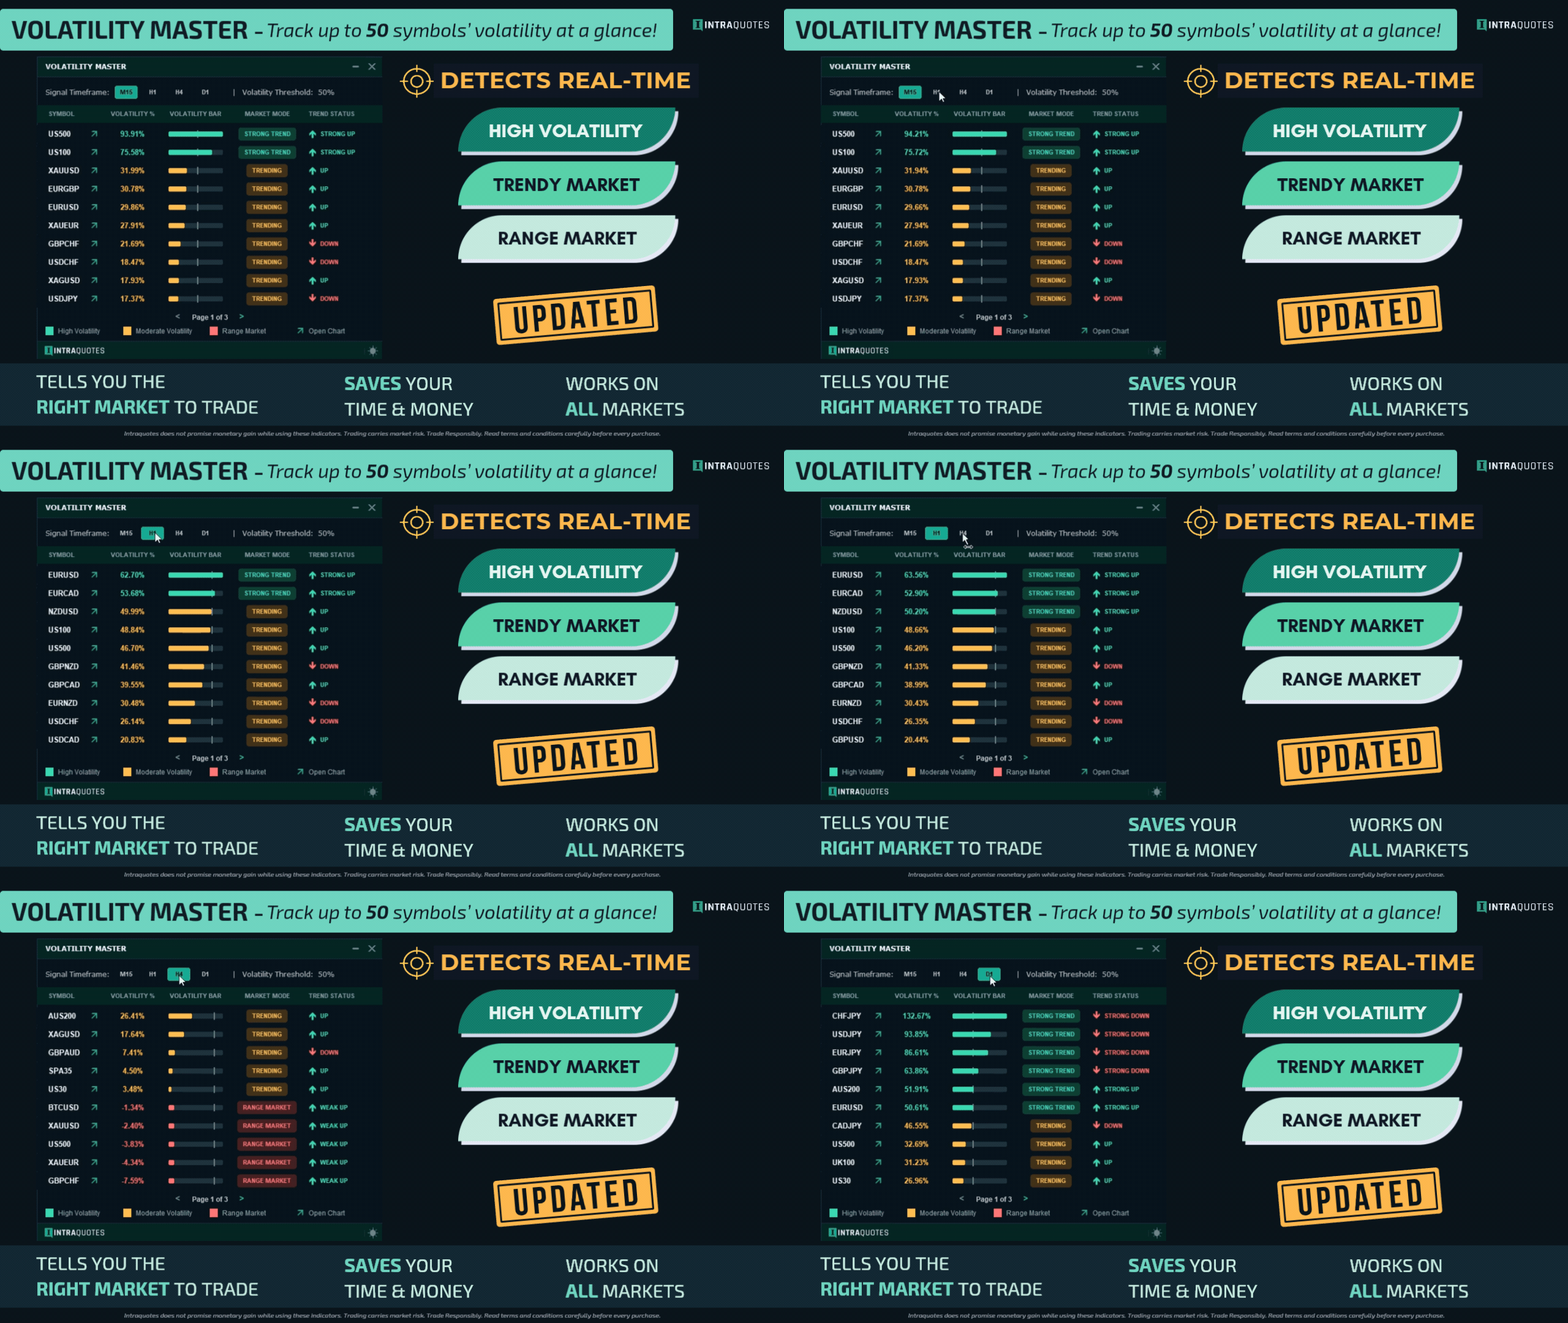
    • At-a-Glance Dashboard: Monitors up to 50 assets simultaneously with multi-page navigation (10 symbols per page).
    • Multi-Timeframe Analysis: Supports M15, H1, H4, and D1 timeframes for scalpers, intraday, and swing traders.
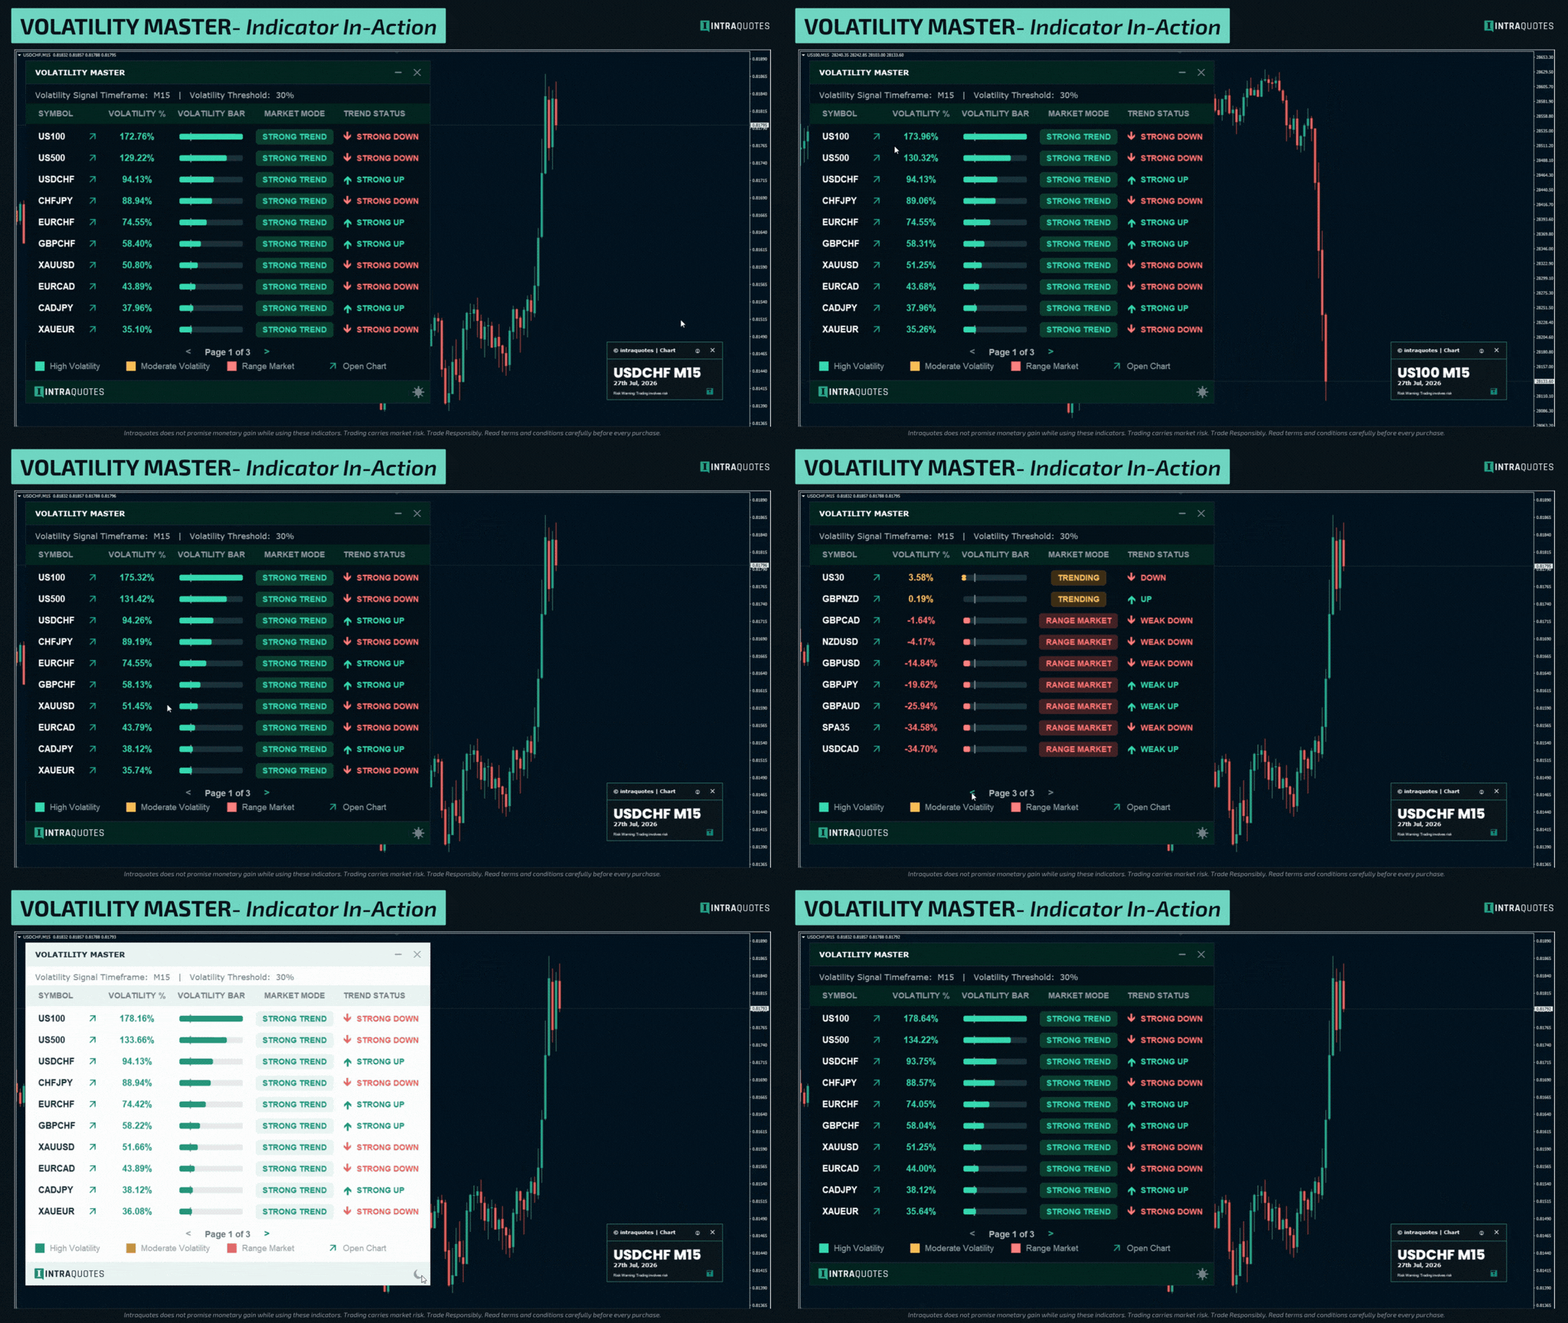
    • Instant Directional Signals: Displays clear real-time Bullish, Bearish, or Ranging states, not just raw volatility metrics.
    • Auto-sorted Volatility Signal: The dashboard automatically sorts the highest volatile pairs from top to bottom.
    • 1-Click Chart Navigation: Click on the arrow beside your desired symbol name to open its chart instantly.
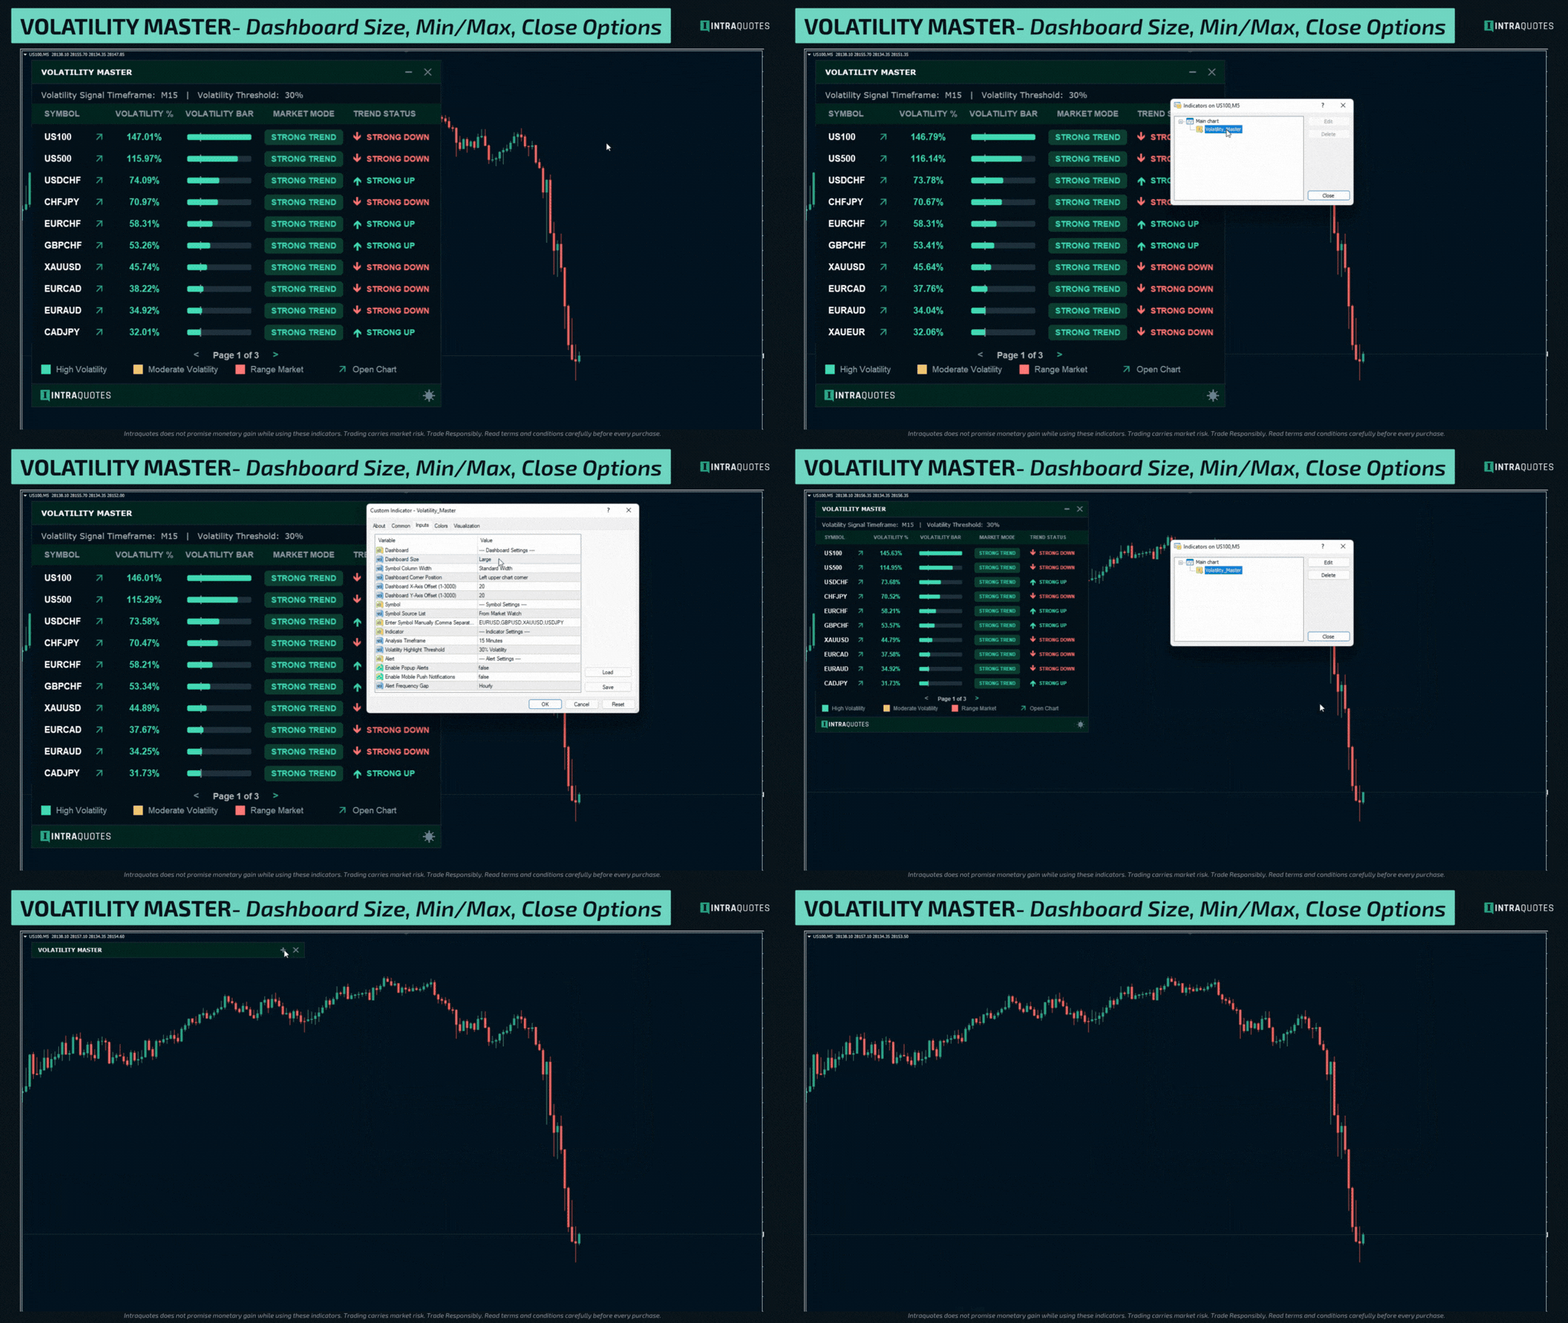
    • Fully Customizable Display: Switch between Light/Dark themes, adjust cell widths, dashboard position across 4 chart corners, and increase dashboard size for a bigger display.
    • Default Timeframe: The default timeframe H1 is loaded when you attach the indicator. (Note: You can instantly change this using the timeframe buttons on the dashboard and it stays the same even if you change the chart or chart timeframe).

      2. Indicator Usage

      • Indicator supports all the symbols, FX, Gold, Crypto and Indices. Compatible with live charts and not offline charts or custom "artificial" symbols created via EAs or scripts.
      • Supports one dashboard per MetaTrader terminal for optimal performance.
      • For optimal performance, attach the dashboard to a separate, dedicated chart (not the active chart where you execute trades)
      • Indicator operates only on standard MetaTrader 4 / MetaTrader 5 platforms. Third-party or modified environments are not supported.
      • Does not provide Data Window values or buffers for EA integration.

      3. Indicator Installation and Alert

      Installation: Go to MT4/MT5 Terminal —> Toolbox —> Market —> Purchased —> Click Install. Drag the indicator from the Navigator window onto a fresh blank chart.

      Mobile Alerts: In MT4/MT5, press Ctrl + O —> Open Notifications tab —> Enter your MetaQuotes ID from your mobile app —> Test connection.

      4. Indicator Settings

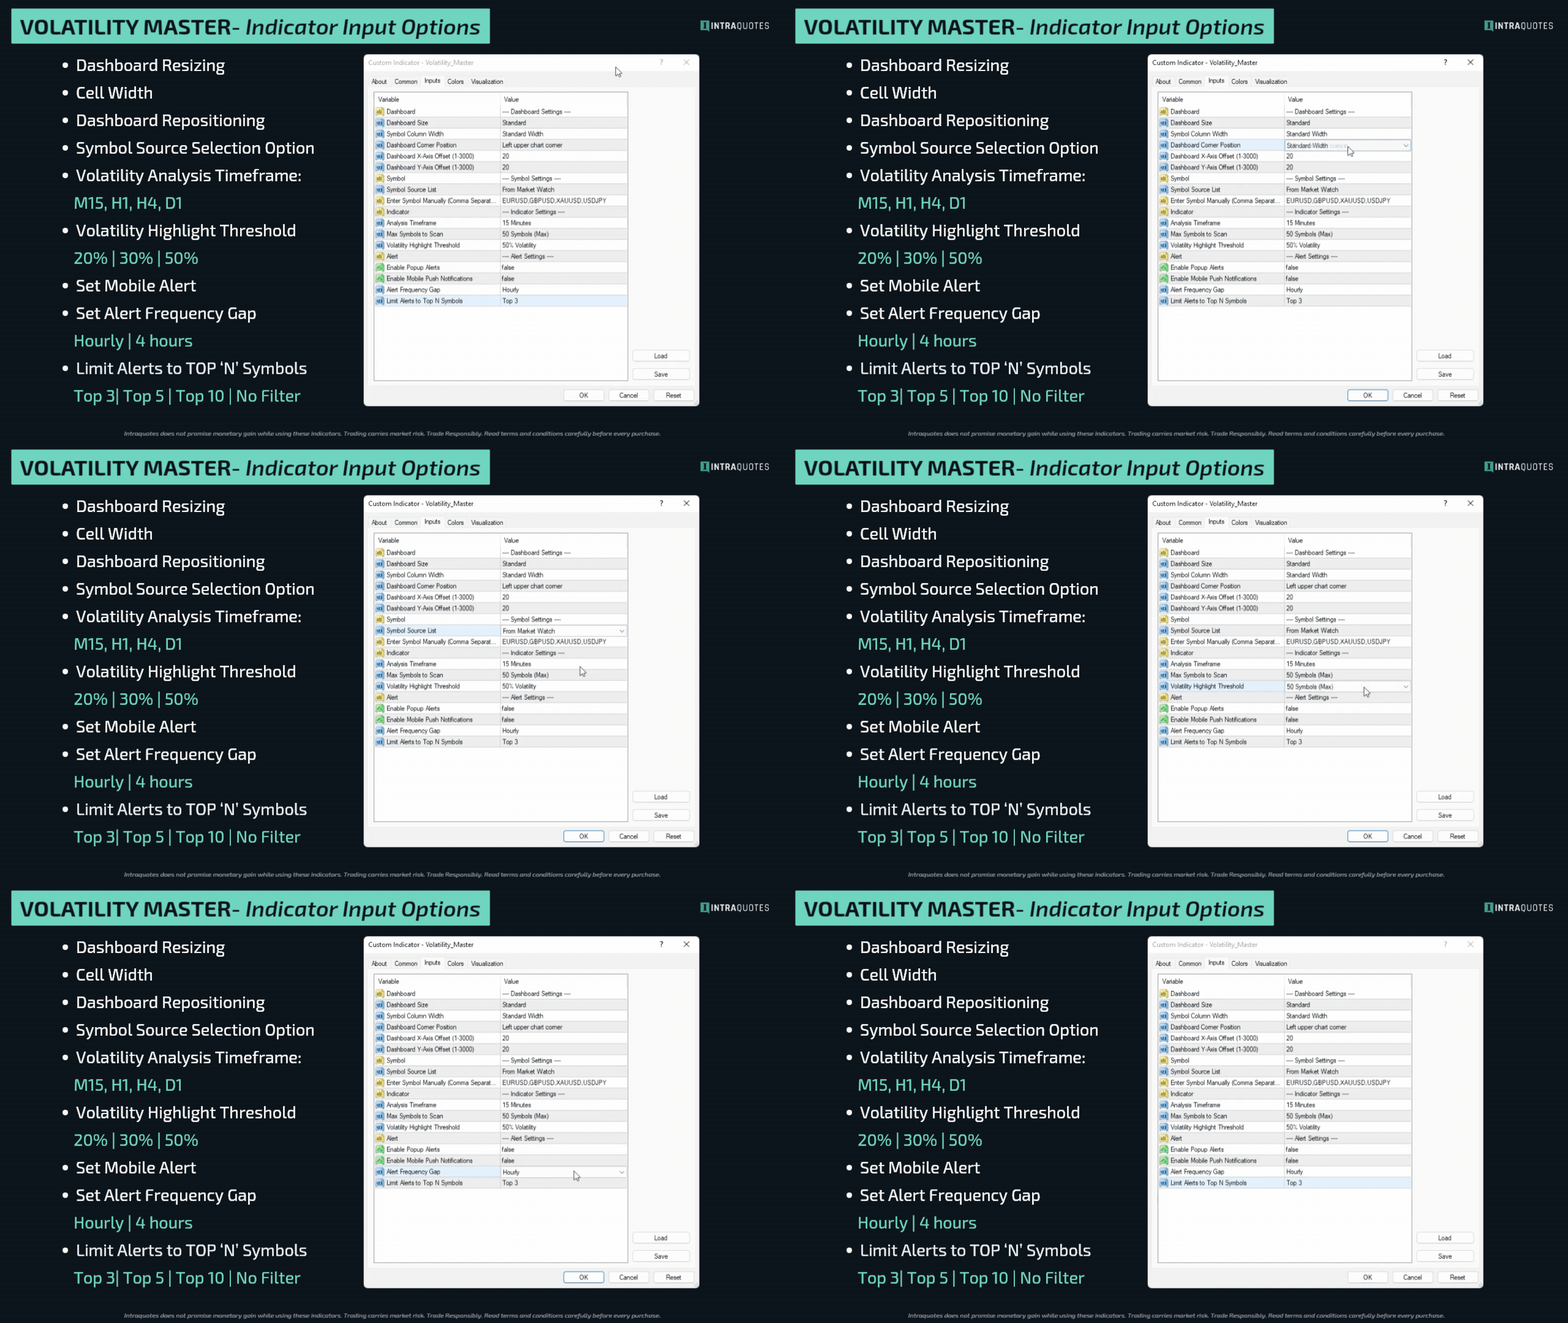
      Dashboard Size: Choose between Standard or Large to fit your screen resolution.
      Symbol Column Width: Select Wide if you trade Crypto or Indices with long names (e.g., Volatility 75 Index, High frequency Vol 25 Index) to prevent text clipping.
      Dashboard Corner & X/Y: Choose which corner the dashboard attaches to and easily adjust its exact position using the X and Y offsets.
      Symbol Source: Choose Market Watch to auto-load your active pairs, or manually type exactly what you want to scan. (Product Manual includes a tip on how to save symbol sets to make it easier for you)
      Manual Symbol: If "Manual" is selected under symbol source option, type your pairs here separated by commas (e.g., EURUSD,GBPUSD,BTCUSD).
      Default Timeframe: The default timeframe loaded when you attach the indicator. (Note: You can instantly change this using the timeframe buttons on the dashboard).
      Max Symbols to Scan: Set the absolute limit of symbols (30 or 50) the dashboard will scan and display.
      Volatility Threshold: Set your desired volatility percentage (20%, 30%, or 50%), which will be displayed in Green as High Volatility.
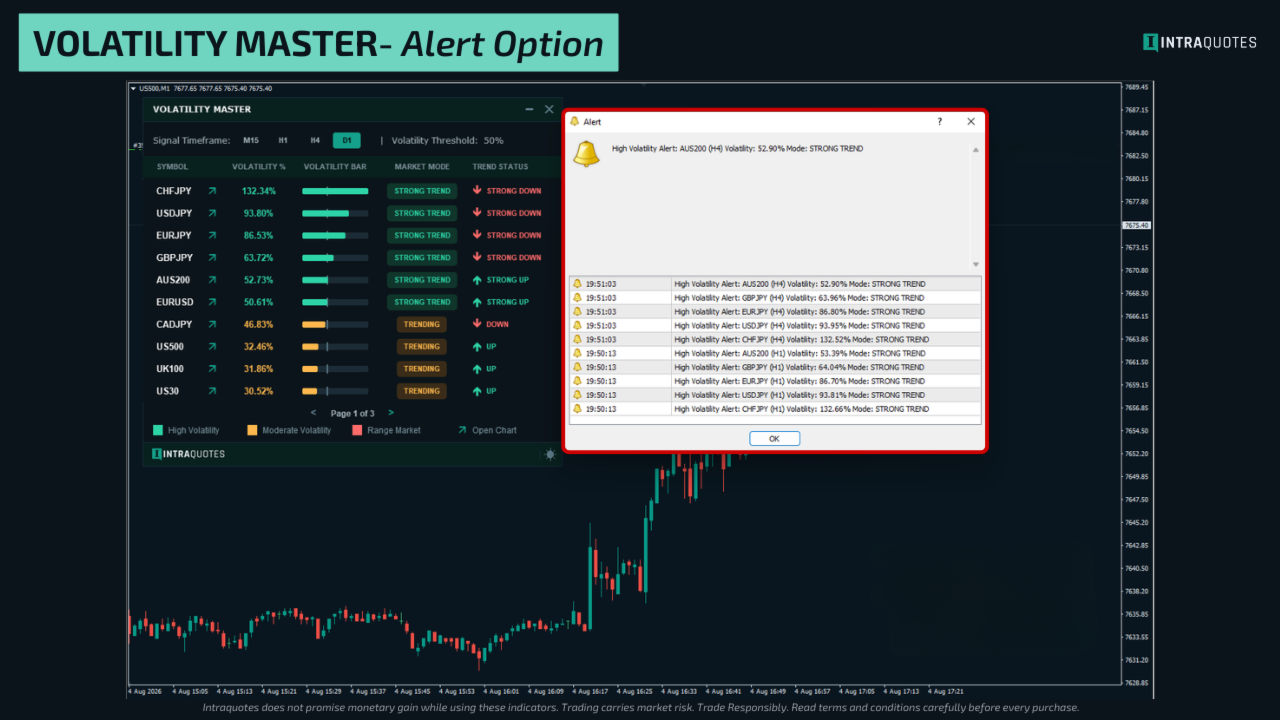
      Popup / Push Alerts: Enable to receive MT4/MT5 desktop popups or mobile push notifications.
      Alert Frequency Gap: Prevents alert spam by pausing notifications for 1 or 4 hours after an alert fires.
      Limit Alerts: NEW smart filter! Instead of getting alerted for every pair that crosses the threshold, you can now choose to receive alerts only for the Top 3, Top 5, or Top 10 most volatile pairs at that moment. You can also set it to ‘No filter’ to get alert of all symbols that cross the threshold.

      Indicator Backtesting:

      Please note that during visual backtesting, MetaTrader is restricted to analysing a single timeframe and symbol. Consequently, you can backtest your selected symbol and timeframe to observe historical volatility data and evaluate the indicator’s performance.

      5. How to use Volatility Master for Trading?

      The Volatility Master is designed to keep you updated with the highest momentum and out of dead markets. The dashboard automatically sorts the best pairs from top to bottom. Strategies to use the Volatility Master have been explained in the User Manual with live charts.
      Below is the shorter version for faster understanding.

      1. Follow the Colour Code
        Green (High Volatility & Strong Trend): These are the best pairs to trade in real-time. They have broken the volatility threshold and are moving fast.
        Yellow (Moderate Volatility): The pair is trending but lacks explosive momentum. Good for slower, pullback-style trading.
        Red (Range Market): The market is dead, flat, or squeezing (consolidating). Do not trade these pairs.

      2. Trade in the Direction of the Trend
        Once you find a Green (High Volatility) pair, look at the Trend Status column.
        If it says STRONG UP, look for BUY setups on your chart.
        If it says STRONG DOWN, look for SELL setups on your chart.
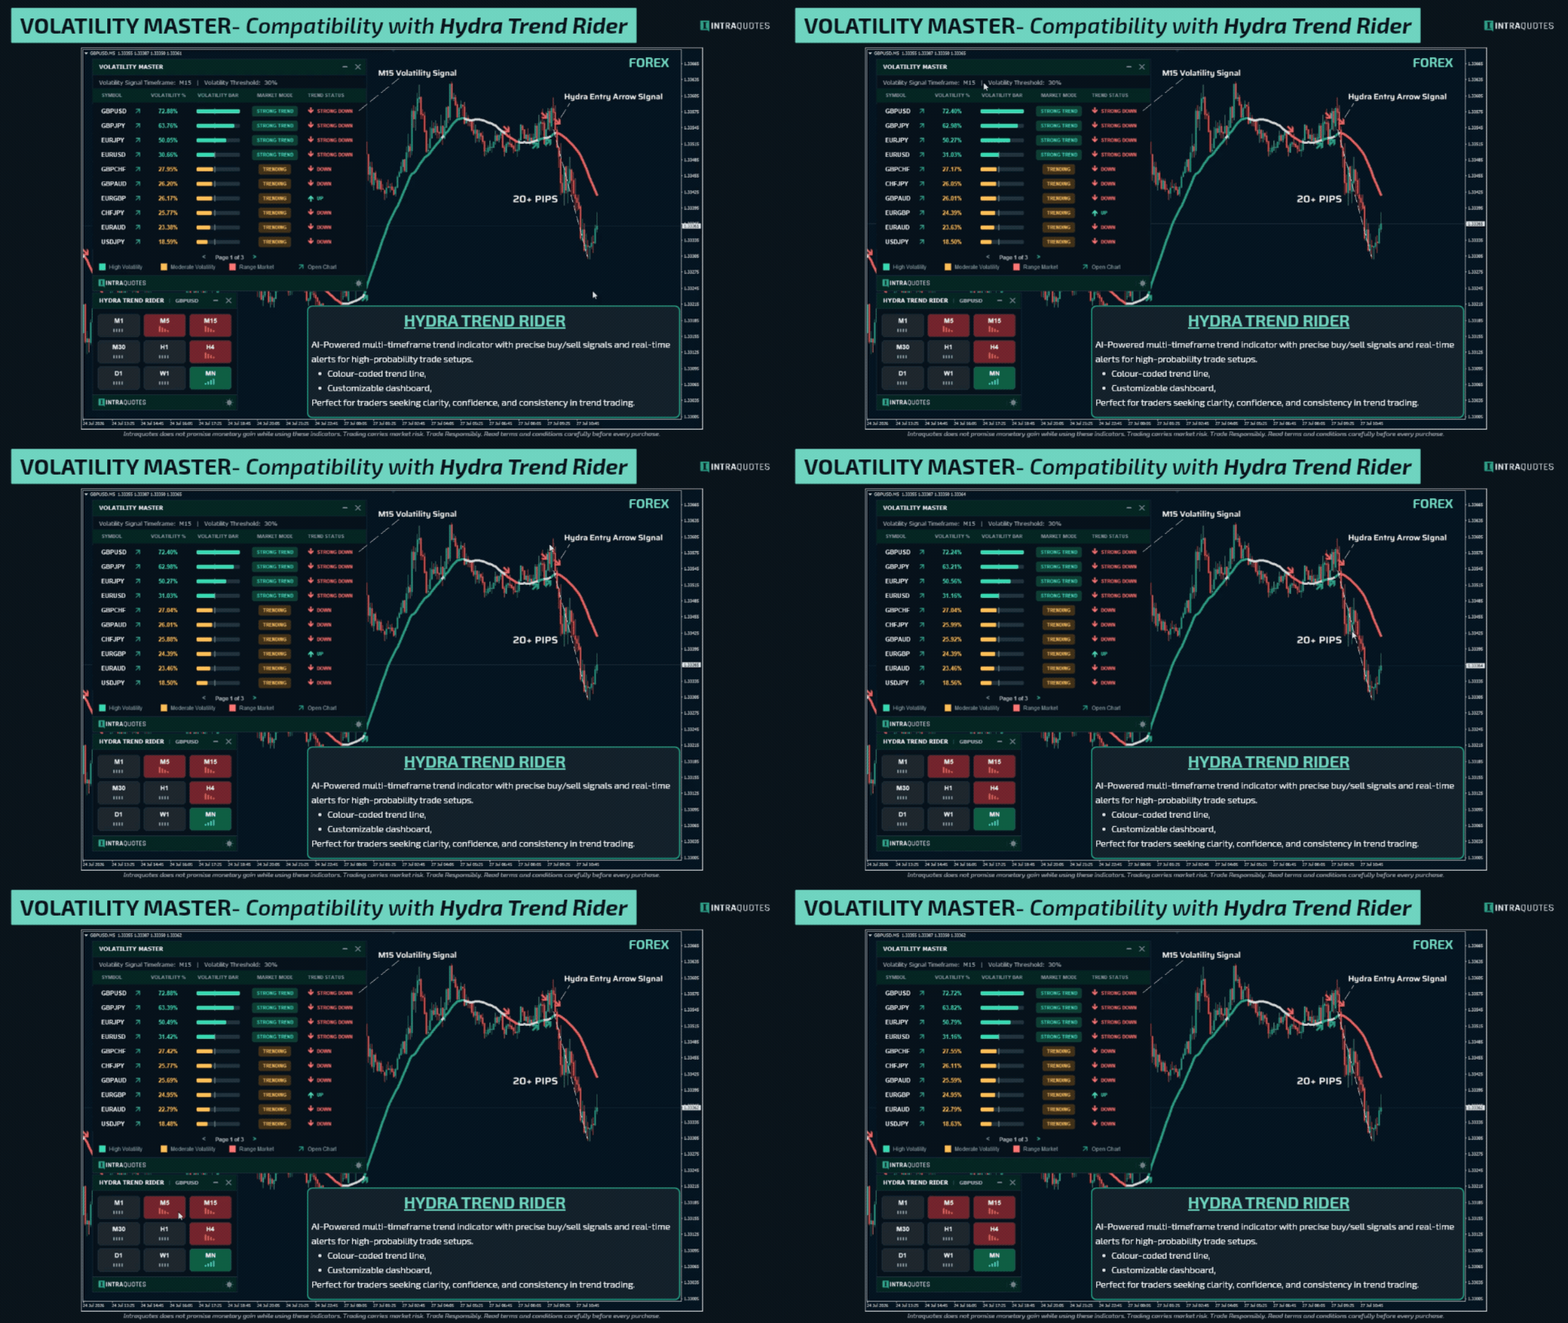
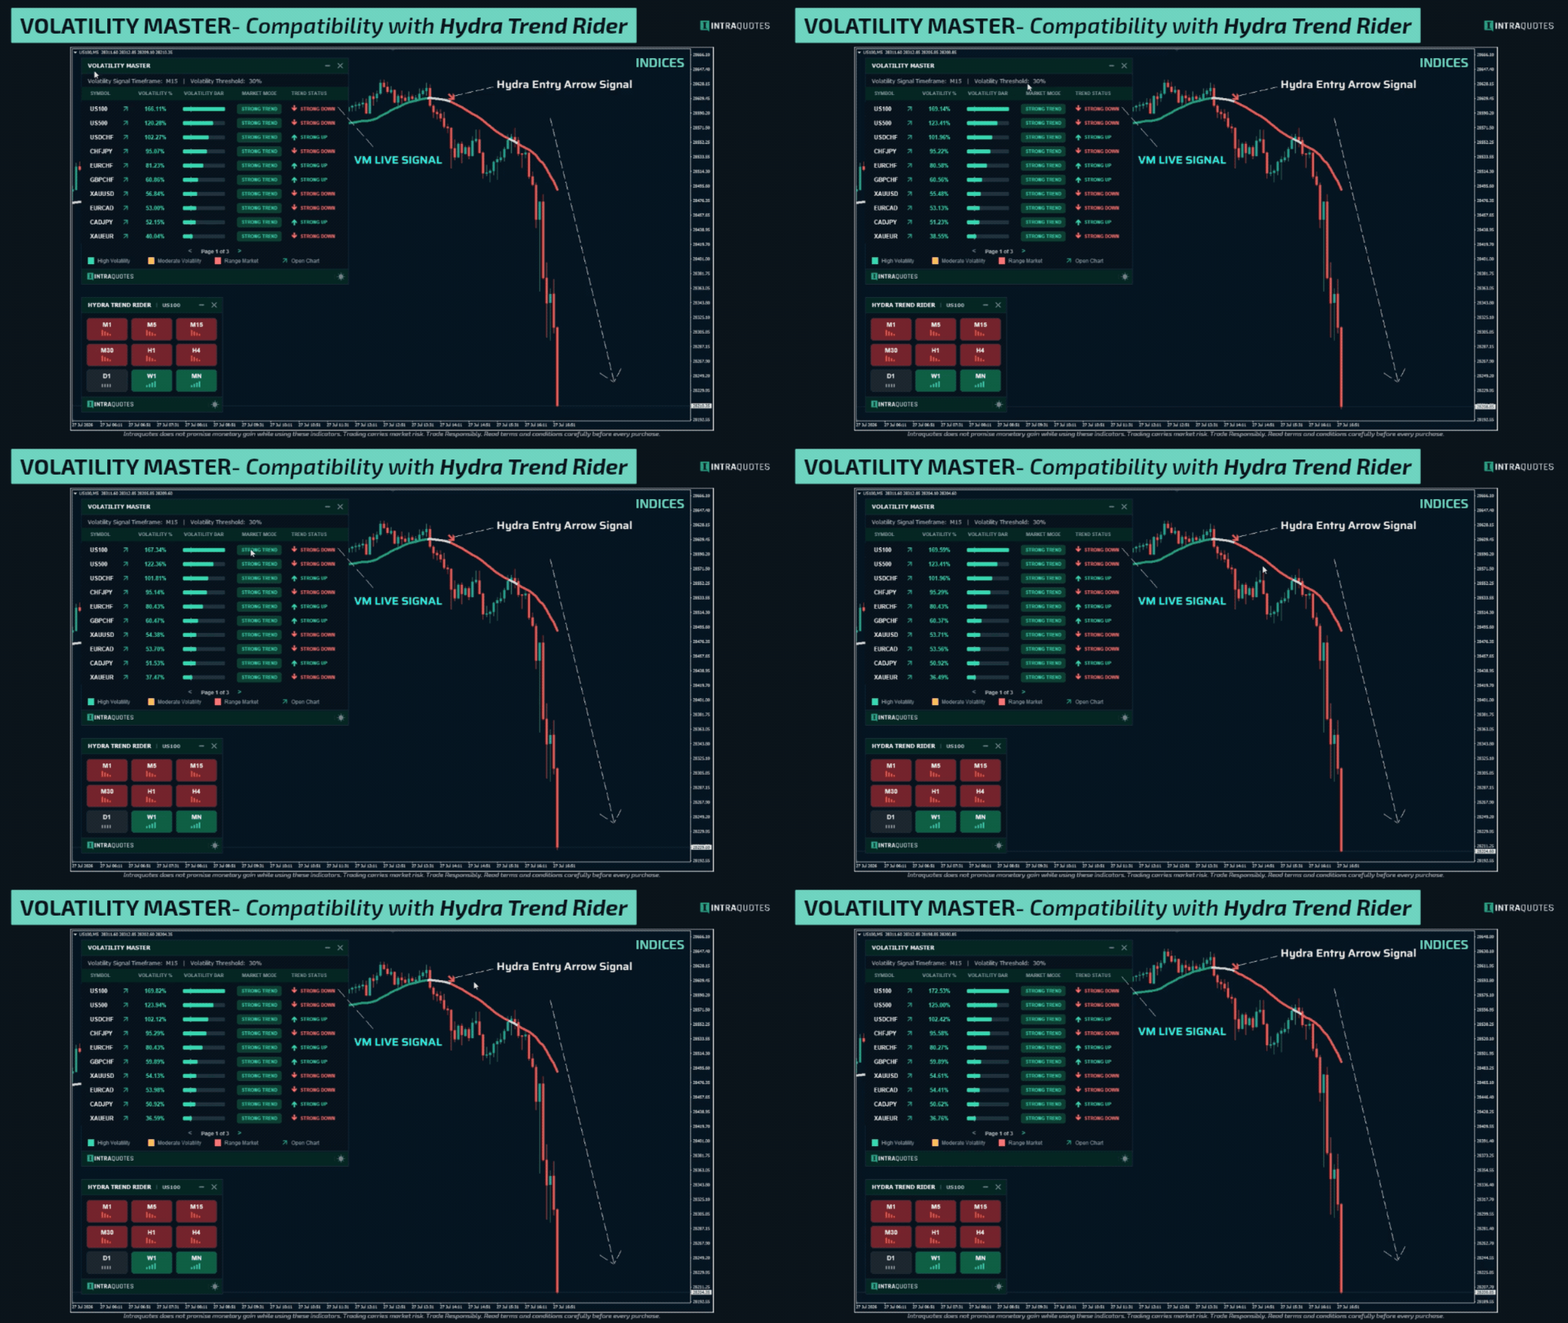
        For better trend confirmation signal and entry precision, pair it up with the Hydra Trend Rider (check the user manual for more details)

      3. Interact with the Dashboard
        Switch timeframes instantly by clicking the M15, H1, H4, or D1 buttons at the top of the dashboard to scan the volatility signal of the same symbols on different timeframes without leaving your current chart.
        Once you find your suitable symbol to trade, click on the arrow icon on the dashboard placed beside your chosen Symbol Name, and the indicator will instantly change your current chart to that pair so you can check your symbol’s real-time status instantly on the same chart.

      4. Pro Tip for Alerts:
        If you are scanning 30-50 pairs, set your Alert Settings to Top 3 or Top 5. This ensures you only receive notifications for the absolute strongest movers in the market, keeping your trading hyper-focused and stress-free with less noise!


      End Notes:

      Indicator Technical Support: Message here

      Stop wasting time in low-volatile markets and start trading with confidence in trending markets. Volatility Master is the ultimate tool for identifying high-probability opportunities, saving you from frustrating range-bound conditions. With real-time signals, customizable settings, and a user-friendly dashboard, this indicator gives you the edge to trade smarter and more efficiently. Upgrade your trading game today, get Volatility Master now.

      Risk Disclosure:

      Trading financial markets carries inherent risks and may not be suitable for every investor. This indicator is designed as a tool to assist in trading decisions but does not guarantee profits or prevent losses, which could exceed your initial investment. Past performance is not a reliable indicator of future outcomes. Users are encouraged to fully understand the risks and seek independent financial advice if needed. Any trading decisions made using this indicator are at the user's discretion and responsibility.

      Related Topics: market volatility, multi-timeframe volatility signal, Trend analysis, volatility trading strategy, volatility trading, trend following, forex, multi-currency analysis, volatility dashboard, volatility scanner, trending symbols, bullish bearish signals, volatility percentage, market volatility tracking.
      评分 6
      cam028
      6492
      cam028 2025.10.08 07:42 
       

      great product

      MP_mpap
      633
      MP_mpap 2025.09.08 13:10 
       

      ⭐️⭐️⭐️⭐️⭐️ The indicator is excellent! I would personally prefer it to offer more adjustable parameters, especially for those who want the signals to appear with more or less delay — and to include filters such as RSI, MACD, or support/resistance levels. The developers are truly outstanding: polite, responsive, and always open to new ideas. Overall, it's a great tool — and if you're working with an MTF strategy, it can definitely help you catch solid entries. Highly recommended without reservation!

      11/11/2025 Update: With the new additions, it has become even more focused and clearly better than before. Great job once again!

      sweethomeboy2
      604
      sweethomeboy2 2025.06.05 20:33 
       

      This indicator is incredibly helpful. You don’t need to watch the screen all day—it tells you exactly when to start trading. You can focus on other things in life without worrying about missing out. It saves both time and money

      推荐产品
      Advanced Trend Regime
      Shellard Securities (Pty) Ltd
      The indicator has been designed to function on any time-frame and any pair.   This regime filter will help the trader better evaluate whether the current market is trending, and in which direction. It quickly reacts to changes in market dynamics using a series of advanced calculations. The user is able to select whether the calculation remains standard, or if a further filter constraint is added to the calculation.   A Yellow moving average of the signal has been included for the trader to smoot
      PipFinite Trend PRO
      Karlo Wilson Vendiola
      4.88 (2251)
      Breakthrough Solution For Trend Trading And Filtering With All Important Features Built Inside One Tool! Trend PRO's smart algorithm detects the trend, filters out market noise and gives entry signals with exit levels. The new features with enhanced rules for statistical calculation improved the overall performance of this indicator. Important Information Revealed Maximize the potential of Trend Pro, please visit www.mql5.com/en/blogs/post/713938 The Powerful Expert Advisor Version Automatin
      Indicador Taurus All4
      Fabio Oliveira Magalhaes
      Taurus All4 Taurus All4 is a high-performance indicator, it will tell you the strength of the trend, and you will be able to observe the strength of the candle. Our indicator has more than 4 trend confirmations. It is very simple and easy to use. Confirmation Modes Candle Trend Confirmations: When the candle switches to light green the trend is high. When the candle switches to light red the trend is reverting down. When the candle changes to dark red the trend is low. Trendline Trend Confirm
      Super Reversal Pattern
      Parfait Mujinga Ndalika
      Super Reversal Pattern Indicator Unlock the power of advanced pattern recognition with our Super Reversal Pattern Indicator. Designed for traders seeking precision and reliability, this indicator identifies one of the most effective reversal patterns in technical analysis, offering a significant edge in your trading strategy. Key Features: Non-Repainting Accuracy: Enjoy the confidence of non-repainting technology. Once a Super Reversal Pattern is detected, it remains static, providing consiste
      Master Volume profile
      Israr Hussain Shah
      Money Flow Profile MT5 HERE   Here   our more valuable tools SMC Trend Trading   ,  Easy SMC Trading  ,  Institutional SMC Architect Volume Analysis Tools  ,  Volume flow Profile  ,  Market volume profile  , FVG with Volume  , Liquidity Heatmap Profile  ,  Volume Spread Analysis This Master Edition is engineered for clarity and speed, featuring a unique Auto-Theme Sync system that instantly beautifies your chart layout upon loading. Key Features: True Money Flow Calculation: Goes beyond stand

      VR Cub
      Vladimir Pastushak
      VR Cub 这是获得高质量切入点的指标。该指标的开发是为了促进数学计算并简化对仓位入场点的搜索。多年来,该指标所针对的交易策略已被证明其有效性。交易策略的简单性是其巨大的优势,即使是新手交易者也能成功进行交易。 VR Cub 计算开仓点以及获利和止损目标水平,这显着提高了效率和易用性。查看使用以下策略进行交易的屏幕截图,了解简单的交易规则。 设置、设置文件、演示版本、说明、问题解决,可以从以下位置获取 [博客] 您可以在以下位置阅读或撰写评论 [关联] 版本为 [MetaTrader 5] 计算入场点的规则 开仓 要计算入场点,您需要将 VR Cub 工具从最后一个高点拉伸到最后一个低点。 如果第一个点在时间上早于第二个点,交易者等待柱线收于中线上方。 如果第一个点在时间上晚于第二个点,交易者等待柱线收于中线下方。 根据上述条件,严格在 柱线收盘 后建仓。 换句话说,如果我们在小时图上进行交易,那么从最高点到最低点的时间距离必须超过24小时,最高点和最低点之间的点数必须大于或等于平均价格变动每天。 维持和改变市场地位 可以有多个未平仓头寸;每个头寸都可以单独修改。 VR Cub
      In the stock market technical analysis, support and resistance is a concept that the movement of the price of a security will tend to stop and reverse at certain predetermined price levels. Support and resistance levels can be identified on any timeframe. However, the most significant ones are found on the higher time frames, such as daily, weekly, and monthly. This indicator using the weekly OHLC data to identify the relevant levels. This is a support and resistance indicator and providing majo
      Power Renko MT4
      Pierce Vallieres
      Power Renko is an indicator which plots Renko bricks underneath the chart using a histogram. You can select the brick size and the timeframe of the Renko bricks as well as whether or not to use the close price or the high/low price of the candles. Renko bricks are based on price alone, not time, therefor the Renko bricks will not be aligned with the chart's time. They are extremely useful for trend trading and many different strategies can be formed from them. Buffers are provided allowing you t
      “动态剥头皮震荡指标”是一款高级自定义加密货币外汇指标,适用于 MT4 平台,高效交易! ............................................................................................................ - 新一代震荡指标 - 参见图片了解如何使用。 - 动态剥头皮震荡指标具有自适应超卖/超买区域。 - 震荡指标是一款辅助工具,可从动态超卖/超买区域找到准确的入场点。 - 超卖值:低于绿线,超买值:高于橙线。 - 该指标也非常适合与价格行为模式结合使用。 - 它比标准震荡指标更精准。 - 提供 PC 和移动端警报。 ................................................... 点击这里查看高质量的交易机器人和指标! 本产品为原创,仅在 MQL5 网站上提供。
      Shark Deal Book
      Philip Pankaj Suthagar
      4 (3)
      Term  "shark"  in the business world denotes a high volume investor who just made a good investment in a highly Potential business deal.So, sharks are the ones who make the market move. In our case, if an American shark bought a Japanese company, he/she has to convert American dollars into Japanese yen to make the deal. So, the demand for the Japanese yen will increase sharply. Thus USD/JPY will go short rapidly if the deal was from the shark. Another example, In the case of forex, if fed increa
      30% DISCOUNT ! DISCOUNT ! DISCOUNT ONLY FOR 5 USERS at125$ valid for 1 day only.Grab it The PERFECT TREND HIT creates   BUY and SELL  perfect trend   arrow signals based on ADX EMA AND RSI And all filters inbuilt with accurate trend entries. Furthermore, the indicator and template display the trend direction, strength, and trade recommendation for independent price charts. ROCK WITH THE TREND Moreover, it shows the final trade recommendation to BUY or SELL with all filters and displays that info
      ACB Breakout Arrows
      KEENBASE SOFTWARE SOLUTIONS
      4.15 (34)
      结合交易环境的突破信号 ACB Breakout Arrows 识别价格进入平稳阶段后出现的方向性突破,并用买入或卖出箭头标记该形态。箭头代表检测到的突破形态,并不保证每个信号都会发展成大幅行情。 买入箭头表示看涨突破形态,卖出箭头表示看跌突破形态。价格可能回测突破区域,也可能重新回到原有区间,因此入场前应检查周围的市场结构、趋势方向以及附近的支撑或阻力。 在图表上规划交易 指标可以围绕每个信号绘制实用的参考价位: Stop Loss: 根据所选 K 线数量计算的保护价位。 Quick Profit: 较近的目标,可用于提前离场、部分止盈或决定是否移动到保本位置。 Take Profit: 为选择继续持有突破行情的交易者提供更远的目标价位。 这些价位有助于建立一致的交易计划,但仓位大小和最终的交易管理仍由交易者负责。 确认突破 多周期面板可帮助您比较不同可用图表周期上的突破信号。如需更多背景信息,可以使用 ACB Trade Filter 检查市场情绪和趋势方向。绿色配合看涨趋势支持多头形态,红色配合看跌趋势支持空头形态,灰色配合横盘趋势则表示市场条件混合。 您还可以检查买入信号是否直
      ZhiBiCCI MT4
      Qiuyang Zheng
      【ZhiBiCCI】指标适合所有的周期使用,也适合所有的市场品种。 【ZhiBiCCI】绿色实线是逆转看涨背离。绿色虚线是经典的看涨背离。 【ZhiBiCCI】向红色实线是反向看跌背离。红色虚线是古典看跌背离。 【ZhiBiCCI】可以在参数里面设置(Alert、Send mail、Send notification),设置为(true)就可以发送即时信号到警报窗口、电子邮件、即时消息。 参数设置说明: 【displayAlert】:这是警报开关,设置成true,如果出现箭头就会自动警报提示;设置成false,则不会警报提示。 【sendmail_NO_OFF】:这是发送邮件的开关,设置成true,如果出现箭头就会发送邮件到你在MT4设置好的邮箱里面;设置成false,则不会发邮件。 【sendnotification_NO_OFF】:这是发送即时消息的开关,设置成true,如果出现箭头就会发送消息到你的移动设备;设置成false,则不会发消息。 更多好用的指标网址: https://www.mql5.com/en/users/zhengqiuyang/seller
      Auto Fibo Pro m
      DMITRII GRIDASOV
      “Auto FIBO Pro” Crypto_Forex 指标 - 是交易中的绝佳辅助工具! - 指标自动计算并放置在图表斐波那契水平和局部趋势线(红色)上。 - 斐波那契水平指示价格可能反转的关键区域。 - 最重要的水平是 23.6%、38.2%、50% 和 61.8%。 - 您可以将其用于反转剥头皮或区域网格交易。 - 还有很多机会可以使用 Auto FIBO Pro 指标来改进您当前的系统。 - 它具有信息价差掉期显示 - 它显示所连接的外汇对的当前价差和掉期。 - 显示屏还显示账户余额、净值和保证金。 - 可以将信息价差掉期显示定位在图表的任何角落 . 点击这里查看高质量的交易机器人和指标! 这是仅在此 MQL5 网站上提供的原创产品。 ...............................................
      FreqoMaster
      Stanislav Korotky
      The main idea of this indicator is rates analysis and prediction by Fourier transform. The indicator decomposes exchange rates into main harmonics and calculates their product in future. The indicator shows 2 price marks in history, depicting price range in the past, and 2 price marks in future with price movement forecast. Buy or sell decision and take profit size are displayed in a text label in the indicator window. The indicator uses another indicator as an engine for calculations - FreqoMet
      ProEngulfing
      Ashkan Hazegh Nikrou
      4.5 (2)
      介绍ProEngulfing - 您的专业MT4 Engulf模式指标 解锁精准力量,使用ProEngulfing,一款先进的指标,旨在识别和突出外汇市场上的合格的吞没模式。为MetaTrader 4开发,ProEngulfing提供了一种细致入微的吞没模式识别方法,确保您只收到最可靠的交易决策信号。 ProEngulfing的工作原理: ProEngulfing采用先进的算法分析吞没模式,不仅仅是简单地识别模式,还确保这些模式确实是合格的。以下是它的工作原理: 资格标准:该指标评估实体百分比与整个蜡烛大小的关系,并考虑影子百分比与蜡烛大小的比较。这种细致入微的评估确保只有高概率的吞没模式引起您的注意。 连续确认:ProEngulfing在吞没模式之前寻找足够数量的连续反向条,提供对模式可靠性的额外确认。 双向信号:ProEngulfing提供两种不同的信号模式 - 在方向和反向方向。用户可以通过图表上的按钮轻松切换这些模式。 在方向模式中:在触及或回溯移动平均线时显示吞没模式。 反向方向模式:显示在移动平均线上方一定距离处发生的熊市合格吞没模式,表明市场可能发生逆转。 回测功能:P
      Magical Arrow
      Ranguni Abdulsamir Abdulmajid
      Magical Arrow Indicator – Clear & Reliable Signals The Magical Arrow Indicator is a non-repainting, trend-following tool that gives you crystal-clear Buy and Sell signals . It  high-probability reversals and entries . No more guesswork – just follow the arrows on your chart! The Magical Arrow Indicator is a powerful, easy-to-use trading tool that helps you catch the most profitable Buy and Sell opportunities in the Forex market. It is designed for beginners and professional traders , giving you
      Introducing the "Magic Trades" for MetaTrader 4 – your ultimate tool for precision trading in dynamic markets. This innovative indicator revolutionizes the way you perceive market trends by harnessing the power of advanced analysis to detect subtle changes in character, paving the way for optimal trading opportunities. The Magic Trades Indicator is designed to empower traders with insightful entry points and well-defined risk management levels. Through its sophisticated algorithm, this indicato
      Alpha Trend sign Alpha Trend sign 是我么长期以来非常受欢迎的交易工具,它可以验证我们的交易系统,并且明确的提示交易信号,并且信号不会漂移。 主要功能: •  根据市场显示活跃区域,根据指标可以很直观的判断当前行情是属于趋势行情,还是震荡行情。    并根据指标的指示箭头切入市场,绿色箭头提示买入,红色箭头提示卖出。 •  建议使用5分钟以上的时间周期进行交易,避免因为小周期波动出现频繁的交易信号。 •  您也可以开启信号提示,以免错过最佳的交易时机。 •  本指标不但可以很好的预测趋势行情,也可以在宽幅震荡行情中获利。 •  本指标本着大道至简的原则,适合不同阶段的交易者使用。 注意事项: •  Alpha Trend sign 有明确的进出场信号,不建议逆势操作,以免造成损失。 •  Alpha Trend sign 是特别成熟的指标,我们团队人手一个,使用它可以实现稳定盈利。     
      Fourteen plus nine TD Sequential
      MOHAMMED IMAD HUSSEIN BASSEE
      Fourteen plus nine What is it for? Applying Tom DeMark’s TD Sequential serves the purpose of identifying a price point where an uptrend or a downtrend exhausts itself and reverses. . What are the main components of TD Sequential? TD Sequential has two parts – TD Setup and TD Countdown. The first phase of TD Sequential starts with a TD Setup and is completed with a 9 count. When the 9 count is completed, it is at that point, a price pause, price pullback, or reversal is likely. It is also at tha
      Trendiness Index
      Libertas LLC
      5 (3)
      "The trend is your friend" is one of the best known sayings in investing, because capturing large trendy price movements can be extremely profitable. However, trading with the trend is often easier said than done, because many indicators are based on price reversals not trends. These aren't very effective at identifying trendy periods, or predicting whether trends will continue. We developed the Trendiness Index to help address this problem by indicating the strength and direction of price trend
      PZ Support Resistance
      PZ TRADING SLU
      3.33 (3)
      厌倦了绘制支撑线和阻力线? 支撑阻力 是一个多时间指标,可以自动检测并绘制图表中的支撑线和阻力线,并具有非常有趣的变化:随着时间的推移测试价格水平及其重要性的提高,线变得越来越粗。 [ 安装指南 | 更新指南 | 故障排除 | 常见问题 | 所有产品 ] 一夜之间增强您的技术分析 无需浏览图表即可检测重要的价格水平 一目了然地识别所有价格水平的相对优势 每次交易最多可节省半小时的绘图线 指标显示所有价格水平的期限 指示器不重涂 过去和现在的价格水平因接近程度而崩溃,并根据当前的市场行为进行了调整。在动作发生的地方绘制了线条,而不一定在峰值处绘制了线条。 价格水平随着时间的推移而被拒绝,变得越来越暗 定期清除不重要的价格水平以避免噪音 可自定义的时间范围选择和崩溃因子 它实现了电子邮件/声音/推送警报的突破 输入参数 指标设置:指标将从当前时间段读取价格,但您可以选择另一个。例如,您可以在H4图表中显示D1支撑线和阻力线。您还可以使用 价格水平密度 参数选择在图表上显示多少价格水平。 颜色设置:根据重要性输入所需的支撑线和阻力线颜色。 标签设置:(可选)可以在指示器中显示用于
      Smart Moves Binary Indicator for MT4 Overview Smart Moves Binary Indicator is a technical analysis indicator for MetaTrader 4 (MT4) designed to help traders identify potential BUY and SELL opportunities after candle confirmation. Signals are generated only after the current candle has closed, ensuring that confirmed arrows remain fixed on historical bars without recalculation. The indicator is suitable for any Forex currency pair and supports multiple timeframes, making it adaptable to differen
      Fisher Yur4ik Alert
      Biswarup Banerjee
      Fisher Yur4ik MT4 是一种先进的交易指标,利用技术分析的力量为交易者提供对市场趋势的精准洞察。专为 MetaTrader 4 设计,这个指标非常适合希望提升决策过程和改善交易结果的交易者。 通过使用 Fisher Yur4ik MT4,交易者可以获得竞争优势,实时警报和清晰的视觉信号使他们能够抓住各种金融市场中的盈利交易机会。 MQL 产品安装指南 | 在 MT4/MT5 上更新已购买的 MQL 产品 | 常见故障排除指南 | 指标设置 / 指南 主要特点 缓冲区集成:将指标值暴露为可访问的缓冲区,使 Expert Advisor 能够利用基于信号的交易策略。 快速且可回测:基于 MetaTrader 的原生 OnCalculate() 引擎构建,快速计算并与策略测试器完全兼容。 弹出警报:在信号事件上触发 MetaTrader 警报弹出,确保您不会错过任何交易设置。 推送通知:实时推送通知发送到您的 MetaTrader 移动应用,便于随时监控市场情况。 电子邮件警报:在信号事件上提供电子邮件通知,允许您在离开交易终端时进行远程监控。 图表上的仪表板:在图表上直接显示
      Please follow the "How To Trade" instructions exactly for best results Wycoff theory is vastly used by institutional traders but when it comes to retail traders the concept isn't well understood by most. It is even more difficult to implement in intraday & swing trading. This No REPAINT indicator helps you in analyzing the market cycles and plots buy/sell signals at the start of trending phase. It studies the market strength of bulls and bears and does a effort Vs reward matrix calculation befor

      Signal From Level
      Yaroslav Varankin
      Binary Options Support Resistance Indicator This indicator is designed for binary options trading and effectively shows retracements from support and resistance levels. Signals appear on the current candle. A red arrow pointing downwards indicates a potential selling opportunity, while a blue arrow pointing upwards suggests buying opportunities. All that needs adjustment is the color of the signal arrows. It is recommended to use it on the M1-M5 timeframes as signals are frequent on these timef
      "Impulses and Corrections 4" is created to help traders navigate the market situation. The indicator shows multi-time frame upward and downward "Impulses" of price movements. These impulses are the basis for determining the "Base" , which is composed of zones of corrections of price movements, as well as "Potential" zones for possible scenarios of price movement. Up and down impulses are determined based on a modified formula of Bill Williams' "Fractals" indicator. The last impulse is always "U
      Trend PA
      Mikhail Nazarenko
      5 (3)
      The Trend PA indicator uses   Price Action   and its own filtering algorithm to determine the trend. This approach helps to accurately determine entry points and the current trend on any timeframe. The indicator uses its own algorithm for analyzing price changes and Price Action. Which gives you the advantage of recognizing, without delay, a new nascent trend with fewer false positives. Trend filtering conditions can be selected in the settings individually for your trading style. The indicator
      This is a mini One pair version of Advanced Detector of Trend Reversal and Continuance known as TrueTrendStarM(TTSm25). It is a sensitive and Predictive indicator of Price Trends for Professional traders.  ( ATTENTION BUYERS:-Now the indicator is available for UNLIMITED TIME ONE TIME buy of just $500 ). Avail the Opportunity.    It detects high odds changes in Price Trend direction long before other indicator detects it. I have been working on it since 2019.    This is possible due to fractal
      Rainbow Price Visualizer
      Vincent Jose Proenca
      Rainbow Price Visualizer v1.21 See where the market really breathes. Turns your MT4 chart into an ultra-precise heatmap that highlights price zones favored by big players. Why it matters 300 price levels at 0.2‑pip resolution — microscopic detail. 8 visual themes (Rainbow, Fire, Ocean…) for instant readibility. Smart opacity: low noise fades, real zones pop. Lightweight rendering with automatic cleanup. Fully customizable: saturation, opacity, resolution, history depth. Bands project into the f
      该产品的买家也购买
      Neuro Poseidon MT4
      Daria Rezueva
      4.8 (45)
      Neuro Poseidon is a new indicator by Daria Rezueva. It combines precise trading signals with adaptive TP/SL levels - creating best possible trades as a result! Message me and get  Neuro Poseidon Assistant  as a gift to automize your trading process! What makes it stand out? 1. Proven profitability on all assets and timeframes 2. Only confirmed BUY and SELL signals present on the chart 3. Adaptive TP & SL levels generated by the software for each trade 4. Easy to understand - suitable for all
      目前八折优惠! 对任何新手或专家交易者来说都是最好的解决方案! 这个仪表板软件适用于28种货币对。它基于我们的两个主要指标(高级货币强度28和高级货币冲动)。它对整个外汇市场提供了一个伟大的概述。它显示高级货币强度值,货币运动速度和28个外汇对在所有(9)时间段的信号。想象一下,当你可以使用图表上的单一指标观察整个市场,以确定趋势和或剥头皮的机会时,你的交易将得到改善 我们已经在这个指标中建立了一些功能,使你更容易识别强势和弱势货币,同时识别和确认潜在的交易。该指标以图形方式显示货币的强势或弱势是增加还是减少,以及它在所有时间段的表现。 增加的新功能是动态市场斐波那契水平,它适应当前的市场条件变化,这是一个已经在我们的高级货币强度28和高级货币冲动指标中使用的成熟的加分项。 在交易时,总是将弱势货币和强势货币配对,这个新指标将帮助你做到这一点。 用户手册:点击这里  https://www.mql5.com/en/blogs/post/708783 特点  显示每个时间段的ACS28和GAP-speed(冲动)的货币强度值。 列:颜色代码以7种颜色显示货币强度:强势
      IQ Gold Gann Levels
      INTRAQUOTES
      5 (5)
      Presenting one-of-a-kind Gann Indicator for XAUUSD IQ Gold Gann Levels is a non-repainting, precision tool designed exclusively for XAUUSD intraday trading. It uses W.D. Gann’s square root method to plot real-time support and resistance levels, helping traders spot high-probability entries with confidence and clarity. William Delbert Gann (W.D. Gann) was an exceptional market analyst whose trading technique was based on a complex blend of mathematics, geometry, astrology, and ancient calculation
      BTMM State Engine Pro MT4
      Garry James Goodchild
      BTMM State Engine Pro by G-Labs — Beat The Market Maker indicator for MetaTrader 4. Asian session range, London and New York kill zones, level progression (L1/L2/L3), peak formation detection (PFH/PFL), entry signals, and a multi-pair scanner from one chart. Stop scanning charts one pair at a time. The State Engine tracks the BTMM daily cycle automatically — Asian box, room boundaries, level blocks, peak formations, and filtered entries — while the scanner dashboard shows level, peak status,
      IQ FX Gann Levels
      INTRAQUOTES
      5 (2)
      IQ FX Gann Levels a precision trading indicator based on W.D. Gann’s square root methods . It plots real-time, non-repainting support and resistance levels to help traders confidently spot intraday and scalping opportunities with high accuracy. William Delbert Gann (W.D. Gann) was an exceptional market analyst, whose trading technique was based on a complex blend of mathematics, geometry, astrology, and ancient mathematics which proved to be extremely accurate. Setup & Guide:  Download  MT5 Ver
      Friends, we present to your attention our new Forex Gump Laser indicator. Since there are no designers in our team, but mainly mathematicians, financiers, programmers and traders, we did not make any special changes in the indicator design. In appearance, it resembles the usual Forex Gump. On the other hand, Forex Gump has become not just the name of an indicator, it is a brand. And we try to preserve the corporate identity in all its varieties. The whole essence of the indicator in its operatio
      Super Signal – Skyblade Edition 專業級無重繪 / 無延遲趨勢信號系統,擁有卓越勝率 | 適用於 MT4 / MT5 在較低的時間週期上效果最佳,例如 1 分鐘、5 分鐘與 15 分鐘圖表。 核心特色: Super Signal – Skyblade Edition 是一套專為趨勢交易設計的智能信號系統。 其採用多重濾波邏輯,僅篩選出具有明確方向性、動能強勁且波動結構健康的走勢進場點。 本系統 不預測高點或低點 ,只有在同時滿足以下三項條件時才會觸發交易信號: 趨勢方向明確 動能持續增強 波動率結構穩定 此外,系統還結合市場流動性分析,以進一步提升信號的準確性與觸發時機。 信號特性: 所有箭頭信號皆為 100% 無重繪,無延遲 信號一旦出現即固定於圖表,不會閃爍或消失 提供圖表箭頭、資訊面板、彈出通知、聲音提示及推播訊息 支援 EA 呼叫(Buffer 輸出),可整合至自動化交易或信號跟單系統 提供預設參數模板,免調整即可使用,適合新手快速上手 總結: Super Signal – Skyblade Edition 是一款邏輯清晰、穩定高效的專業趨勢型
      KURAMA GOLD SIGNAL PRO(MT4)— 7层过滤 · 自动止盈止损 · 质量评分 · 信号历史保存 | 完整的XAUUSD交易系统 实时不重绘。信号出现的瞬间,箭头、入场、止盈、止损当场锁定,之后绝不移动。你交易的就是这个实时信号。而且在v7.20中,每一个真正发出的信号都会自动保存,并在重启后精确还原。 购买者专属赠品 购买永久授权,即可免费获得 AI Zone Radar(价值$59)+ 完整PDF手册。在产品价格之外,额外附赠价值$59的赠品。购买后在MQL5上给我留言即可。 AI Zone Radar: https://www.mql5.com/en/market/product/175834 在黄金交易者社区中被实际使用,因精度与易用性而广受好评。 你的难题 —— 以及解决方案 黄金一天波动$30–$50。你知道机会就在那里。但这些情况是否似曾相识: - 入场太早,价格逆行$10后才朝你的方
      Dynamic Forex28 Navigator
      Bernhard Schweigert
      4.43 (7)
      Dynamic Forex28 Navigator - 下一代外汇交易工具。 当前 49% 折扣。 Dynamic Forex28 Navigator 是我们长期流行的指标的演变,将三种功能合二为一: 高级货币强度 28 指标 (695 条评论)+ 高级货币 IMPULSE 带警报 (520 条评论)+ CS28 组合信号(奖励)。 有关指标的详细信息 https://www.mql5.com/en/blogs/post/758844 下一代强度指标提供什么? 您喜欢的原始指标的一切,现在通过新功能和更高的精度进行了增强。 主要特点: 专有货币强度公式。  所有时间范围内的平滑和准确的强度线。 非常适合识别趋势和精确进入。 动态市场斐波那契水平(市场斐波那契)。  此指标独有的独特功能。 斐波那契应用于货币强度,而不是价格图表。 适应实时市场活动以获得准确的反转区域。 实时市场动量。  第 9 行显示市场是活跃还是被动。 对于定时交易至关重要。 全面的警报和显示。  每种货币最强的买入和卖出动量。 ​​28 对的双重动量买入和卖出。 超买/超卖警告外部范围和止损。 反转
      Quantum Breakout Indicator PRO
      Bogdan Ion Puscasu
      4.96 (26)
      介绍     Quantum Breakout PRO   ,突破性的 MQL5 指标,正在改变您交易突破区域的方式!   Quantum Breakout PRO 由拥有超过 13 年交易经验的经验丰富的交易者团队开发,旨在通过其创新和动态的突破区域策略将您的交易之旅推向新的高度。 量子突破指标将为您提供带有 5 个利润目标区域的突破区域的信号箭头,以及基于突破框的止损建议。 它既适合新手交易者,也适合专业交易者。 量子 EA 通道:       点击这里 MT5版本:   点击这里 重要的!购买后请私信我领取安装手册。 建议: 时间范围:M15 货币对:GBPJPY、EURJPY、USDJPY、NZDUSD、XAUUSD 账户类型:ECN、Raw 或 Razor,点差极低 经纪商时间:GMT +3 经纪商:IC Markets、Pepperstone with Raw 和 Razor 的点差最低 规格: 不重漆! 最多 5 个建议利润目标区域 建议止损水平 可定制的盒子。您可以设置自己的 Box Time Start 和 Box Time End。 接触 如果您
      Supply and Demand Dashboard PRO
      Bernhard Schweigert
      4.81 (21)
      目前八折优惠! 这个仪表板是一个非常强大的软件,可用于多个符号和多达9个时间段。 它是基于我们的主要指标(最佳评论:高级供应需求)。 Advanced Supply Demand 该仪表板提供了一个伟大的概述。它显示。   筛选后的供需值,包括区域强度评级。 区间内和区间外的点位距离。 它突出了嵌套的区域。 在所有(9个)时间段内,它对所选符号发出4种警报。 它是高度可配置的,以满足您的个人需求! 您的利益! 对每个交易者来说,最重要的问题是。 什么是入市的最佳水平? 在强大的供应/需求区域内或附近进入你的交易,以获得最佳的成功机会和风险/回报。 我的止损的最佳位置是哪里? 把你的止损放在强势供应/需求区的下方/上方是最安全的。 我的最佳盈利目标是什么? 你的退出策略和你的进入策略一样重要,了解更高的时间框架图可以帮助你。对于买入,使用下一个供应区作为目标,对于卖出,使用下一个需求区作为目标。在回撤到供应区或需求区时进场,以确保有足够的利润空间,达到更高的时间框架的供应和需求,将增加你的利润。 为什么我们要过滤强区和弱区? 不平衡性越大,价格的变动就
      Neo Wave PRO
      Nikolay Raykov
      5 (1)
      Price & Time Market Structure Indicator A professional market structure tool that analyzes waves through both price and time — not price alone. Main Description NeoWave PRO is a professional market structure indicator for MetaTrader 4 designed for traders who want to move beyond traditional one-dimensional wave tools such as ZigZag, swing indicators, and basic high/low systems. Most wave indicators analyze only one thing: Price. But a real market wave is not only a price movement. A true wave de
      Owl smart levels
      Sergey Ermolov
      4.26 (38)
      在顺势交易中,主要的难点不在于找到一个水平位,而在于理解哪里才是一个真正有效的入场点。 价格经常对水平位产生反应,但无法延续 движение — 这会导致错误入场或错过行情。 Owl Smart Levels 不仅仅显示水平位 ,还会基于市场结构和回调构建区域。这使你可以以不同的方式评估入场点,并避免一部分虚假信号。 Owl Smart Levels 系统包含什么? Owl Smart Levels 不只是标记水平位,而是一个 完整的交易模型 ,其中每个元素相互配合。 系统包含: Owl Smart Levels(指标) 显示趋势方向、回调区域,以及预定义的入场、止损和止盈水平 系统指南 解释如何在实战中使用信号:哪些情况需要考虑,哪些需要忽略,以及如何管理交易 交易决策清单 帮助你快速评估信号,避免基于“感觉”入场 Owl Helper 辅助EA 简化交易执行和管理 (一键下单) 说明、示例和策略 帮助你快速上手,并在实践中理解系统逻辑 最终,你获得的不是一个单独的工具,而是一个完整的交易框架 —— 从分析到执行。 阅读更多: Owl Smart Levels 如何发展
      MTF Supply Demand Zones
      Georgios Kalomoiropoulos
      4.82 (22)
      下一代自动化供需区。适用于任何图表的创新算法。所有区域都是根据市场的价格行为动态创建的。 两种类型的警报 --> 1) 当价格触及区域时 2) 当新区域形成时 你不会再得到一个无用的指标。您将获得一个完整的交易策略和经过验证的结果。     新的功能:     价格触及供需区时发出警报     创建新的供应/需求区时发出警报     推送通知警报     以点为单位的区域宽度标签     关于 MTF 的又一个时间表。因此,现在您将能够看到高于当前 3 个时间帧,而不是高于当前 2 个时间帧     启用/禁用警报/区域/MTF 功能的按钮 您获得的优势:     消除交易中的情绪。     客观化您的交易条目。     通过高概率设置提高您的利润。     节省绘图区域的时间。     像专业人士一样交易金融市场。     任何市场的即时多时间框架分析。 你在图表上看到了什么?     蓝色和红色矩形是当前时间范围的供需区。     虚线样式线是当前上方第一个时间范围内的供需区域。     实线样式线是当前上方第二个时间范围内的
      Built-in multi-symbol scanner — traffic-light grid for up to 30 pairs across four timeframes. No separate scanner file required. BUY, SELL, WAIT cells with confluence score and recent structure event. Full alignment with AI Trade Idea — current chart cell reads live engine data so scanner, dashboard, and AI panel always show the same verdict, score, and reason. Per-cell explain popup — four-section breakdown of what is happening, how the score was built, what to look for, and what to watch out
      GOLD Impulse with Alert
      Bernhard Schweigert
      4.67 (12)
      这个指标是我们2个产品 Advanced Currency IMPULSE with ALERT  +   Currency Strength Exotics 的一个超级组合。 它适用于所有时间框架,并以图形方式显示8种主要货币和一种符号的强势或弱势冲动! 该指标专门用于显示任何符号的货币强度加速,如黄金、异国货币对、商品、指数或期货。这是它的第一个指标,任何符号都可以被添加到第9行,以显示黄金、白银、石油、DAX、US30、MXN、TRY、CNH等的真实货币强度加速(冲动或速度)。 建立在新的基础算法上,它使识别和确认潜在的交易更加容易。这是因为它以图形方式显示了一种货币的强势或弱势是否正在加速,并测量了这种加速的速度--把它想象成你汽车中的速度表。当你加速时,事情显然会发生得更快,这在外汇市场上也是一样的,即如果你配对的货币正在向相反的方向加速,你就会发现一个潜在的有利可图的交易。 动态市场斐波那契28水平被用作警报触发器,将适应市场活动。如果冲动击中黄色触发线,你将收到警报。然后你就知道作为一个交易员应该做什么。货币对和方向已经给出。只需点击警报按钮,就可以切换到该货
      Miraculous 指标 – 100% 不重绘的外汇和二元期权工具,基于江恩九方图 这个视频介绍的 Miraculous 指标 是一款专为外汇和二元期权交易者开发的高精度、强大交易工具。该指标的独特之处在于它建立在传奇的 江恩九方图 和 江恩振动法则 之上,使其成为现代交易中可用的最精确预测工具之一。 Miraculous 指标 完全不重绘 ,这意味着它的信号在 K 线收盘后不会改变或消失——你看到的就是你得到的。这为交易者提供了可靠且一致的基础,让他们能够自信地进出场交易。 主要特点: 基于江恩九方图和江恩理论构建 100% 不重绘的信号系统 适用于所有时间周期(M1、M5、H1、H4、日线、周线) 适用于外汇和二元期权交易 清晰的买卖信号,准确率高 可用于剥头皮、日内交易或波段交易 兼容大多数 MT4 平台 这款工具旨在帮助初学者和专业交易者做出更好、更明智的决策。无论您是交易货币、指数还是二元期权,Miraculous 指标都将为您在市场中提供所需的优势。
      ECM Elite Channel is a volatility-based indicator, developed with a specific time algorithm, which consists of finding possible corrections in the market. This indicator shows two outer lines, an inner line (retracement line) and an arrow sign, where the channel theory is to help identify overbought and oversold conditions in the market. The market price will generally fall between the boundaries of the channel. If prices touch or move outside the channel, it's a trading opportunity. The ind
      NAM Order Blocks
      NAM TECH GROUP, CORP.
      3.67 (3)
      MT4多時限訂單塊檢測指示器。 特徵 -在圖表控制面板上完全可自定義,提供完整的交互。 -隨時隨地隱藏和顯示控制面板。 -在多個時間範圍內檢測OB。 -選擇要顯示的OB數量。 -不同的OB用戶界面。 -OB上的不同過濾器。 -OB接近警報。 -ADR高低線。 -通知服務(屏幕警報|推送通知)。 概括 訂單塊是一種市場行為,它指示從金融機構和銀行收取訂單。著名的金融機構和中央銀行帶動了外匯市場。因此,交易者必須知道他們在市場上正在做什麼。當市場建立訂單塊時,它會像發生大多數投資決策的範圍一樣移動。 訂單建立完成後,市場將朝著上升和縮小的方向發展。訂單大宗交易策略的關鍵術語是它包括機構交易者正在做的事情。由於它們是主要的價格驅動因素,因此包括機構交易在內的任何策略都可以。 您將在任何時間範圍內實時看到訂單塊,使用我們的控制面板,您將能夠在所選的歷史記錄週期內檢測常規,拒收和未大寫的訂單塊。 現在您可以接收到訂單塊接近警報,我們在MT4上顯示屏幕通知,並將通知推送到您的手機!
      Enigmera
      Ivan Stefanov
      5 (9)
      ENIGMERA: 市场的核心 重要提示:MQL5.com 演示版本在策略测试器中运行,可能无法完全反映 Enigmera 的功能。请查看描述、截图和视频了解详细信息。如有任何问题,请随时联系我! 该指标的代码已完全重写。版本 3.0 增加了新功能并修复了自指标发布以来积累的错误。 简介 这个指标和交易系统是金融市场的一种独特方法。ENIGMERA 使用分形周期来精确计算支撑和阻力水平。它展示了真实的积累阶段,并提供了方向和目标。无论是在趋势中还是在修正中,这个系统都能工作。 它是如何工作的 指标的大部分功能通过图表左侧的按钮控制,使得能够快速响应不同的市场情况。 按钮 ON/OFF – 显示或隐藏整个指标。 Channel – 激活支撑通道,显示可接受的偏差范围。 Dev1 (第一偏差) – 指示价格在支撑偏差内的波动,信号表示市场正在整合或积累力量。 Dev2 (第二偏差) – 显示价格在偏差之间的波动,表示趋势形成和方向。 Dev3 (第三偏差) – 表示趋势的显著加速和高波动性。 45deg (45度) – 显示市场的节奏和相对于 45 度线的运动稳定性。 Tgt1/2
      Meravith
      Ivan Stefanov
      5 (3)
      做市商工具。 Meravith 将: 分析所有时间周期并显示当前正在运行的趋势。 标注流动性区域(成交量均衡区),即多头与空头成交量相等的位置。 在您的图表上直接显示来自不同时间周期的所有流动性水平。 生成并展示基于文本的市场分析供您参考。 根据当前趋势计算目标位、支撑位和止损位。 计算交易的风险回报比。 根据您的账户余额计算仓位大小,并估算潜在利润。 在市场出现重大变化时,Meravith 还会发出警告。 指标的主要线条: 多头/空头成交量衰竭线 —— 作为目标位使用。 趋势线 —— 指示市场趋势方向。根据市场是多头还是空头而改变颜色,并作为趋势支撑。其颜色主要反映市场情绪。 成交量均衡线(Eq)—— Eq(Volume Equilibrium)是系统的核心。它表示买卖双方成交量的平衡点,即市场流动性所在位置。向上突破 Eq 表示多头倾向,向下突破 Eq 表示空头倾向。突破后,应等待回调——当价格回到相反趋势的偏离线或衰竭线附近时。 使用方法:只需将其添加到图表中。 Meravith 可以分析一切——趋势和回调。 趋势线与某条成交量衰竭线之间的距离越大,说明该方向的成交量越高。 趋
      Gold Channel XAUUSD
      Paulo Rocha
      5 (4)
      Gold Channel is a volatility-based indicator, developed with a specific timing algorithm for the XAUUSD pair, which consists of finding possible corrections in the market. This indicator shows two outer lines, an inner line (retracement line) and an arrow sign, where the theory of the channel is to help identify overbought and oversold conditions in the market. The market price will generally fall between the boundaries of the channel. If prices touch or move outside the channel it is a tradi
      本指标是实践实战交易完善的波浪自动分析的指标 !  案例... 注: 波浪分级用西方叫法不习惯,因受到缠论(缠中说禅)命名方式习惯的影响,我是将基础波浪命名为 笔 ,将二级波段命名为 段 ,同时具有趋势方向的段命名为 主趋段 (以后笔记中都是这种命名方式,先告知大家),但是算法上和缠论关系不大切勿混淆.反映的是本人分析盘面总结的 千变万化纷繁复杂的运行规律 . 对波段进行了标准化定义,不再是不同人不同的浪  ,    对人为干扰的画法进行了排除,在严格分析进场起到了关键的作用 . 使用这个指标,等于将交易界面提升美感,抛弃最原始的K线交易带你进入新的交易层次.如果不是为了交易,在宣传上也将使客户观感提升层次. 指标内容: 1. 基础波浪 (笔) : 首先我们找出了价格波动过程中的基础波动拐点,当然他的有序性低,为下一步的计算提供基础. 2. 二级波段( 段 ) :在基础波浪的基础上,通过算法分析得到层级更明显的二级波段,二级波段为波浪提供了分析基础 3. 波浪( 浪 ): 有着更清晰的趋势,更清晰直观的方向.分析一个波浪是否延续,需要看二级波段的形态,分析二级的构成,可以得出波浪
      Linear Trend Predictor — 结合切入点和方向支撑线的趋势指标。按照突破高/低价通道的原理运作。该指标算法过滤市场噪音,考虑波动性和市场动态。 指示器功能  使用平滑方法,显示市场趋势和开立买入或卖出订单的切入点。  适合通过分析任何时间范围内的图表来确定短期和长期的市场走势。  输入参数可适应任何市场和时间范围,允许交易者独立定制指标。  设定的指示信号不会消失,也不会重新绘制——它是在蜡烛收盘时确定的。  几种类型的通知以箭头组合。  该指标既可以作为独立的交易系统使用,也可以作为其他交易系统的补充。  可供任何经验水平的交易者使用。 主要参数 Volatility Smoothing Level - 指标的主要参数,允许您配置指标以实现舒适的操作。 它的数字范围是 1 到 100,从而增加了您可以获得更长趋势运动的平滑度。 通过少量的数字,您可以获得短期走势并快速退出交易。 使用指标进行交易的时刻:  红线和箭头表示下降趋势和卖出开盘信号。止损应根据前一个上分形来设置。  黄线和箭头表示上升趋势和买入开盘信号。止损应根据前一个下分形来设置。
      PZ Harmonacci Patterns
      PZ TRADING SLU
      3.17 (6)
      可以说,这是您可以为MetaTrader平台找到的最完整的谐波价格形成自动识别指标。它检测19种不同的模式,像您一样认真对待斐波那契投影,显示潜在的反转区域(PRZ),并找到合适的止损和获利水平。 [ 安装指南 | 更新指南 | 故障排除 | 常见问题 | 所有产品 ] 它检测19种不同的谐波价格形态 它绘制了主要,衍生和互补的斐波那契投影(PRZ) 它评估过去的价格走势并显示每个过去的形态 该指标分析其自身的质量和性能 它显示合适的止损和获利水平 它使用突破来表明合适的交易 它在图表上绘制所有样式比率 它实现了电子邮件/声音/视觉警报 受斯科特·M·卡尼(Scott M. Carney)的书的启发,该指标旨在满足最纯粹和最熟练的交易者的需求。但是,它采取了一种使交易更容易的方式:在向交易发出信号之前,它会等待Donchian朝正确方向突破,从而使交易信号非常可靠。 斐波那契投影与向量无关 它实现了电子邮件/声音/推送警报 它绘制了ABCD投影 重要提示: 为了符合 Scott M. Carney先生 的商标申诉,某些图案名称已重命名为不言自明的替代方式, Scott M.
      该指标旨在与艾略特波浪理论相结合,提供了两种不同的工作方式: 自动工作: 在此模式下,指标会自动检测图表上的所有五个动机波浪,并为您提供预测和潜在的逆转区域。它还可以提供警报和推送消息。这种自动功能简化了识别和分析艾略特波浪模式的过程。 手动工作: 此选项适用于喜欢手动方法的交易员,用于手动绘制九个不同等级的波浪。每个等级都可以在它们出现后通过调整图表上的绘制线条来单独定义。此功能简化了手动绘制波浪的过程,使其更加高效。需要注意的是,所有绘图数据将保存在平台的数据文件夹中,以备将来参考。 参数: Name: 指标名称。 Use_System_Visuals: 启用或禁用指标主题,以匹配交易平台的整体外观。 Explain_Comment: 允许启用或禁用波浪编号的解释性注释,有助于理解已识别的波浪。 Show_Last_Candle_Counter: 启用或禁用蜡烛计时器,提供有关当前蜡烛收盘的剩余时间的信息。 Candle_Counter_Color: 蜡烛计时器文本的颜色。 Basic_Wave_Color: 用于表示波浪的主要颜色。 Bullish_Wave_Color: 当检测
      RelicusRoad Pro
      Relicus LLC
      4.65 (107)
      RelicusRoad Pro: 量化市场操作系统 终身访问限时 70% 折扣 - 加入 2,000+ 交易员社区 为什么大多数交易者即使拥有“完美”指标也会失败? 因为他们在真空中交易 单一概念 。没有背景的信号是赌博。要持续获胜,您需要 共振 (CONFLUENCE) 。 RelicusRoad Pro 不是一个简单的箭头指标。它是一个完整的 量化市场生态系统 。它描绘价格运行的“公允价值之路”,区分市场噪音和真实的结构性突破。 停止猜测。开始用机构级“路”逻辑进行交易。 核心引擎:“Road” (路) 算法 系统的核心是 Road Algo ,一个实时适应市场条件的动态波动率通道。它投射出 安全线 (平衡) 和价格可能反转的 扩展水平 。 Simple Road: 典型市场的标准结构映射。 Smooth Road: 针对震荡盘整的降噪计算。 Breakout Road: 专为识别波动率扩张和爆发性走势而调整。 1. 算法动量与确认 我们的“剥头皮箭头”不只是简单的交叉。它们利用 高阶多项式逻辑 过滤噪音,确保信号与主周期一致。我们检测动量、价格行为和 Road 结构汇聚的精确入场
      Cyclic Impulse
      Vitalyi Belyh
      构建图表并识别周期性价格变动的技术指标。 可以在任何图表上工作。 几种类型的通知。 图表本身还有额外的箭头。 无需重新绘制历史记录,只需关闭蜡烛即可。 建议使用 M5 及以上的 TF。 易于使用和配置参数。 当使用 2 个具有不同参数的指标时,您可以单独使用它们,而无需其他指标。 有 2 个输入参数 周期性和信号持续时间 这两个参数处理图表结构的处理。 Cyclicity 调节反转周期的变化频率,平滑周期。 Signal duration 为最小数字,检测价格变动中的脉冲,最大长期趋势变动。    ---------------------------------------------------------------------------------------
      The Propfolio Master Suite is the ultimate all-in-one analytical workstation for professional traders. Combining the power of the Beat The Market Maker (BTMM) methodology, Smart Money Concepts (SND/Liquidity), and Advanced Volume Profile, this suite replaces multiple different indicators with one optimized engine. Monitor up to 14 pairs simultaneously from a single chart, instantly identify market cycles, and seamlessly map institutional footprints with the click of a button. The Command Center
      KuKl
      IGOR KIRIANEN
      The indicator is built on a non-standard Zig Zag, it draws accumulations after which if the price leaves this zone and a test of this zone occurs, then a sound signal is given and an arrow appears - after the test candle closes.The indicator does not redraw its signals, it is very easy to use, there are only three settings 1- this is the zig zag parameter 2- this is the minimum price exit from the zone 3- this is the maximum price exit from the zone. The lower the parameter for Zig Zag, the more
      作者的更多信息
      IQ Gold Gann Levels
      INTRAQUOTES
      5 (5)
      Presenting one-of-a-kind Gann Indicator for XAUUSD IQ Gold Gann Levels is a non-repainting, precision tool designed exclusively for XAUUSD intraday trading. It uses W.D. Gann’s square root method to plot real-time support and resistance levels, helping traders spot high-probability entries with confidence and clarity. William Delbert Gann (W.D. Gann) was an exceptional market analyst whose trading technique was based on a complex blend of mathematics, geometry, astrology, and ancient calculation
      IQ FX Gann Levels
      INTRAQUOTES
      5 (2)
      IQ FX Gann Levels a precision trading indicator based on W.D. Gann’s square root methods . It plots real-time, non-repainting support and resistance levels to help traders confidently spot intraday and scalping opportunities with high accuracy. William Delbert Gann (W.D. Gann) was an exceptional market analyst, whose trading technique was based on a complex blend of mathematics, geometry, astrology, and ancient mathematics which proved to be extremely accurate. Setup & Guide:  Download  MT5 Ver
      Hydra Trend Rider
      INTRAQUOTES
      5 (4)
      Hydra Trend Rider   is a premium multi-timeframe dashboard that instantly reveals the market trend across 9 timeframes (M1 to Monthly). Using a highly accurate, non-repainting AI-Powered algorithm, it helps you trade in the direction of the dominant market momentum. Quick Links: User Manual & Guide: Here MT5 Version: Here MQL5 Channel - For daily market insights & updates: Join Here Disclaimer: Read the full product description before purchasing. Due to regulatory and compliance restrictions
      Hydra Trend Rider   is a premium multi-timeframe dashboard that instantly reveals the market trend across 9 timeframes (M1 to Monthly). Using a highly accurate, non-repainting AI-Powered algorithm, it helps you trade in the direction of the dominant market momentum. Quick Links: User Manual & Guide: Here MT4 Version: Here MQL5 Channel - For daily market insights & updates: Join Here Disclaimer: Read the full product description before purchasing. Due to regulatory and compliance restrictions,
      Presenting one-of-a-kind Gann Indicator for XAUUSD IQ Gold Gann Levels is a non-repainting, precision tool designed exclusively for XAUUSD intraday trading. It uses W.D. Gann’s square root method to plot real-time support and resistance levels, helping traders spot high-probability entries with confidence and clarity. William Delbert Gann (W.D. Gann) was an exceptional market analyst whose trading technique was based on a complex blend of mathematics, geometry, astrology, and ancient calculation
      First time on MetaTrader, introducing IQ Star Lines - an original Vedic Astrology based indicator. "Millionaires don't use astrology, billionaires do" . - J.P. Morgan, Legendary American financier and banker. Welcome to  the new and updated  IQ Star Lines , the ultimate fusion of ancient planetary harmonic cycles and modern quantitative trading. published for the   first time on Metatrader. This is an indicator built by the developer, who has spent almost 2 decades trading while studying Vedic
      IQ FX Strength  answers the single most important question in trading: "Who is truly driving the market right now?" Designed with a stunning Hybrid UI, this tool separates true trend moves from market noise, allowing you to catch "Explosive" moves before the crowd sees them. System Requirement: For higher accurate signal and optimal, smoother performance of this indicator without any lag, a good CPU (with   RAM of  atleast 8GB or above) and fast internet connection is highly recommended. IQ FX
      First time on MetaTrader, introducing IQ Star Lines - an original Vedic Astrology based indicator. "Millionaires don't use astrology, billionaires do" . - J.P. Morgan, Legendary American financier and banker. Welcome to  the new and updated  IQ Star Lines , the ultimate fusion of ancient planetary harmonic cycles and modern quantitative trading. published for the   first time on Metatrader. This is an indicator built by the developer, who has spent almost 2 decades trading while studying Vedic
      Volatility Master for MetaTrader is a real-time dashboard tool that scans up to  50 symbols  to identify high-volatility , trending markets instantly. With bullish/bearish signals, customizable alerts, and a user-friendly interface, it helps you avoid range-bound conditions and focus on high-probability trades. Clarity leads to confidence. Trade confidently and protect your capital effectively with this powerful dashboard. Quick Links: User Manual & Guide: Here MT4 Version: Here MQL5 Channel
      IMPORTANT NOTE:  This indicator is designed exclusively for advanced traders who already possess sufficient experience and a deep understanding of standard technical indicators (such as Bollinger Bands, MACD, Ichimoku, etc.). This tool will not teach you how to trade; rather, it is a highly advanced confluence matrix built so that experienced traders can configure their own custom indicator alerts, track market conditions at a glance, and optimize their existing trading systems. Overview The SFX
      FX Correlation Matrix is a powerful multi-timeframe dashboard that helps traders analyze real-time currency correlations of up to 28 symbols at a glance. With customizable settings, sleek design, and manual symbol selection option, it enhances trade accuracy, reduces risk, and identifies profitable correlation-based opportunities. Setup & Guide:  Download   MT5 Version here. Follow our MQL5 channel for daily market insights, chart, indicator updates and offers!  Join here. Read the product des
      IQ Chart Cleaner – Get a Fresh Chart in Seconds. A cluttered chart can make trading stressful and confusing. Between dozens of old indicators, leftover lines, arrows, shapes, and notes, it’s easy to lose focus on what really matters—your trades. That’s where IQ Chart Cleaner comes in. With a single click, IQ Chart Cleaner gives you a fresh, distraction-free chart so you can analyze the markets with clarity and confidence. Get the MT5 Version here . Key Benefits Total Cleaning Power – Instantly
      IQ Trade Status – A Professional Trade Panel to track all your LIVE TRADES in a single dashboard. IQ Trade Status is not just a trade panel; it is a professional dashboard designed for MetaTrader. It replaces the default Terminal window with a clean, structured, and actionable overview of your account and open trades. The dashboard is designed to help you instantly answer three critical questions: How much have I made today? How much will I lose if all my trades go wrong? Is my account over-lev
      The Hydra Multi Trend Dashboard is an AI-Powered excellent market scanning tool designed for MetaTrader 4 and MetaTrader 5. It monitors up to 45 currency pairs or assets simultaneously across all 9 standard timeframes (M1 to Monthly). Using a proprietary Special Trend Formula, the dashboard filters out market noise and provides clear, visual Bullish or Bearish signals, allowing traders to identify trend alignments at a glance without switching charts. Quick Links:  MT5 Version:   Here MQL5 Ch
      FX Correlation Matrix is a powerful multi-timeframe dashboard that helps traders analyze real-time currency correlations of up to 28 symbols at a glance. With customizable settings, sleek design, and manual symbol selection option, it enhances trade accuracy, reduces risk, and identifies profitable correlation-based opportunities. Setup & Guide:  Download   MT4 Version here. Follow our MQL5 channel for daily market insights, chart, indicator updates and offers!  Join here. Read the product des
      IQ FX Gann Levels a precision trading indicator based on W.D. Gann’s square root methods . It plots real-time, non-repainting support and resistance levels to help traders confidently spot intraday and scalping opportunities with high accuracy. William Delbert Gann (W.D. Gann) was an exceptional market analyst, whose trading technique was based on a complex blend of mathematics, geometry, astrology, and ancient mathematics which proved to be extremely accurate. Setup & Guide:  Download  MT4 Ver
      Get a clean chart in an instant.  This script is extremely helpful in removing not only all the graphical objects from the chart but also all the  indicators from the chart.  Get the MT4 Version here . Features: Confirmation Dialog : Asks for confirmation before cleaning the chart. Complete Cleaning: Removes all graphical objects (lines, arrows, shapes, etc.) Removes all indicators from all chart windows (main and subwindows) Logging: Prints information about the cleaning process in the Expert
      IQ Trade Status – A Professional Trade Panel to track all your LIVE TRADES in a single dashboard. IQ Trade Status is not just a trade panel; it is a professional dashboard designed for MetaTrader. It replaces the default Terminal window with a clean, structured, and actionable overview of your account and open trades. The dashboard is designed to help you instantly answer three critical questions: How much have I made today? How much will I lose if all my trades go wrong? Is my account over-lev
      The Hydra Multi Trend Dashboard is an AI-Powered excellent market scanning tool designed for MetaTrader 4 and MetaTrader 5. It monitors up to 45 currency pairs or assets simultaneously across all 9 standard timeframes (M1 to Monthly). Using a proprietary Special Trend Formula, the dashboard filters out market noise and provides clear, visual Bullish or Bearish signals, allowing traders to identify trend alignments at a glance without switching charts. Quick Links:  MT4 Version: Here MQL5 Chan
      IQ FX Strength  answers the single most important question in trading: "Who is truly driving the market right now?" Designed with a stunning Hybrid UI, this tool separates true trend moves from market noise, allowing you to catch "Explosive" moves before the crowd sees them. System Requirement: For higher accurate signal and optimal, smoother performance of this indicator without any lag, a good CPU (with   RAM of  atleast 8GB or above) and fast internet connection is highly recommended. IQ FX
      筛选:
      Ted NO FX
      1833
      Ted NO FX 2026.07.30 14:41 
       

      I contacted the developer with what I believed was a reasonable feature request, but the response was disappointing. Instead of considering the feedback, they simply stated that they do not implement individual feature requests and only focus on changes that benefit the majority of users. They dismissed my suggestion without any indication that it would even be evaluated. They also insisted that the existing settings are “more than sufficient” and suggested I should just use a higher timeframe if I want fewer alerts. This completely ignores the fact that different traders have different strategies and risk tolerances. Offering users more customization would improve flexibility without affecting anyone who prefers the default settings. What frustrated me most was the lack of willingness to listen to customer feedback. Rather than engaging in a constructive discussion, they essentially told me that their current approach is good enough and that I should adapt to it. The indicator may work for some people, but the customer support experience left me feeling that user feedback is not valued. I hope they become more open to reasonable suggestions in the future. I dont recommend to buys this Indicator at all, Author seems not listening and doesn’t want individual updates. Never heard that from an author before. But okey…

      INTRAQUOTES
      11358
      来自开发人员的回复 Somsri Sarkar 2026.07.30 17:27
      Thank you for your review, Ted. We are sorry that you feel this way, but your review does not reflect the full context of our conversation. You have been using our indicator for almost a year. During that time, we continuously improved the product and released updates that benefited all users. One of those updates included increasing the volatility threshold to 50% based on your previous feedback, despite the original request extending beyond the indicator's intended scope. Unfortunately, despite benefiting from that update, we never received any acknowledgement or positive feedback from you. Your latest request was to increase the threshold to 100% and even 200%. This is not a bug or product defect; it is a request to change how the indicator is designed. Those volatility levels are generally relevant only during major events or news releases and fall outside the intended purpose of the indicator. A feature request should not be confused with a product defect. Declining a request that falls outside the intended scope of the indicator does not mean the product is faulty. Since you mentioned that you are primarily a swing trader, we suggested a practical solution by using the 4-hour or Daily timeframe with the existing 50% volatility threshold. This naturally filters market noise while still identifying meaningful opportunities. Rather than considering this solution, your concern remained solely focused on adding new threshold values. Increasing the threshold to 100% or 200% would make alerts extremely rare and would not improve the indicator for normal market conditions. Our parameters are chosen after extensive testing across different market conditions, symbols, and timeframes to provide practical value for the majority of traders, not simply because additional settings are technically possible. You also stated that we are not open to constructive discussion. However, over the past year, we responded to all of your questions whenever they were raised and provided practical suggestions whenever possible. You did not provide screenshots or reproducible examples for the issues you mentioned, nor did you share any feedback after trying the solutions we suggested. Constructive discussion requires engagement from both parties. Our development policy has always been consistent: we prioritise improvements and bug fixes that provide value to the majority of users. While we genuinely value feedback, we cannot redesign a product around the preferences of a single user when those requests fall outside the indicator's intended scope. This approach has allowed us to maintain a stable, focused indicator that many traders use successfully. It is therefore disappointing that, after nearly a year of using the product, declining a single request outside the product's intended scope resulted in a one-star review. More disappointing still, after our final professional response, you chose to reply with abusive language instead of continuing the discussion respectfully. We respect that different traders have different preferences. However, if your trading workflow requires functionality beyond the scope of this product, a custom-built indicator would be the appropriate solution rather than expecting every commercial product to be adapted to one individual's preferences. We remain committed to improving our products where changes provide genuine value to the wider trading community, and we thank the many traders who continue to support our work with their constructive feedback.
      cam028
      6492
      cam028 2025.10.08 07:42 
       

      great product

      INTRAQUOTES
      11358
      来自开发人员的回复 Somsri Sarkar 2025.10.10 17:59
      Thank you so much. We are glad that you are enjoying this indicator. Happy Trading.
      MP_mpap
      633
      MP_mpap 2025.09.08 13:10 
       

      ⭐️⭐️⭐️⭐️⭐️ The indicator is excellent! I would personally prefer it to offer more adjustable parameters, especially for those who want the signals to appear with more or less delay — and to include filters such as RSI, MACD, or support/resistance levels. The developers are truly outstanding: polite, responsive, and always open to new ideas. Overall, it's a great tool — and if you're working with an MTF strategy, it can definitely help you catch solid entries. Highly recommended without reservation!

      11/11/2025 Update: With the new additions, it has become even more focused and clearly better than before. Great job once again!

      INTRAQUOTES
      11358
      来自开发人员的回复 Somsri Sarkar 2025.09.08 13:30
      Thank you so much for your kind words and this wonderful review. Such honest feedback always motivates us to keep improving. Wish you nothing but success in life.
      sweethomeboy2
      604
      sweethomeboy2 2025.06.05 20:33 
       

      This indicator is incredibly helpful. You don’t need to watch the screen all day—it tells you exactly when to start trading. You can focus on other things in life without worrying about missing out. It saves both time and money

      INTRAQUOTES
      11358
      来自开发人员的回复 Somsri Sarkar 2025.06.06 02:32
      Thank you so much for sharing your experience with everyone! It is a true pleasure for us to know that our indicators proved to be incredibly helpful! Thank you for trusting us and using our indicators. We wish you the greatest success ever!
      Danny Tsang
      288
      Danny Tsang 2025.04.07 16:50 
       

      I've been using this indicator for a week, this is a great tool that give your more insight for your trade decisions. Nice work.

      INTRAQUOTES
      11358
      来自开发人员的回复 Somsri Sarkar 2025.04.10 04:25
      Hello Danny, thank you for your rating. Happy Trading
      Phanny Ann
      747
      Phanny Ann 2025.02.13 06:09 
       

      This is a great tool and a must have in your trading arsenal. It's great for beginners and experts. 5 stars!

      INTRAQUOTES
      11358
      来自开发人员的回复 Somsri Sarkar 2025.02.13 07:29
      Thank you so much for the kind words and the 5-star review! I'm thrilled to hear the indicator is helpful for you. Wishing you continued success in your trading!
      回复评论