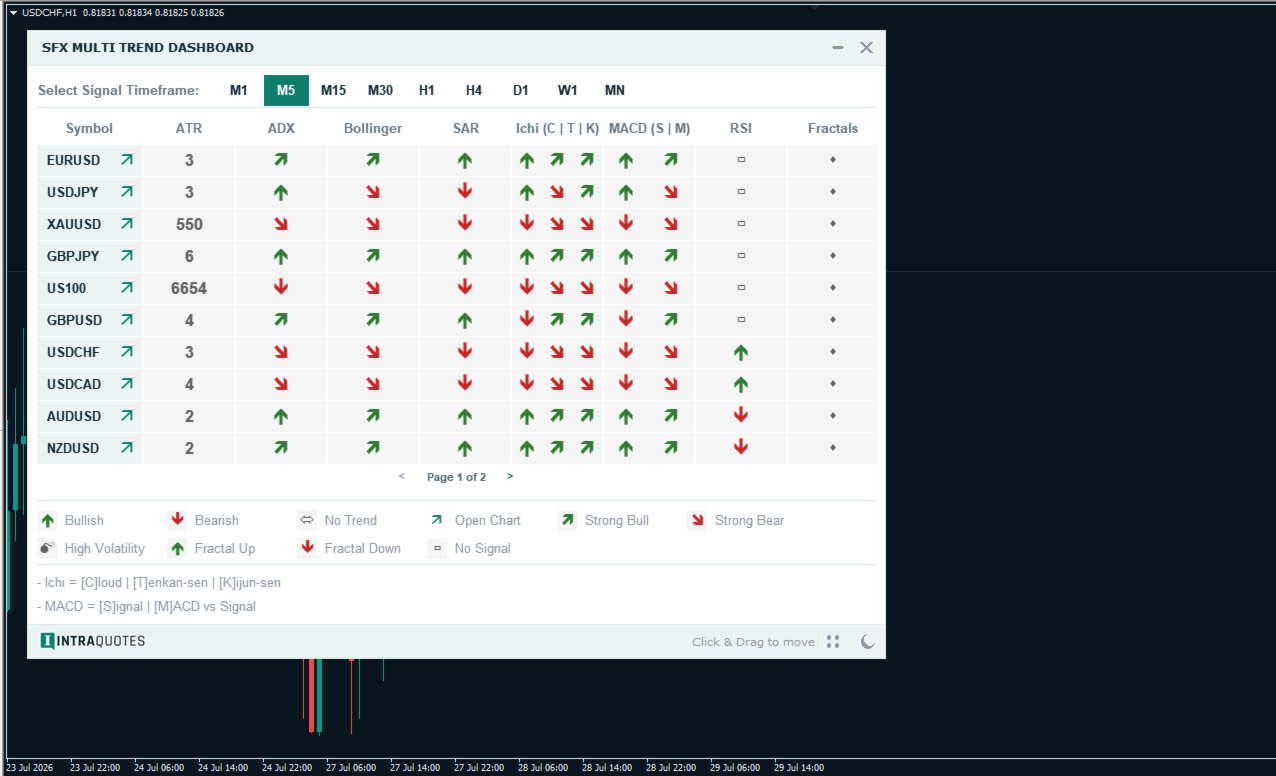
SFX Multi Trend Dashboard

IMPORTANT NOTE: This indicator is designed exclusively for advanced traders who already possess sufficient experience and a deep understanding of standard technical indicators (such as Bollinger Bands, MACD, Ichimoku, etc.). This tool will not teach you how to trade; rather, it is a highly advanced confluence matrix built so that experienced traders can configure their own custom indicator alerts, track market conditions at a glance, and optimize their existing trading systems.

Read the product description carefully before purchasing the product. 

MQL5 Channel - For daily market insights, tips, & updates: Join here.

Disclaimer:

Products are sold strictly AS-IS. We provide lifetime bug fixes, but we do not accept custom modification requests. Please utilize the backtest feature or 1-month rental to ensure this tool fits your exact manual trading style before purchasing.

  • Read the full product description before purchasing.
  • Due to regulatory and compliance restrictions, our service, including personalized technical support and one-on-one troubleshooting, is unavailable in India, Pakistan, and Bangladesh. Products purchased from these regions are ineligible for these services after purchase. For setup, operation, and troubleshooting guidance, please refer to the user manual.
  • Intraquotes products are sold exclusively on MQL5. We never contact users privately, sell off-platform, or provide personal trading advice.

Usage Notes:

The indicator supports one dashboard per MetaTrader terminal and displays trend data for up to 20 symbols, with 10 symbols per page.

A built-in pagination system lets you quickly navigate between all monitored symbols from a single dashboard. This keeps the interface compact and organized while eliminating the need to run multiple dashboard instances.

Overview

The SFX Multi Trend Dashboard is a state-of-the-art, multi-symbol, multi-indicator panel that allows you to monitor up to 12 different technical indicators across various timeframes and instruments, all from a single chart. Whether you are looking for trend alignment, momentum shifts, volatility breakouts, or divergence, this dashboard aggregates the data into a clean, modern, and highly responsive graphical interface.

Key Features

  • 12 Dynamic Slots: Choose from 17 built-in technical indicators to display on the dashboard. The panel automatically resizes its width depending on how many indicators you activate.
  • One-Click Timeframe Tabs: Instantly switch the dashboard's data calculation timeframe using the sleek, horizontal timeframe tabs (M1 through MN) located at the top of the panel.
  • Smart Dynamic Legend: No more guessing what symbols mean. The legend at the bottom of the dashboard automatically updates to explain the icons for the specific indicators you have selected (e.g., displaying the complex Ichimoku cloud breakdown only if Ichimoku is active).
  • Click-to-Chart: Click on any symbol row inside the dashboard, and your active chart will instantly switch to that instrument.
  • Dark & Light Modes: Seamlessly toggle between premium Dark and Light themes via the sun/moon icon to match your charting environment.

User Inputs & How to Use Them

1. Dashboard Position

  • Adjust X & Y Axis numeric values to move the dashboard left/right or up/down on your chart.

2. Indicator Selection (Up to 12)

  • Use the dropdowns to assign an indicator to each column. You can choose from ATR, ADX, Alligator, BBands, SAR, Ichimoku, MACD, RSI, Momentum, Stochastics, Envelopes, Breakouts, Fractals, MA Cross, CCI, RSI Divergence, and Spread. If you don't need all 12 columns, simply set the unused slots to "None" and the dashboard will neatly shrink.

3. Symbol Settings

  • Symbol Source: Choose whether to automatically pull symbols from your MetaTrader "Market Watch" window, or define a specific list manually.
  • Manual Symbols: If "Manual" is selected above, type your desired symbols here, separated by commas (e.g., EURUSD,GBPUSD,XAUUSD). Supports up to 20 symbols.

4. Alert Settings

  • Alert 1 & Alert 2: Select specific conditions to trigger alerts (e.g., "MACD Signal Bullish" or "Price Above Alligator"). If you only want one condition, set Alert 1 and leave Alert 2 as "None". If you want a combined signal (confluence), set both Alert 1 and Alert 2. The dashboard will only alert you when both conditions are met simultaneously.
  • Email / Push: Enable these to receive notifications directly to your phone or inbox.
  • Alert Timeframe: Select the specific timeframe the dashboard should monitor for these alerts.

5. Indicator Parameters

  • Scroll through this extensive section to fine-tune the mathematical inputs (Periods, Shifts, Applied Prices, Deviations) for every single indicator on the dashboard. Your custom settings here dictate the signals shown on the panel.

Complete List of Available Alert Conditions

The SFX Multi Trend Dashboard features a powerful dual-alert engine. You can select a Primary Alert (Alert 1) and a Secondary Alert (Alert 2) simultaneously to trigger notifications only when both custom conditions align (Confluence Alert).

Alligator Alerts

Price Below Alligator
Price Above Alligator
Price Inside Alligator

Bollinger Bands Alerts

Bollinger Bands Bullish Breakout
Bollinger Bands Bearish Breakout
Price Bullish (Above Main Band)
Price Bearish (Below Main Band)

Parabolic SAR Alerts

Parabolic SAR Bullish
Parabolic SAR Bearish

Ichimoku Kinko Hyo Alerts

Price Above Cloud
Price Below Cloud
Price Inside Cloud
Price Above Tenkan-Sen
Price Below Tenkan-Sen
Price Equal to Tenkan-Sen
Price Above Kijun-Sen
Price Below Kijun-Sen
Price Equal to Kijun-Sen

MACD Alerts

MACD Signal Line Bullish (> 0)
MACD Signal Line Bearish (< 0)
MACD Main Line Above Signal Line
MACD Main Line Below Signal Line
MACD Main Line Equal to Signal Line

RSI & Divergence Alerts

RSI Overbought (>= 70)
RSI Oversold (<= 30)
RSI Classic Bullish Divergence
RSI Classic Bearish Divergence
RSI Hidden Bullish Divergence
RSI Hidden Bearish Divergence

Moving Average Cross & Price Breakout Alerts

Moving Average Bullish Cross (Fast MA > Slow MA)
Moving Average Bearish Cross (Fast MA < Slow MA)
Breaking Bar High (Breakout above selected timeframe High)
Breaking Bar Low (Breakout below selected timeframe Low)

ADX Trend Strength Alerts

ADX Bullish
ADX Bearish
ADX Strong Bullish (Main Line >= 70)
ADX Strong Bearish (Main Line >= 70)

Stochastic & Momentum Alerts

Stochastic Overbought (>= 80)
Stochastic Oversold (<= 20)
Momentum Price Changes Above 100%
Momentum Price Changes Below 100%

Envelopes Alerts

Price Above Upper Envelope Band
Price Below Lower Envelope Band
Price Inside Envelope Bands

Fractals & CCI Alerts

Fractal Up Formed
Fractal Down Formed
CCI greater than 100 (Bullish Momentum)
CCI lesser than 0 (Bearish Momentum)
CCI Between 0 and 100 (Neutral Range)

Frequently Asked Questions (FAQ)

Q: Can I open multiple dashboards on the same MetaTrader terminal?

A: No. To ensure maximum terminal performance and eliminate visual clutter, the system is strictly limited to 1 dashboard per MT4 terminal. We designed the 12 dynamic indicator slots and the 20-symbol pagination system specifically so you will never need more than one dashboard.

Q: How do I change the timeframe of the dashboard signals?

A: Simply click the horizontal timeframe tabs (M1, M5, H1, etc.) located at the top of the dashboard inside the chart. Your selection is automatically saved, so if you switch charts, the dashboard will remember your last viewed timeframe.

Q: The dashboard is taking up too much space on my screen. Can I make it smaller?

A: Yes! The dashboard is completely dynamic. If you have all 12 indicator slots filled, it will be wide. To make it smaller, go into the indicator inputs and change the slots you aren't actively using to "None" (X18). The dashboard will automatically shrink its width.

Q: Why are there letters like (C , T , K) next to Ichimoku?

A: Complex indicators are split into segmented cells to give you detailed data. For Ichimoku, the cell is split into three arrows: [C]loud, [T]enkan-sen, and [K]ijun-sen. Check the dynamic legend at the bottom of the dashboard for a full breakdown of what each segment means.

Q: How do I switch my chart to the pair I see on the dashboard?

A: Click anywhere on the row of the symbol you wish to view. The dashboard will instantly change your current active chart to that symbol while maintaining your chosen timeframe.

Prodotti consigliati
VR Cub
Vladimir Pastushak
VR Cub è un indicatore per ottenere punti di ingresso di alta qualità. L'indicatore è stato sviluppato per facilitare i calcoli matematici e semplificare la ricerca dei punti di ingresso in una posizione. La strategia di trading per la quale è stato scritto l'indicatore ha dimostrato la sua efficacia per molti anni. La semplicità della strategia di trading è il suo grande vantaggio, che consente anche ai trader alle prime armi di commerciare con successo con essa. VR Cub calcola i punti di apert
Trendiness Index
Libertas LLC
5 (3)
"The trend is your friend" is one of the best known sayings in investing, because capturing large trendy price movements can be extremely profitable. However, trading with the trend is often easier said than done, because many indicators are based on price reversals not trends. These aren't very effective at identifying trendy periods, or predicting whether trends will continue. We developed the Trendiness Index to help address this problem by indicating the strength and direction of price trend
Quantum Falcon Signal Free is a smart visual trading indicator for MetaTrader 4 designed for Forex and Gold traders. The indicator combines: • Trend analysis • RSI momentum confirmation • MACD momentum filtering • ATR volatility filtering • Higher timeframe confirmation • Smart exit signal detection Main Features: • Smart Buy and Sell signals • Exit Buy / Exit Sell alerts • Real-time dashboard on chart • Professional candle arrows • Multi-timeframe trend confirmation • ATR market volatility filt
FREE
Smoothed Heiken Ashi with AC/AO Zones – Professional Trading Clarity Transform your Heiken Ashi analysis with intelligent smoothing that eliminates noise while preserving actionable signals. What Makes This Different? This isn't just another Heiken Ashi indicator. We've engineered a sophisticated smoothing engine that works with the Accelerator (AC) and Awesome Oscillator (AO) zone logic to give you cleaner entries and exits without sacrificing responsiveness. Four Smoothing Methods at Your Comm
The main idea of this indicator is rates analysis and prediction by Fourier transform. Indicator decomposes exchange rates into main harmonics and calculates their product in future. You may use the indicator as a standalone product, but for better prediction accuracy there is another related indicator - FreqoMaster - which uses FreqoMeterForecast as a backend engine and combines several instances of FreqoMeterForecast for different frequency bands. Parameters: iPeriod - number of bars in the ma
Forex Gump
Andrey Kozak
2.4 (5)
Forex Gump is a fully finished semi-automatic trading system. In the form of arrows, signals are displayed on the screen for opening and closing deals. All you need is to follow the instructions of the indicator. When the indicator shows a blue arrow, you need to open a buy order. When the indicator shows a red arrow, you need to open a sell order. Close orders when the indicator draws a yellow cross. In order to get the most effective result, we recommend using the timeframes H1, H4, D1. There
PipFinite Trend PRO
Karlo Wilson Vendiola
4.88 (2252)
Breakthrough Solution For Trend Trading And Filtering With All Important Features Built Inside One Tool! Trend PRO's smart algorithm detects the trend, filters out market noise and gives entry signals with exit levels. The new features with enhanced rules for statistical calculation improved the overall performance of this indicator. Important Information Revealed Maximize the potential of Trend Pro, please visit www.mql5.com/en/blogs/post/713938 The Powerful Expert Advisor Version Automatin
MACD Display is a MACD disaplay and cross monitoring indicator,which can works on 6 timeframe at same time. Indicator advantage: 1. Deviation from the point can be drawn on the main picture and indicator drawing. It is convenient to observe and can be hidden or displayed by parameter setting. 2. Deviation from the entry point is clearly indicated by the arrow in the drawing. 3. Cross-cycle monitoring can simultaneously monitor the MACD deviation and the golden dead fork of the six-cycle framewor
Indicatore Smart FVG MT4 – Rilevamento Avanzato del Fair Value Gap per MetaTrader 4 L'indicatore Smart FVG per MetaTrader 4 offre rilevamento, monitoraggio e avvisi professionali dei Fair Value Gap (FVG) direttamente sui tuoi grafici. Combina un filtro basato sull'ATR con una logica sensibile alla struttura per eliminare il rumore, adattarsi alla liquidità e mantenere solo gli squilibri più rilevanti per decisioni operative precise. Vantaggi principali Rilevamento accurato degli FVG: individua
FREE
Auto Fibo Pro m
DMITRII GRIDASOV
Indicatore "Auto FIBO Pro" Crypto_Forex: è un ottimo strumento ausiliario nel trading! - L'indicatore calcola e posiziona automaticamente sul grafico i livelli di Fibo e le linee di tendenza locali (colore rosso). - I livelli di Fibonacci indicano le aree chiave in cui il prezzo può invertirsi. - I livelli più importanti sono 23,6%, 38,2%, 50% e 61,8%. - Puoi usarlo per lo scalping di inversione o per il trading di zone grid. - Ci sono molte opportunità per migliorare il tuo sistema attuale usa
Infinity Trend Pro
Yaroslav Varankin
1 (1)
This is a trend indicator without redrawing Developed instead of the binary options strategy (by the color of the Martingale candlestick) Also works well in forex trading When to open trades (binary options) A signal will appear in the place with a candle signaling the current candle It is recommended to open a deal for one candle of the current timeframe M1 and M5 When a blue dot appears, open a deal up When a red dot appears, open a trade down. How to open trades on Forex. When a signal is rec
SX Supply Demand Zones accurately identifies and draws high-probability Supply and Demand zones using a sophisticated algorithm. Unlike traditional indicators that clutter your chart, this indicator is designed with a focus on performance and a clean user experience. New Unique Feature: Interactive Legend System What truly sets this indicator apart from everything else is the Interactive Control Legend. You have a professional dashboard directly on your chart that allows you to: Show/Hide: Ins
FREE
Daily Candle Predictor è un indicatore che prevede il prezzo di chiusura di una candela. L'indicatore è destinato principalmente all'uso sui grafici D1. Questo indicatore è adatto sia per il trading forex tradizionale che per il trading di opzioni binarie. L'indicatore può essere utilizzato come sistema di trading autonomo o può fungere da aggiunta al sistema di trading esistente. Questo indicatore analizza la candela corrente, calcolando alcuni fattori di forza all'interno del corpo della cande
ProEngulfing
Ashkan Hazegh Nikrou
4.5 (2)
Presentazione di ProEngulfing - Il tuo Indicatore di Modelli Engulf Professionale per MT4 Sblocca il potere della precisione con ProEngulfing, un indicatore all'avanguardia progettato per identificare e evidenziare modelli engulf qualificati nel mercato del forex. Sviluppato per MetaTrader 4, ProEngulfing offre un approccio meticoloso al riconoscimento dei modelli engulf, garantendo che ricevi solo i segnali più affidabili per le tue decisioni di trading. Come funziona ProEngulfing: ProEngulfin
Riko Trend
Nadiya Mirosh
The Riko Trend indicator is a revolutionary trend trading and filtering solution with all the important features of a trend tool built into one tool! The Riko Trend indicator is good for any trader, suitable for any trader for both forex and binary options. You don’t need to configure anything, everything is perfected by time and experience, it works great during a flat and in a trend. The Riko Trend indicator is a technical analysis tool for financial markets that reflects the current price f
"Dynamic Trading Oscillator" - è un indicatore Crypto_Forex personalizzato avanzato - uno strumento di trading efficiente per MT4! - Nuova generazione di oscillatori - guarda le immagini per vedere come usarlo. - Il Dynamic Trading Oscillator ha zone di ipervenduto/ipercomprato adattive. - L'oscillatore è uno strumento ausiliario per trovare punti di ingresso esatti dalle aree dinamiche di ipervenduto/ipercomprato. - Valori di ipervenduto: sotto la linea blu, valori di ipercomprato: sopra la li
The BLACK ZONE PREMIUM INDICATOR is a powerful all-in-one trading assistant built to bring clarity, precision, and consistency to forex trading. It combines multi-timeframe market structure, trade forecasting, risk management, and live monitoring into one professional-grade tool. From planning trades to managing them with discipline, this indicator equips traders with everything they need to make informed and confident decisions. If you’ve been looking for a professional solution that simplifies
The indicator allows you to trade binary options. The recommended time frame is М1 and the expiration time is 1,2,3 minutes. The indicator suitable for auto and manual trading. A possible signal is specified as a arrows above/under a candle. You should wait until the candle closes! Arrows are not re-painted Trade sessions: TOKYO section (Half-end) Currency pairs: USD/JPY Working time frame: M1 Expiration time: 1,2,3 minutes. The indicator also shows good results when using the martingale strateg
FREE
Price Magnet — Price Density and Attraction Levels Indicator Price Magnet is a professional analytical tool designed to identify key support and resistance levels based on statistical Price Density. The indicator analyzes a specified historical period and detects price levels where the market spent the most time. These zones act as “magnets,” attracting price action or forming a structural base for potential reversals. Unlike traditional Volume Profile tools, Price Magnet focuses on price-time d
Power Renko MT4
Pierce Vallieres
Power Renko is an indicator which plots Renko bricks underneath the chart using a histogram. You can select the brick size and the timeframe of the Renko bricks as well as whether or not to use the close price or the high/low price of the candles. Renko bricks are based on price alone, not time, therefor the Renko bricks will not be aligned with the chart's time. They are extremely useful for trend trading and many different strategies can be formed from them. Buffers are provided allowing you t
Pirate
Anatoliy Lukanin
3.9 (20)
Deposit :   from 100 deposit units Trading pairs: I recommend currency pairs: EURAUD, CHFJPY, EURCHF, EURGBP, AUDCHF, CADCHF, USDCHF. Trading period :  Any Account: You should use ECN-ECN.Pro accounts with five-digit quotes with a moderate size (spread). Parameters: USING - Choice, trading risk or fixed lot RISK/LOT - Lot Risk Value RESTORING_THE_BALANCE - Restoring balance* HOW_THE_RESET_WINDOW - Reset the Global Variable TAKE_PROFIT - Set profit STOP_LOSS - Set loss COUNT_BUY - The number of s
Una delle sequenze numeriche è chiamata "Sequenza di incendi boschivi". È stata riconosciuta come una delle nuove sequenze più belle. La sua caratteristica principale è che questa sequenza evita andamenti lineari, anche quelli più brevi. È questa proprietà che ha costituito la base di questo indicatore. Quando si analizza una serie temporale finanziaria, questo indicatore cerca di rifiutare tutte le possibili opzioni di tendenza. E solo se fallisce, riconosce la presenza di una tendenza e dà il
Based on MACD indicator waves with standard parameters Applies Fibonacci levels to the last two MACD waves, positive and negative respectively, if at the moment the MACD indicator runs out of negative Wave - the color is green, if at the moment the MACD indicator runs out of positive Wave - the color is red. The Wave termination criterion is two ticks with a different MACD sign. Applies trend lines on the last four MACD Waves. Works well with the expert Figures MACD   https://www.mql5.com/ru/mar
Phase Analytics Pro: Advanced Cyclic Market Analyzer Phase Analytics Pro is a sophisticated technical tool designed for traders who prioritize mathematical precision over lag-heavy traditional indicators. Based on the principles of digital signal processing, this indicator decomposes price action into phase and quadrature components to identify the dominant market cycle. How it works: The algorithm calculates the instantaneous phase of the market, allowing it to distinguish between trending and
Signaline
Ahmet Metin Yilmaz
SIGNALINE INDICATOR This indicator for all pairs and all timeframes I have just completed the M5 timeframe for deep optimization EURJPY yet. EURJPY M5 Optimization ( TP=150 , SL=130 , IndicatorPeriod=6 , Mov1=22 , Mov2=48 ) (*)Added 20.05.2019 You can find this signal page below https://www.mql5.com/en/signals/583477 Other optimizasyon results will be added on this signalpage. Input Parameters: IndicatorPeriod: Default is 8. Mov1               : Default is 21. Mov2               : Default is 48.
TMA AI Bands
Monique Ellen Miranda Dos Santos
L'indicatore TMA AI Bands si basa sulla Media Mobile Triangolare (TMA) con bande superiore e inferiore dinamiche e frecce chiare di acquisto/vendita tracciate direttamente sul grafico. Integra un'IA per l'ottimizzazione adattiva e garantisce l'assenza di ridisegno, fornendo segnali precisi di inversione quando il prezzo tocca le bande. * Coppie: funziona con tutte le coppie di valute * Timeframe consigliati: D1 / W1 / MN * Variabili esterne configurabili:   * TimeFrame – periodo di calcolo
HMA Trend Professional MT4
Pavel Zamoshnikov
4.57 (7)
Improved version of the free HMA Trend indicator (for MetaTrader 4) with statistical analysis. HMA Trend is a trend indicator based on the Hull Moving Average (HMA) with two periods. HMA with a slow period identifies the trend, while HMA with a fast period determines the short-term movements and signals in the trend direction. The main differences from the free version: Ability to predict the probability of a trend reversal using analysis of history data. Plotting statistical charts for analyzi
Super Reversal Pattern
Parfait Mujinga Ndalika
Super Reversal Pattern Indicator Unlock the power of advanced pattern recognition with our Super Reversal Pattern Indicator. Designed for traders seeking precision and reliability, this indicator identifies one of the most effective reversal patterns in technical analysis, offering a significant edge in your trading strategy. Key Features: Non-Repainting Accuracy: Enjoy the confidence of non-repainting technology. Once a Super Reversal Pattern is detected, it remains static, providing consiste
Chart Patterns Detect 15 patterns (Ascending Triangle, Descending Triangle, Rising Wedge, Falling Wedge, Bullish Flag, Bearish Flag, Bullish Rectangle, Bearish Rectangle Symmetrical triangle, Head and Shoulders, Inverted Head and Shoulders, Triple top, Triple Bottom, Double Top, Double Bottom) Use historical data to calculate the probability of each pattern to succeed (possibility to filter notification according to the chance of success) gives graphic indication about the invalidation level and
Trend Oscillator - è un indicatore Crypto_Forex personalizzato avanzato, uno strumento di trading efficiente! - Viene utilizzato un nuovo metodo di calcolo avanzato - 20 opzioni per il parametro "Prezzo per calcolo". - L'oscillatore più fluido mai sviluppato. - Colore verde per i trend al rialzo, colore rosso per i trend al ribasso. - Valori di ipervenduto: inferiori a 5, valori di ipercomprato: superiori a 95. - Ci sono molte opportunità per aggiornare anche le strategie standard con questo in
Gli utenti di questo prodotto hanno anche acquistato
Super Signal – Skyblade Edition Sistema professionale di segnali di tendenza senza repaint / senza ritardo con tasso di vincita eccezionale | Per MT4 / MT5 Funziona meglio su timeframe più bassi, come 1 minuto, 5 minuti e 15 minuti. Caratteristiche principali: Super Signal – Skyblade Edition è un sistema intelligente di segnali progettato specificamente per il trading di tendenza. Utilizza una logica di filtraggio multilivello per identificare esclusivamente i movimenti direzionali forti, supp
All in One package includes the  Oscillator Predictor ,  MACD Predictor ,  Thrust Scanner  and  Advanced Fibonacci  indicators which are mandatory for applying  Dinapoli  trade plans.  Please visit below links for detailed explanations of indicators. Advanced Fibonacci Indicator =>  https://www.mql5.com/en/market/product/52834 Thrust Scanner Indicator => https://www.mql5.com/en/market/product/52830 Overbought /Oversold Predictor indicator => https://www.mql5.com/en/market/product/52621 Macd P
Segnale GoldRush Trend Arrow L'indicatore GoldRush Trend Arrow Signal fornisce un'analisi precisa e in tempo reale dei trend, pensata appositamente per gli scalper ad alta velocità e a breve termine nel mercato XAU/USD. Progettato specificamente per il timeframe di 1 minuto, questo strumento mostra frecce direzionali che indicano chiari punti di ingresso, consentendo agli scalper di navigare con sicurezza nelle condizioni di mercato volatili. L'indicatore è composto da frecce di avviso PRIMA
OrderFlow Absorption – Indicatore professionale di Delta e Segnali di Assorbimento per MT4 Sblocca la potenza della vera analisi del flusso degli ordini con OrderFlow Absorption – l’indicatore definitivo di istogramma delta e segnali di assorbimento per MetaTrader 4. Progettato per i trader che vogliono vedere cosa succede davvero dietro ogni movimento di prezzo, questo strumento rivela la pressione nascosta di acquisto/vendita e gli eventi di assorbimento che muovono il mercato. Caratteristiche
Miraculous Indicator Binary & Forex v3 StrategySafe Miraculous Indicator Binary & Forex v3 StrategySafe è un indicatore professionale progettato per trader che cercano segnali chiari, strumenti di conferma avanzati e un metodo strutturato per operare sui mercati Binary e Forex. La versione v3 include MIR Dashboard, Miraculous Confirmation Dashboard, GANN Law, livelli Square of 9, angoli GANN e una modalità Forex più completa per un’analisi di mercato più precisa. Caratteristiche principali Modal
ORB Seeker
Marcela Goncalves De Oliveira
4 (1)
Prezzo speciale per limitare la disponibilità e mantenere l'interesse per il prodotto! Solo $599! Dopo l'acquisto, contattami per ricevere in omaggio l'EA ORB Seeker e i file di configurazione personalizzati e ottimizzati. Individua con sicurezza le eruzioni cutanee durante le sessioni di allenamento! ORB Seeker è un indicatore ORB (Opening Range Breakout) professionale, pensato per i trader che desiderano precisione, semplicità, flessibilità e una struttura grafica chiara. Traccia automaticam
IQ FX Gann Levels a precision trading indicator based on W.D. Gann’s square root methods . It plots real-time, non-repainting support and resistance levels to help traders confidently spot intraday and scalping opportunities with high accuracy. William Delbert Gann (W.D. Gann) was an exceptional market analyst, whose trading technique was based on a complex blend of mathematics, geometry, astrology, and ancient mathematics which proved to be extremely accurate. We don't offer free or bonus indic
Gold Channel is a volatility-based indicator, developed with a specific timing algorithm for the XAUUSD pair, which consists of finding possible corrections in the market. This indicator shows two outer lines, an inner line (retracement line) and an arrow sign, where the theory of the channel is to help identify overbought and oversold conditions in the market. The market price will generally fall between the boundaries of the channel. If prices touch or move outside the channel it is a tradi
Meravith
Ivan Stefanov
5 (3)
Strumento per market maker. Meravith: Analizzerà tutti i timeframe e mostrerà il trend attualmente in corso. Evidenzierà le zone di liquidità (equilibrio dei volumi) dove i volumi rialzisti e ribassisti sono uguali. Mostrerà tutti i livelli di liquidità dei diversi timeframe direttamente sul grafico. Genererà e presenterà un’analisi di mercato testuale a scopo di riferimento. Calcolerà obiettivi, livelli di supporto e punti di stop-loss in base al trend attuale. Calcolerà il rapporto rischio/ren
Linear Trend Predictor : indicatore di tendenza che combina punti di ingresso e linee di supporto direzionale. Funziona secondo il principio di rottura del canale dei prezzi alto/basso. L'algoritmo dell'indicatore filtra il rumore di mercato, tiene conto della volatilità e delle dinamiche di mercato. Capacità dell'indicatore Utilizzando metodi di smoothing, mostra l'andamento del mercato e i punti di ingresso per l'apertura di ordini di ACQUISTO o VENDITA. Adatto per determinare i movimenti d
Binary Booster
Yaroslav Varankin
5 (1)
Binary Options Trading Indicator: A Reliable Tool for Your Trades This indicator is specifically designed for binary options trading and has proven its high quality, reliability, and adequate accuracy, depending on the dynamics of the chart. Key Points: Signal Interpretation: When a blue cross signal appears, it indicates a potential entry into a trade, though it is considered a weak signal on its own. However, if the blue cross is accompanied by an arrow, it is considered a more reliable buy s
MagicTrigger — Indicatore di conferma della divergenza HD/RD multi-timeframe MagicTrigger è un motore di divergenze multi-timeframe che cerca una divergenza strutturale su un timeframe superiore (HD) e ne attende la conferma tramite divergenze corrispondenti su timeframe inferiori (RD) all'interno della stessa zona di prezzo. L'indicatore segnala un'opportunità solo quando la struttura del timeframe superiore e le conferme dei timeframe inferiori coincidono, insieme a un punto di ingresso sugger
Enigmera
Ivan Stefanov
5 (9)
ENIGMERA: Il cuore del mercato Importante: La demo di MQL5.com funziona nel Strategy Tester e potrebbe non riflettere completamente le funzionalità di Enigmera. Consulta la descrizione, gli screenshot e il video per maggiori dettagli. Non esitare a inviarmi un messaggio se hai domande! Il codice dell'indicatore è stato completamente riscritto. La versione 3.0 aggiunge nuove funzionalità e corregge i bug accumulati dall'inizio dell'indicatore. Introduzione Questo indicatore e sistema di trading
First time on MetaTrader, introducing IQ Star Lines - an original Vedic Astrology based indicator. "Millionaires don't use astrology, billionaires do" . - J.P. Morgan, Legendary American financier and banker. We don't offer free or bonus indicators in exchange of reviews from you. You won't need any free products with this indicator to make it work. ;) Enjoy! Welcome to  the new and updated  IQ Star Lines , the ultimate fusion of ancient planetary harmonic cycles and modern quantitative trading.
Algo Trading Indicaor  With this indicator , you’ll have zones and trends that hight probability the price will reverse from it. so will gives you all the help that you need  MT5 Version                    https://www.mql5.com/en/market/product/170028 MT4 Version                    https://www.mql5.com/en/market/product/88034 Why should you join us !?  1-This indicator is logical since it’s working in previous days movement , to predict the future movements. 2-Algo trading indicator will hel
Auto Elliott Engine The Auto Elliott Engine is a tool designed for MetaTrader 4 that automates the identification, decomposition, and projection of price structures based on the Elliott Wave Theory. Powered by a pattern-recognition engine, this indicator processes price action to identify market configurations, translating data into structured scenarios. Key Features Multi-Degree Recognition: Analyzes price action across multiple fractal levels. From higher degrees, such as Supercycle or Cycle,
CVD Divergenza Rilevazione - Analisi Avanzata del Delta Volume   IL PROBLEMA CHE RISOLVIAMO La maggior parte dei trader si affida esclusivamente all'azione del prezzo, perdendo informazioni cruciali sul flusso di volume che rivelano il vero sentiment del mercato. Gli indicatori tradizionali sono in ritardo rispetto ai movimenti di prezzo, causando entrate tardive e cattiva gestione del rischio. CVD Divergenza Rilevazione risolve questo analizzando la relazione tra prezzo e momentum del delta
How to use Pair Trading Station Pair Trading Station is recommended for H1 time frame and you can use it for any currency pairs. To generate buy and sell signal, follow few steps below to apply Pair Trading Station to your MetaTrader terminal. When you load Pair Trading Station on your chart, Pair Trading station will assess available historical data in your MetaTrader platforms for each currency pair. On your chart, the amount of historical data available will be displayed for each currency pai
FFx Engulfing Setup Alerter gives trade suggestions with Entry, Target 1, Target 2 and StopLoss. Below are the different options available: Entry suggestion - pips to be added over the break for the entry 3 different options to calculate the SL - by pips, by ATR multiplier or at the pattern High/Low 3 different options to calculate the 2 TPs - by pips, by ATR multiplier or at Risk/Reward Offset the dashboard - any place on the chart Remove the suggestion once the price reached the SL line Lines
FFx InsideBar Setup Alerter gives trade suggestions with Entry, Target 1, Target 2 and StopLoss. Below are the different options available: Entry suggestion - pips to be added over the break for the entry Minimum candle size - to avoid too close buy/sell entry suggestions 3 different options to calculate the SL - by pips, by ATR multiplier or at the pattern High/Low 3 different options to calculate the 2 TPs - by pips, by ATR multiplier or at Risk/Reward Offset the dashboard - any place on the c
FFx OutsideBar Setup Alerter gives trade suggestions with Entry, Target 1, Target 2 and StopLoss. Below are the different options available: Entry suggestion - pips to be added over the break for the entry. 3 different options to calculate the SL - by pips, by ATR multiplier or at the pattern High/Low. 3 different options to calculate the 2 TPs - by pips, by ATR multiplier or at Risk/Reward. Offset the dashboard - any place on the chart. Remove the suggestion once the price reached the SL line.
FFx PinBar Setup Alerter gives trade suggestions with Entry, Target 1, Target 2 and StopLoss. Below are the different options available: Entry suggestion - pips to be added over the break for the entry Minimum candle size - to avoid too small candles 3 different options to calculate the SL - by pips, by ATR multiplier or at the pattern High/Low 3 different options to calculate the 2 TPs - by pips, by ATR multiplier or at Risk/Reward Offset the dashboard - any place on the chart Remove the sugges
Automatic, live & interactive picture of all trendlines. Assign push, email and sound alerts to the lines of your choice and be informed about price rollback, breakout, rollback after breakout, number of rollbacks, line expiration by double breakout. Correct, drag or delete the lines and interactively tune the line system. https://youtu.be/EJUo9pYiHFA . Chart examples https: //www.mql5.com/en/users/efficientforex Price Interaction Events All events are effective immediately and only after one
The purpose of this new version of the MT4 standard indicator provided in your platform is to display in a sub-window multiple timeframes of the same indicator with its divergences. See the example shown in the picture below. But the display isn't like a simple MTF indicator. This is the real display of the indicator on its timeframe. Here's the options available in the FFx divergences indicator: Select the timeframes to be displayed (M1 to Monthly) Define the width (number of bars) for each tim


The purpose of this new version of the MT4 standard indicator provided in your platform is to display in a sub-window multiple timeframes of the same indicator with its divergences. See the example shown in the picture below. But the display isn't like a simple MTF indicator. This is the real display of the indicator on its timeframe. Here's the options available in the FFx divergences indicator: Select the timeframes to be displayed (M1 to Monthly). Define the width (number of bars) for each ti


The FFx Dashboard MTF alerter will show you on a single chart all the timeframes (M1 to Monthly) with their own status for the indicator. 2 Alert Options: Single timeframe: each selected timeframe alert separately when a signal occurs Multi timeframes: all selected timeframes must agree for an alert to be triggered Both options have an input to select the timeframes to be used for the alert(s). How to Understand the Status: Green/Red square: histogram above/below 0 line Green square + Red bord
The FFx Dashboard MTF alerter will show you on a single chart all the timeframes (M1 to Monthly) with their own status for the indicator. 2 Alert Options: Single timeframe: each selected timeframe alert separately when a signal occurs Multi timeframes: all selected timeframes must agree for an alert to be triggered Both options have an input to select the timeframes to be used for the alert(s). How to understand the status: Green/Red square: RSI above/below 50 line Green square + Red border: R
Altri dall’autore
Volatility Master for MetaTrader is a real-time dashboard tool that scans up to  50 symbols  to identify high-volatility , trending markets instantly. With bullish/bearish signals, customizable alerts, and a user-friendly interface, it helps you avoid range-bound conditions and focus on high-probability trades. Clarity leads to confidence. Trade confidently and protect your capital effectively with this powerful dashboard. We don't offer free or bonus indicators in exchange of reviews from you.
The Hydra Multi Trend Dashboard is an AI-Powered excellent market scanning tool designed for MetaTrader 4 and MetaTrader 5. It monitors up to 45 currency pairs or assets simultaneously across all 9 standard timeframes (M1 to Monthly). Using a proprietary Special Trend Formula, the dashboard filters out market noise and provides clear, visual Bullish or Bearish signals, allowing traders to identify trend alignments at a glance without switching charts. We don't offer free or bonus indicators in
Hydra Trend Rider   is a premium multi-timeframe dashboard that instantly reveals the market trend across 9 timeframes (M1 to Monthly). Using a highly accurate, non-repainting AI-Powered algorithm, it helps you trade in the direction of the dominant market momentum. We don't offer free or bonus indicators in exchange of reviews from you. You won't need any free products with this indicator to make it work. ;) Enjoy! User Manual: Here MT4 Version: Here Explore All Indicator Strategies: Here
Presenting one-of-a-kind Gann Indicator for XAUUSD IQ Gold Gann Levels is a non-repainting, precision tool designed exclusively for XAUUSD intraday trading. It uses W.D. Gann’s square root method to plot real-time support and resistance levels, helping traders spot high-probability entries with confidence and clarity. William Delbert Gann (W.D. Gann) was an exceptional market analyst whose trading technique was based on a complex blend of mathematics, geometry, astrology, and ancient calculation
IQ FX Gann Levels a precision trading indicator based on W.D. Gann’s square root methods . It plots real-time, non-repainting support and resistance levels to help traders confidently spot intraday and scalping opportunities with high accuracy. William Delbert Gann (W.D. Gann) was an exceptional market analyst, whose trading technique was based on a complex blend of mathematics, geometry, astrology, and ancient mathematics which proved to be extremely accurate. We don't offer free or bonus indic
First time on MetaTrader, introducing IQ Star Lines, an original Vedic Astrology Based Intraday Trading Indicator. We don't offer free or bonus indicators in exchange of reviews from you. You won't need any free products with this indicator to make it work. ;) Enjoy! Welcome to the new and updated  IQ Star Lines , the ultimate fusion of ancient planetary cycles and modern quantitative trading, published for the first time on Metatrader. This is an indicator built by the developer, who has spent
Hydra Trend Rider
INTRAQUOTES
4.6 (5)
Hydra Trend Rider   is a premium multi-timeframe dashboard that instantly reveals the market trend across 9 timeframes (M1 to Monthly). Using a highly accurate, non-repainting AI-Powered algorithm, it helps you trade in the direction of the dominant market momentum. We don't offer free or bonus indicators in exchange of reviews from you. You won't need any free products with this indicator to make it work. ;) Enjoy! User Manual: Here MT5 Version: Here Explore All Indicator Strategies: Here
IQ FX Gann Levels a precision trading indicator based on W.D. Gann’s square root methods . It plots real-time, non-repainting support and resistance levels to help traders confidently spot intraday and scalping opportunities with high accuracy. William Delbert Gann (W.D. Gann) was an exceptional market analyst, whose trading technique was based on a complex blend of mathematics, geometry, astrology, and ancient mathematics which proved to be extremely accurate. We don't offer free or bonus indic
Presenting one-of-a-kind Gann Indicator for XAUUSD IQ Gold Gann Levels is a non-repainting, precision tool designed exclusively for XAUUSD intraday trading. It uses W.D. Gann’s square root method to plot real-time support and resistance levels, helping traders spot high-probability entries with confidence and clarity. William Delbert Gann (W.D. Gann) was an exceptional market analyst whose trading technique was based on a complex blend of mathematics, geometry, astrology, and ancient calculation
First time on MetaTrader, introducing IQ Star Lines - an original Vedic Astrology based indicator. "Millionaires don't use astrology, billionaires do" . - J.P. Morgan, Legendary American financier and banker. We don't offer free or bonus indicators in exchange of reviews from you. You won't need any free products with this indicator to make it work. ;) Enjoy! Welcome to  the new and updated  IQ Star Lines , the ultimate fusion of ancient planetary harmonic cycles and modern quantitative trading.
Volatility Master
INTRAQUOTES
4.33 (6)
Volatility Master for MetaTrader is a real-time dashboard tool that scans up to  50 symbols  to identify high-volatility , trending markets instantly. With bullish/bearish signals, customizable alerts, and a user-friendly interface, it helps you avoid range-bound conditions and focus on high-probability trades. Clarity leads to confidence. Trade confidently and protect your capital effectively with this powerful dashboard. We don't offer free or bonus indicators in exchange of reviews from you.
FX Correlation Matrix is a powerful multi-timeframe dashboard that helps traders analyze real-time currency correlations of up to 28 symbols at a glance. With customizable settings, sleek design, and manual symbol selection option, it enhances trade accuracy, reduces risk, and identifies profitable correlation-based opportunities. Setup & Guide:  Download   MT5 Version here. Follow our MQL5 channel for daily market insights, chart, indicator updates and offers!  Join here. Read the product des
IQ Chart Cleaner – Get a Fresh Chart in Seconds. A cluttered chart can make trading stressful and confusing. Between dozens of old indicators, leftover lines, arrows, shapes, and notes, it’s easy to lose focus on what really matters—your trades. That’s where IQ Chart Cleaner comes in. With a single click, IQ Chart Cleaner gives you a fresh, distraction-free chart so you can analyze the markets with clarity and confidence. Get the MT5 Version here . Key Benefits Total Cleaning Power – Instantly
IQ Trade Status – A Professional Trade Panel to track all your LIVE TRADES in a single dashboard. IQ Trade Status is not just a trade panel; it is a professional dashboard designed for MetaTrader. It replaces the default Terminal window with a clean, structured, and actionable overview of your account and open trades. The dashboard is designed to help you instantly answer three critical questions: How much have I made today? How much will I lose if all my trades go wrong? Is my account over-le
IQ FX Strength answers the single most important question in trading: "Who is truly driving the market right now?"  Designed with a stunning Hybrid UI, this tool separates true trend moves from market noise, allowing you to catch "Explosive" moves before the crowd sees them. We don't offer free or bonus indicators in exchange of reviews from you. You won't need any free products with this indicator to make it work. ;) Enjoy! Get   lifetime access for $149 today - save $50 before the price increa
FX Correlation Matrix is a powerful multi-timeframe dashboard that helps traders analyze real-time currency correlations of up to 28 symbols at a glance. With customizable settings, sleek design, and manual symbol selection option, it enhances trade accuracy, reduces risk, and identifies profitable correlation-based opportunities. Setup & Guide:  Download   MT4 Version here. Follow our MQL5 channel for daily market insights, chart, indicator updates and offers!  Join here. Read the product des
Get a clean chart in an instant.  This script is extremely helpful in removing not only all the graphical objects from the chart but also all the  indicators from the chart.  Get the MT4 Version here . Features: Confirmation Dialog : Asks for confirmation before cleaning the chart. Complete Cleaning: Removes all graphical objects (lines, arrows, shapes, etc.) Removes all indicators from all chart windows (main and subwindows) Logging: Prints information about the cleaning process in the Expert
IQ Trade Status – A Professional Trade Panel to track all your LIVE TRADES in a single dashboard. IQ Trade Status is not just a trade panel; it is a professional dashboard designed for MetaTrader. It replaces the default Terminal window with a clean, structured, and actionable overview of your account and open trades. The dashboard is designed to help you instantly answer three critical questions: How much have I made today? How much will I lose if all my trades go wrong? Is my account over-le
IQ FX Strength answers the single most important question in trading: "Who is truly driving the market right now?"  Designed with a stunning Hybrid UI, this tool separates true trend moves from market noise, allowing you to catch "Explosive" moves before the crowd sees them. We don't offer free or bonus indicators in exchange of reviews from you. You won't need any free products with this indicator to make it work. ;) Enjoy! Get lifetime access for $149 today - save $50 before the price increase
Filtro:
Forex Technical Analyst Trader
2454
Forex Technical Analyst Trader 2017.04.18 20:58 

L'utente non ha lasciato alcun commento sulla valutazione.

INTRAQUOTES
11454
Risposta dello sviluppatore Somsri Sarkar 2026.07.30 12:18
Thank you very much for your valuable 5-star review and for taking the time to share your experience. We're delighted to hear that the dashboard is helping you analyse multiple charts more efficiently and streamline your trading workflow. Your feedback is truly appreciated and motivates us to continue developing practical tools for serious traders. We wish you continued success and many profitable trades ahead!
Rispondi alla recensione