Traders Paradise Indicator

TradersParadiseView: Institutional Liquidity & Trend Logic

TradersParadiseView is a professional-grade momentum and supply/demand indicator designed to identify high-probability "Smart Money" entries. Unlike standard lagging indicators, this tool focuses on Institutional Trap Zones and Market Volatility Confluence to provide precise entries with minimal drawdown.

Developed for the modern trader, it translates complex price action into simple, actionable visual zones and signals.

How it Works

TradersParadiseView operates on a proprietary triple-filter system:

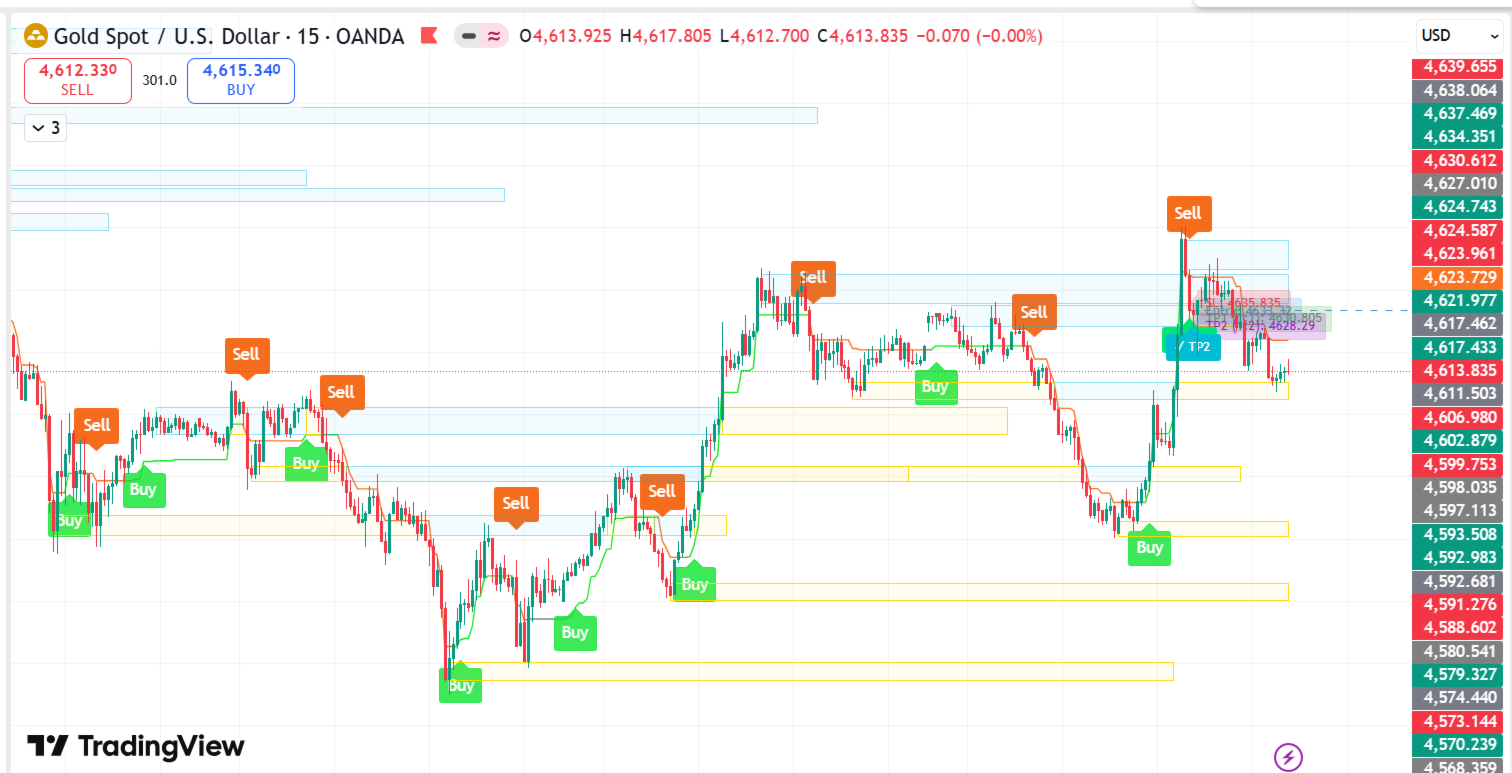
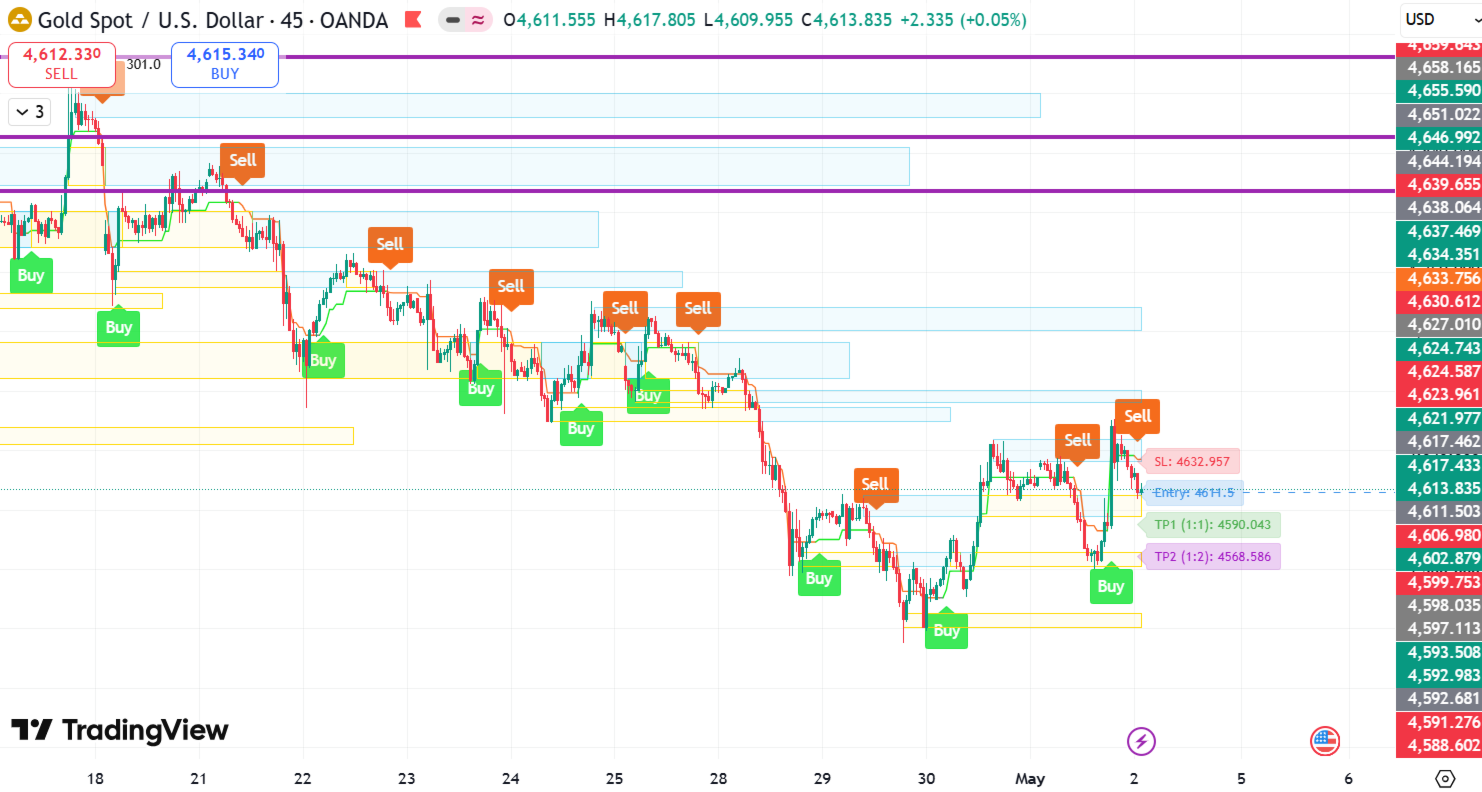
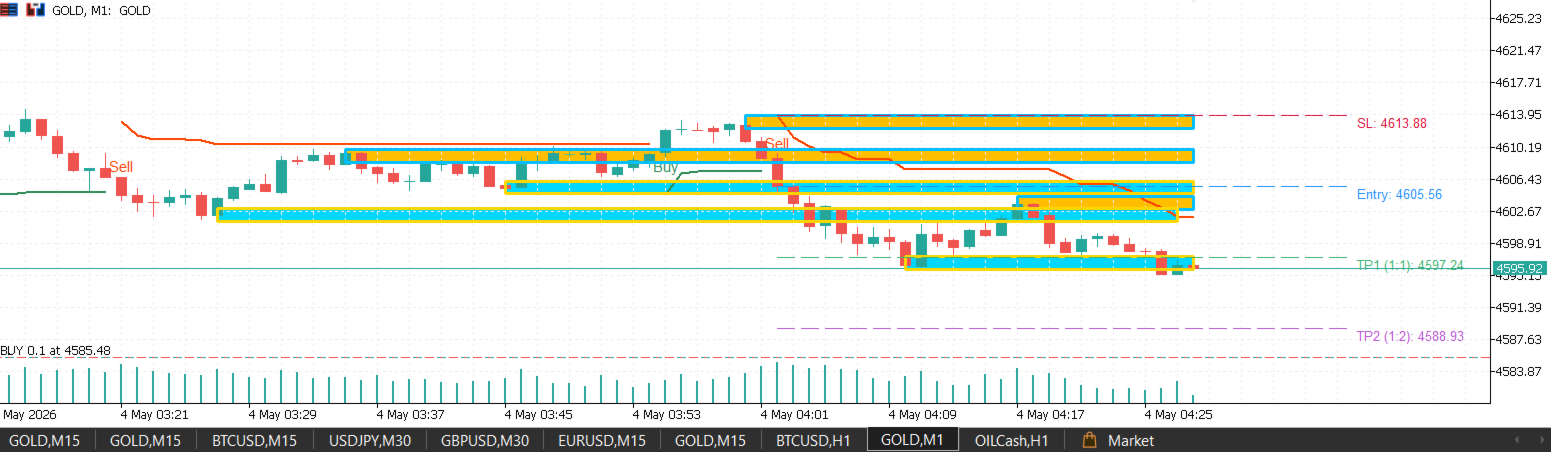
  1. Institutional Zone Detection: The indicator automatically maps "Red & Black" boxes—critical areas of supply and demand where big players (Institutions) are likely to enter. It identifies where retail traders are being "trapped" and provides signals in the direction of the real market move.

  2. Adaptive Momentum Smoothing: Using an advanced smoothing algorithm, the indicator filters out market noise. It remains "Green" during bullish regimes and "Red" during bearish regimes, helping you stay in the trend longer without being shaken out by minor retracements.

  3. Volatility-Price Alignment: It calculates the relationship between price expansion and volume. Signals are only generated when there is sufficient "Fuel" (volatility) to move the market, preventing entries during low-liquidity "sideways" sessions.

Key Features

  • Non-Repainting Signals: Once a candle closes and a signal is generated, it stays fixed. No moving goalposts.

  • Automated Entry/Exit Zones: Clearly defined boxes act as your stop-loss and take-profit anchors.

  • Multi-Asset Compatibility: Optimized for Forex (Major/Minors), Gold (XAUUSD), and Indices (US30, NAS100).

  • Built-in Alert System: Receive Push Notifications, Email, or Desktop alerts the moment a "Paradise Zone" is formed.

  • Intuitive Interface: Clean, professional visuals that won't clutter your charts.

Trading Recommendations

  • Timeframes: Best performance on M15, H1, and H4 for trend following; M5 for scalping.

  • Account Type: Works on any account, but ECN/Low-Spread accounts are recommended for the best precision.

  • Strategy: For maximum win rate, trade in the direction of the "Paradise" color zone when price reacts off a "Red/Black" institutional box.

Why Choose TradersParadiseView?

In a market filled with "magic" indicators, this tool relies on the raw physics of the market: Liquidity and Momentum. It is designed to give you the same perspective as institutional desk traders, helping you avoid retail traps and trade with the "Smart Money."


推荐产品
Intraday Session TPO
Kummari Raghu Ram
Intraday Session TPO: Precision Volume Profiling for Day Traders Stop trading blind during the most volatile hours of the day. Standard daily volume profiles blend everything together, masking the true areas of liquidity and institutional interest. The Intraday Session TPO is engineered specifically for session-to-session traders. It empowers you to isolate and profile specific time windows—like the London Open, the New York Killzone, or the Asian range—so you can see exactly where the volume is
VisualVol EURUSD
Maxim Kuznetsov
The indicator highlights the points that a professional trader sees in ordinary indicators. VisualVol visually displays different volatility indicators on a single scale and a common align. Highlights the excess of volume indicators in color. At the same time, Tick and Real Volume, Actual range, ATR, candle size and return (open-close difference) can be displayed. Thanks to VisualVol, you will see the market periods and the right time for different trading operations. This version is intended f
FREE
CvdDeltaVolumes
Parasbhai N Patel
Delta + CVD & CVD Candles Order-flow indicator combining Delta (Ask–Bid), Cumulative Volume Delta (CVD), and a unique CVD-based synthetic candle system. Shows buy/sell pressure, volume aggressiveness, and momentum shifts with optional Delta histogram, CVD line, and CVD+Delta combined candles. Useful for scalping, intraday trading, divergence detection, and understanding buyer/seller dominance. Overview The Delta + CVD & CVD Candles Indicator combines multiple order-flow tools into one clean
Delta Profile Volume
Teresinha Moraes Correia
指标技术说明 – Delta Profile for MetaTrader 5 Delta Profile 是为 MetaTrader 5 开发的一款指标,用于在指定的 K 线区间内对成交量流进行详细分析。它能够在不同的价格水平上对正向成交量(与上涨相关)和负向成交量(与下跌相关)的不平衡进行结构化和可视化展示。最终,用户可以清晰地识别图表中成交最为集中的区域,以及真实的市场不平衡形成的位置。 以下是该指标的主要技术特征与参数说明。 核心概念 指标会识别 价格水平 ,并将其分类为正向成交量、负向成交量,以及净 Delta(正负成交量的差值)。 每个价格水平会在图表中以 水平条形 显示,帮助用户直观观察市场活跃区和不平衡区域。 用户可自由控制 分析的 K 线数量 、 价格精度(小数位数) 、 显示的最大水平数量 以及 可视化样式 。 主要功能 价格水平映射 :根据设定的精度对价格进行四舍五入,并累计对应 K 线的成交量。 净 Delta 计算 :显示正负成交量的差值,提供每个价格区间的客观数值。 最强 Delta 水平突出显示 :自动识别 Delta 绝对值最大的价格水平,并用特殊颜色标
SMC Venom 模型 BPR 指標是針對在智慧貨幣 (SMC) 概念內工作的交易者的專業工具。它會自動辨識價格圖表上的兩種關鍵模式: FVG (公平價值缺口)是三根蠟燭的組合,其中第一根和第三根蠟燭之間存在缺口。它在水平之間形成一個沒有成交量支撐的區域,這通常會導致價格調整。 BPR (平衡價格區間)是兩種 FVG 模式的組合,形成一個「橋樑」 - 當價格以低成交量活動移動時,突破並返回到水平的區域,從而在蠟燭之間產生間隙。 這些模式可協助交易者透過分析圖表上的交易量和價格動態(大型市場參與者和普通參與者之間的互動)來識別關鍵的支撐/阻力位、突破區域和切入點。 此指標以矩形和箭頭的形式可視化模式,也支援靈活的警報設定。 主要特點: 模式顯示模式:選擇顯示 BPR 模式(看漲和看跌)或 FVG 模式(看漲和看跌)。 可以隱藏所有圖表分析模式。 以條數過濾:BPR 結構中 FVG 之間的最小/最大距離。 訊號的附加視覺化: 箭頭有 9 種類型可供選擇(標準、細、分形等)或手動輸入 Wingdings 代碼,其表格可以選擇性地顯示在圖表上。 設定顏色、尺寸及其縮放時相對於價格的動態
Volume Profile V6
Andrey Kolesnik
4.75 (4)
市场成交量分布(Volume Profile)指标 + 智能震荡器(Smart Oscillator)。适用于几乎所有交易品种——外汇、股票、期货、加密货币,支持真实成交量和Tick成交量。可以自动设置分析区间(例如一周、一个月等),也可以通过移动两条边界线(红色和蓝色两条垂直线)手动设置区间。指标以直方图形式显示。在某一价格水平上,直方图的宽度表示该价位的成交活跃程度(成交次数)。参数“Mode level line color”可用于自动显示最重要的成交量水平,这些位置价格有较大概率发生反应;参数“Maximum color (POC)”则单独标记整个区间内成交量最大的价格水平。 智能震荡器用于显示超买和超卖区域。它通过分析多个指标的数据,并基于处理后的信息,用不同颜色标识超买和超卖区域。 在 Volume every day 模块中,可以通过 Range period 参数设置构建成交量分布的时间周期,通过 Range count 参数设置区间数量。例如:Range period=1Day,Range count=10,表示指标将构建最近10天的日内成交量分布。需要注意的是,切换
Value Chart Candlesticks
Flavio Javier Jarabeck
4.57 (14)
The idea of a Value Chart indicator was presented in the very good book I read back in 2020 , " Dynamic Trading Indicators: Winning with Value Charts and Price Action Profile ", from the authors Mark Helweg and David Stendahl. The idea is simple and the result is pure genius: Present candlestick Price analysis in a detrended way! HOW TO READ THIS INDICATOR Look for Overbought and Oversold levels. Of course, you will need to test the settings a lot to find the "correct" one for your approach. It
FREE
SPECIAL LAUNCH OFFER: $30 (1-Month Rent) Limited time offer to build our community and gather feedback! AmbM GOLD Institutional Scalper A high-precision M5 algorithm for XAUUSD (Gold) , engineered to trade exclusively at Institutional Liquidity Levels ($5/$10 psychological marks). PERFORMANCE DATA (BUY ONLY) • Win Rate: 87.09%. • Safe Growth: +$4,113 profit on $10k (13.75% Max Drawdown). • Extreme Stress Test: Successfully generated +$22,997 in a 5-year stress test (2020-2026), proving
Blahtech Market Profile MT5
Blahtech Limited
5 (10)
Was: $249  Now: $99   Market Profile defines a number of day types that can help the trader to determine market behaviour. A key feature is the Value Area, representing the range of price action where 70% of trading took place. Understanding the Value Area can give traders valuable insight into market direction and establish the higher odds trade. It is an excellent addition to any system you may be using. Inspired by Jim Dalton’s book “Mind Over Markets”, this indicator is designed to suit the
本指标可以让您享受两个最流行的产品来分析在感兴趣的价位的请求量和市场成交量: 真实市场深度图表 真实报价足迹成交量图表 本产品结合两个指标的效力,并以单个文件提供。 反危机出售。今日低价。赶紧! 真实的 COMBO 市场深度功能和报价成交量图表,完全等同于原始指标。您将享受这两款产品结合为单一超级指标的力量!下面是您将得到的功能: 真实市场深度图表 股民专用工具现已在 MetaTrader 5 上可用。 真实市场深度图表 指标在图表上以直方条的形式显示可视化的市场深度,并在实时模式下刷新。 利用 真实市场深度图表 指标您可以正确评估市场请求并从图表上看到大的市场。这可以 100% 的精确剥头皮和设置持仓止损。 指标以两种相应颜色的水平直方条形式显示买和卖的请求 (买-卖)。价格图表上给定级别的显示条和它们的长度与请求的交易量相应。此外, 它指示买卖请求的最大交易量。 此指标显示买卖请求总数量作为堆积面积图。这可以评估当经过下一价位时将会执行的请求总量。买卖请求总数量也显示在图表上。 省缺, 指标显示在图表背景上, 且它不会干扰任何其它指标。当使用指标交易时, 建议使用实际交易量。 本
Premium https://www.mql5.com/en/market/product/167272 BITCOIN DAILY TOP BOTTOM ENGINE (V1) This is not a simple indicator. This is a professional-grade market observation and decision engine designed for serious Bitcoin traders who demand clarity, structure, and precision. The Bitcoin Daily Top Bottom Engine is built to identify high-probability daily extremes using adaptive range logic, sweep behavior analysis, and market condition filtering. Instead of reacting late, this engine prepares y
FREE
Aggression Volume
Flavio Javier Jarabeck
4.29 (17)
Aggression Volume Indicator is the kind of indicator that is rarely found in the MQL5 community because it is not based on the standard Volume data provided by the Metatrader 5 platform. It requires the scrutiny of all traffic Ticks requested on the platform... That said, Aggression Volume indicator requests all Tick Data from your Broker and processes it to build a very special version of a Volume Indicator, where Buyers and Sellers aggressions are plotted in a form of Histogram. Additionally,
FREE
Time and Sales Tick
Pablo Filipe Soares De Almeida
Time & Sales Tick Indicator 是一款专为 MetaTrader 5 平台设计的实时报价与成交监控指标。 该工具能够在图表上实时显示每笔交易的价格、成交量与时间信息,帮助交易者观察市场的细微波动与订单流动。 功能说明 在图表中的独立面板上实时展示价格、成交量与成交时间,便于跟踪市场动态。 可根据用户自定义的时间或数量间隔对成交数据进行分组。 系统自动对价格变动进行颜色区分:上涨以绿色显示,下跌以红色显示,使趋势变化一目了然。 面板可自由放置在图表的任意角落,支持调整大小、字体、透明度和刷新速度。 与所有交易品种和时间周期兼容,可在 MetaTrader 5 平台上稳定运行,不影响主图性能。 适用于分析市场活跃度、监控流动性以及辅助短线或高频交易策略。 此指标为交易者提供了更直观的市场视图,使其能够在高波动市场中更好地识别短期机会并改进决策效率。
ALIEN Dashboard
Youssef Esseghaiar
ALIEN DASHBOARD FULL EDITION – Professional ICT & Precision Trading Dashboard for MT5 ( HYBRID ENGINE ) Overview The   Alien Dashboard Full Edition   is a comprehensive, all‑in‑one technical indicator for MetaTrader 5 that merges the most powerful concepts from Inner Circle Trader (ICT) methodology with advanced precision‑entry logic, multi‑timeframe analysis, and an intuitive on‑chart dashboard. Designed for serious traders who want to visualise institutional order flow, identify high‑probabili
Smart Market Structure Simple is a powerful indicator that helps traders identify market structure based on the Smart Money Concept (SMC) . This indicator automatically detects Break of Structure (BOS), Change of Character (CHoCH), Fair Value Gaps (FVG), Order Blocks (OB), Liquidity Zones (LQZ), and key swing points Higher High (HH), Higher Low (HL), Lower High (LH), Lower Low (LL) . Main Objective: Assist traders in tracking institutional flow ( Smart Money ) and finding high-probability trade
Advanced Volume Profile Analysis Tool for MetaTrader 5 The Kecia Volume Profile Order Finder provides traders with volume profile analysis capabilities. This MT5 indicator combines volume profile visualization with statistical calculations to help identify potential trading opportunities and suggests entry, stop loss, and take profit levels based on market structure. Market Profile Visualization Transform your chart with customizable volume profile visualizations: Multiple visualization options
Before installing the HeatMap indicator make sure you are using a broker that gives you access to the Depth of market (DOM) !! This indicator creates a heatmap on your chart allowing you to see the buy or sell limit orders easily and in real time. You have the possibility to change the setting and the colors of the HeatMap in order to adapt to all markets and all charts. Here is an example of a setting you can use with the NASDAQ100 on the AMPGlobal broker :  https://www.youtube.com/watch?v=x0Y
MIDAS Super VWAP
Flavio Javier Jarabeck
4.27 (11)
Imagine VWAP, MVWAP and MIDAS in one place... Well, you found it! Now you can track the movement of Big Players in various ways, as they in general pursue the benchmarks related to this measuring, gauging if they had good execution or poor execution on their orders. Traders and analysts use the VWAP to eliminate the noise that occurs throughout the day, so they can measure what prices buyers and sellers are really trading. VWAP gives traders insight into how a stock trades for that day and deter
FREE
Elevate Your Trading with Advanced Anchored Volume Weighted Average Price Technology Unlock the true power of price action with our premium Anchored VWAP Indicator for MetaTrader 5 - the essential tool for precision entries, strategic exits, and high-probability trend continuation setups. Write me a DM for a 7 day free trial.  Anchored VWAP Plus gives traders unprecedented control by allowing custom anchor points for Volume Weighted Average Price calculations on any chart. With support for 4 sim
FREE
BTC Master Pro
Farzad Saadatinia
4.58 (12)
BTC Master Pro —— 您值得信赖的比特币纪律化交易伙伴。 全新版本现已集成 OpenAI 人工智能技术 ,在高波动的加密市场环境中,实现更智能的执行与更精准的交易过滤。 本专业级交易机器人专为 Bitcoin (BTCUSD) 在 MetaTrader 5 平台上的交易而设计,专注于结构化执行、风险暴露控制以及智能化风险管理。 当前价格: $499  →  下一阶段: $699  →  最终价格: $999 LIVE SIGNAL HERE 基于 OpenAI 的执行过滤系统 最新版本集成 OpenAI 技术,用于实时分析市场环境并过滤低质量或弱势交易信号。 AI 安全层(AI Safety Layer): 人工智能模块作为交易执行前的第二层审核机制。其功能严格限定为执行过滤工具(而非市场预测工具)。每一笔交易都必须通过结构化逻辑与智能验证流程,以减少不必要的回撤并避免低质量入场。 为什么选择 BTC Master Pro? 加密货币市场——尤其是比特币——具有高度波动性。情绪化决策往往导致不稳定的交易结果。本系统旨在帮助交易者在快速市场变化中保持结构化、纪律性与
This Volume Delta Profile is an advanced MetaTrader 5 indicator that visualizes   volume delta (order flow imbalance)   using a volume profile-style histogram. It shows the difference between buying and selling pressure at specific price levels, helping traders identify supply and demand zones. This indicator provides a unique perspective on market dynamics by visualizing the imbalance between buying and selling pressure, offering insights beyond traditional volume analysis. Core Concept Positiv
Caicai L&S Yield Histogram Important Notice: This indicator is an integral tool of the automated EA Caicai Long and Short Pair Trading . This indicator visually displays the percentage deviation (Yield %) of a pair's current spread relative to its own historical mean. It is an excellent tool for quickly visualizing the gross financial potential of a market distortion in Long & Short operations. Main Features: Percentage Visualization: Understand the size of the distortion in palpable percentage
Overview Heiken Ashi CE Filtered MT5 is a technical indicator for the MetaTrader 5 platform. It integrates smoothed candlestick charting with a dynamic exit strategy and a customizable trend filter to deliver clear buy and sell signals. The indicator is designed to improve trend detection and signal reliability by reducing market noise. If you want to see more high-quality products or order the development/conversion of your own products, visit my partners' website: 4xDev Get 10% OFF on manual
Segmented Volume MT5
Eduardo Da Costa Custodio Santos
Mine Farm
Maryna Kauzova
Mine Farm is one of the most classic and time-tested scalping strategies based on the breakdown of strong price levels. Mine Farm is the author's modification of the system for determining entry and exit points into the market... Mine Farm - is the combination of great potential with reliability and safety. Why Mine Farm?! - each order has a short dynamic Stop Loss - the advisor does not use any risky methods (averaging, martingale, grid, locking, etc.) - the advisor tries to get the most
CVD SmoothFlow Pro
Thalles Nascimento De Carvalho
CVD SmoothFlow Pro - 适用于任何资产的无限量分析! CVD SmoothFlow Pro 是寻求精确和无限量分析的交易者的终极解决方案。该专业版利用累计成交量 delta (CVD) 并结合高级噪声过滤,为交易任何金融资产提供所需的灵活性和精确度。 CVD SmoothFlow Pro 提供了什么? 清晰分析 :过滤市场噪声,突显任何金融资产中的重要成交量变动。 ️ 精确计算 :监测买卖差异,提供外汇、指数、加密货币等资产的成交量行为的详细视图。 直观界面 :提供易于理解和高效的分析,数据呈现清晰明了。 趋势识别 :更自信地识别市场趋势,帮助做出明智决策。 实际应用: 实时监测任何资产中买卖双方的平衡。 基于成交量识别趋势反转。 精确过滤,关注外汇、指数、加密货币等资产中的重要变动。 无限制的专业版! 专业版提供无限制的所有功能访问权限,让您能够对任何金融资产进行详细和无限量的分析。
Ultimate Retest
Nguyen Thanh Cong
5 (6)
Introduction The "Ultimate Retest" Indicator stands as the pinnacle of technical analysis made specially for support/resistance or supply/demand traders. By utilizing advanced mathematical computations, this indicator can swiftly and accurately identify the most powerful support and resistance levels where the big players are putting their huge orders and give traders a chance to enter the on the level retest with impeccable timing, thereby enhancing their decision-making and trading outcomes.
FREE
VP hidden
Emr Aljnaby
4.33 (12)
The indicator works to convert normal volume into levels and determine financial liquidity control points. It is very similar in function to Fixed Volume Profile. But it is considered more accurate and easier to use than the one found on Trading View because it calculates the full trading volumes in each candle and in all the brokers present in MetaTrade, unlike what is found in Trading View, as it only measures the broker’s displayed prices. To follow us on social media platforms: telegram
FREE
Donchian Pro
Paulo Henrique Faquineli Garcia
4.75 (4)
The Donchian Channel Channels are among the most popular tools of technical analysis, as they visually convey to the analyst the limits within which most price movement tends to occur. Channel users know that valuable information can be obtained at any time, whether prices are in the central region of a band or close to one of the border lines. One of the best known techniques to explore these concepts is Bollinger Bands. However, John Bollinger was not the only one to research the application
FREE
Welcome to the Ultimate Harmonic Patterns recognition indicator that is focused to detect advanced patterns. The Gartley pattern, Bat pattern, and Cypher pattern  are popular technical analysis tools used by traders to identify potential reversal points in the market. Our Ultimate Harmonic Patterns recognition Indicator is a powerful tool that uses advanced algorithms to scan the markets and identify these patterns in real-time. With our Ultimate Harmonic Patterns recognition Indicator, you ca
该产品的买家也购买
SignalTech MT5
Yue Wang
5 (16)
SignalTech MT5 is a trading system for EURUSD, USDCHF, USDJPY, AUDUSD, NZDUSD, EURJPY, AUDJPY, NZDJPY, CADJPY H2 and H3 Timeframe.  All the winning trades with chart setups are published on the comments page. 2025-12 1174 Pips 2026-01 2624 Pips 2026-02 2937 Pips 2026-03 2165 Pips 2026-04 2243 Pips It can generate signals with Buy/Sell Arrows and Pop-Up/Sound Alerts. Each signal has clear Entry and Stop Loss levels, which should be automatically flagged on the chart, as well as potential Targets
Azimuth Pro
Ottaviano De Cicco
5 (7)
Azimuth Pro V2:MT5合成分形结构分析与确认入场 概述 Azimuth Pro 是 Merkava Labs 推出的多层级波段结构指标。四层嵌套波段层级、锚定波段的VWAP、ABC形态识别、三时间框架结构过滤以及收盘确认入场——一个图表,一个从微观波段到宏观周期的完整工作流程。 这不是盲目的信号产品。它是一个以结构为先的工作流程,专为重视位置、背景和时机的交易者打造。 V2上市优惠 — Azimuth Pro V2售价USD 399(接下来的100份)。最终价格:USD 499。 1. V2的变化 合成多时间框架引擎 高时间框架分析从零开始重建,采用与Meridian Pro相同的专有合成架构。更清晰的HTF背景、稳定的实时行为、无经典MTF同步问题。合成引擎还解锁了 固定比率时间框架级联 (x2、x3、x4、x6)——不再在经纪商的固定时间框架之间任意跳转,您可以按图表时间框架的固定倍数分析结构,在每个尺度上保持相同的分形关系。 确认入场箭头 作为稳定且可恢复的执行层而设计的收盘确认箭头。当ABC设置形成且自适应确认逻辑在收盘K线上验证方向时,箭头会写入下一根K线的
首先,值得强调的是,这个交易工具是非重绘、非重画和非滞后的指标,非常适合专业交易。 在线课程,用户手册和演示。 智能价格行动概念指标是一个非常强大的工具,既适用于新手,也适用于经验丰富的交易者。它将超过20个有用的指标合并到一个指标中,结合了高级交易思想,如内圈交易员分析和智能资金概念交易策略。该指标侧重于智能资金概念,提供有关大型机构交易方式的见解,帮助预测它们的动向。 它在流动性分析方面尤其擅长,有助于理解机构的交易方式。它擅长预测市场趋势,并仔细分析价格波动。通过将您的交易与机构策略对齐,您可以更准确地预测市场走向。该指标多才多艺,擅长分析市场结构,识别重要的订单区块,并识别各种模式。 它擅长识别BOS和CHoCH等模式,理解动量的转变,并突出显示供需强劲的关键区域。它还擅长发现强大的不平衡,并分析价格创造更高高点或更低低点的模式。如果您使用斐波那契回撤工具,该指标可以满足您的需求。它还可以识别相等的高点和低点,分析不同的时间框架,并通过仪表板显示数据。 对于使用更高级策略的交易者,该指标提供了工具,如公平价值差指标和优惠和折扣区域的识别。它特别关注高时间框架订单区块,并
OmniSync Projection
Antonio-alin Teculescu
5 (1)
Chronos Fractal Engine is an innovative price projection indicator for MetaTrader 5, designed to transform your technical analysis by intelligently identifying and projecting historical price patterns. Built upon an advanced correlation algorithm and the fractal principles of the market, this powerful tool visualizes potential future price movements, giving you a unique edge in your trading decisions. What is Chronos Fractal Engine? At its core, the Chronos Fractal Engine employs a sophisticat
KT Alpha Hunter Arrows MT5
KEENBASE SOFTWARE SOLUTIONS
大多数箭头指标只给你一个信号,然后让你自己去判断剩下的一切。KT Alpha Hunter Arrows 为你提供完整的交易计划。 每一个信号箭头出现时,都会同时绘制一套完整计划:入场线、止损位、四个止盈目标,以及实时优势判断,告诉你当前这个交易品种和时间周期是否值得交易。随附的 Trade Manager EA 会在你手动入场后负责后续执行,让你在市场波动剧烈、情绪干扰明显时也能保持交易纪律。不重绘。仅在K线收盘后确认信号。适用于 Forex、黄金、指数以及任何你在 MT5 上交易的品种。 核心功能 不重绘买入和卖出箭头,只在K线收盘后生成。 每个信号都会显示入场线、结构性止损位和四个止盈目标。 Edge Dashboard 会分别评估当前图表上的买入和卖出机会。 判断系统包括:No Edge、Marginal、Tradeable、Good 或 Strong。 一键 Auto Optimize 按钮可根据当前品种和时间周期自动优化设置。 完整套装包含 Trade Manager EA,并提供五种专为本指标设计的预设交易管理方案。 Prop Firm Risk Panel 可在图表上
ARICoins
Temirlan Kdyrkhan
ARICoin is a powerful trading companion designed to generate high-probability entry signals with dynamic TP/SL/DP levels based on volatility. Built-in performance tracking shows win/loss stats, PP1/PP2 hits, and success rates all updated live. Key Features: Buy/Sell signals with adaptive volatility bands Real-time TP/SL/DP levels based on ATR Built-in MA Filter with optional ATR/StdDev volatility Performance stats panel (Success, Profit/Loss, PP1/PP2) Alerts via popup, sound, push, or email Cust
Meravith MT5
Ivan Stefanov
5 (1)
做市商工具。 Meravith 将: 分析所有时间周期并显示当前正在运行的趋势。 标注流动性区域(成交量均衡区),即多头与空头成交量相等的位置。 在您的图表上直接显示来自不同时间周期的所有流动性水平。 生成并展示基于文本的市场分析供您参考。 根据当前趋势计算目标位、支撑位和止损位。 计算交易的风险回报比。 根据您的账户余额计算仓位大小,并估算潜在利润。 在市场出现重大变化时,Meravith 还会发出警告。 指标的主要线条: 多头/空头成交量衰竭线 —— 作为目标位使用。 趋势线 —— 指示市场趋势方向。根据市场是多头还是空头而改变颜色,并作为趋势支撑。其颜色主要反映市场情绪。 成交量均衡线(Eq)—— Eq(Volume Equilibrium)是系统的核心。它表示买卖双方成交量的平衡点,即市场流动性所在位置。向上突破 Eq 表示多头倾向,向下突破 Eq 表示空头倾向。突破后,应等待回调——当价格回到相反趋势的偏离线或衰竭线附近时。 使用方法:只需将其添加到图表中。 Meravith 可以分析一切——趋势和回调。 趋势线与某条成交量衰竭线之间的距离越大,说明该方向的成交量越高。 趋势
RelicusRoad Pro MT5
Relicus LLC
5 (24)
RelicusRoad Pro: 量化市场操作系统 终身访问限时 70% 折扣 - 加入 2,000+ 交易员社区 为什么大多数交易者即使拥有“完美”指标也会失败? 因为他们在真空中交易 单一概念 。没有背景的信号是赌博。要持续获胜,您需要 共振 (CONFLUENCE) 。 RelicusRoad Pro 不是一个简单的箭头指标。它是一个完整的 量化市场生态系统 。它描绘价格运行的“公允价值之路”,区分市场噪音和真实的结构性突破。 停止猜测。开始用机构级“路”逻辑进行交易。 核心引擎:“Road” (路) 算法 系统的核心是 Road Algo ,一个实时适应市场条件的动态波动率通道。它投射出 安全线 (平衡) 和价格可能反转的 扩展水平 。 Simple Road: 典型市场的标准结构映射。 Smooth Road: 针对震荡盘整的降噪计算。 Breakout Road: 专为识别波动率扩张和爆发性走势而调整。 1. 算法动量与确认 我们的“剥头皮箭头”不只是简单的交叉。它们利用 高阶多项式逻辑 过滤噪音,确保信号与主周期一致。我们检测动量、价格行为和 Road 结构汇聚的精确入场
Fusion Monthly Levels + PinBar + Marubozu 说明 这个独特的指标将三种强大的技术分析工具融合为一体: 月度关键水平 (高点, 低点, 开盘价, 收盘价) —— 用于识别关键支撑与阻力区域。 PinBar 识别 —— 一种可靠的反转形态,提示价格的强力拒绝。 Marubozu 识别 —— 强烈的趋势型K线,显示出明显的方向性动能。 通过这种融合,您将获得一个 直观、全面且高效 的市场预测工具。 优势 融合机构级别水平 + 价格行为 (Price Action)。 清晰的视觉信号:蓝/红箭头表示 PinBar,蓝/红方块表示 Marubozu。 适用于所有交易品种(外汇、指数、加密货币、大宗商品、股票)。 可自定义参数(参考周期、影线大小、箭头样式)。 代码优化,无延迟,即使在多个图表中使用。 完全兼容 MetaTrader 5。 信号说明 看涨 PinBar → 蓝色箭头在K线下方。 看跌 PinBar → 红色箭头在K线上方。 看涨 Marubozu → 蓝色方块在K线下方。 看跌 Marubozu → 红色方块在K线上方。
CGE Trading Suite
Carl Gustav Johan Ekstrom
5 (2)
Institutional-Grade Analytics for MT5 C GE Trading Suite delivers the analytical edge typically reserved for professional trading desks. The platform integrates a full suite of analytical tools into one seamless workflow: dynamic grid mapping, liquidity behavior analysis, ECM, trend lines, MIDAS, trade cycles, and directional channel projections. Together, these provide a unified view of market structure and momentum. Directional clarity is further enhanced by the capital flow index, which meas
AriX
Temirlan Kdyrkhan
1 (4)
AriX Indicator for MT5 A powerful trend-following and signal-evaluation tool AriX is a custom MT5 indicator that combines Moving Averages and ATR-based risk/reward logic to generate clear buy/sell signals. It visualizes dynamic SL/TP levels, evaluates past trade outcomes, and displays win/loss statistics in a clean on-chart panel. Key features include: Buy/Sell signals based on MA crossovers ATR-based SL/TP1/TP2/TP3 levels with visual lines and labels Signal outcome tracking with real-time stat
“ Dynamic Scalper System MT5 ”指标专为在趋势波内进行剥头皮交易而设计。 已在主要货币对和黄金上进行测试,并可与其他交易工具兼容。 提供顺势短线建仓信号,并提供额外的价格变动支持。 指标原理: 大箭头决定趋势方向。 在趋势波内,我们采用一种生成小箭头形式的剥头皮交易信号的算法。 红色箭头代表看涨方向,蓝色箭头代表看跌方向。 敏感的价格变动线会沿着趋势方向绘制,并与小箭头信号协同作用。 信号运作方式如下:当线在适当时刻出现时,将形成入场信号;在出现线时,持仓;线完成后,平仓。 建议的操作时间范围为M1 - H4。 箭头在当前K线上方形成,如果下一根K线已开仓,则不会重新绘制上一根K线上方的箭头。 输入参数 Trend Wave Period - 趋势方向(大箭头)的周期,改变趋势波的时间间隔。值 1 表示趋势方向的最长持续时间,参数值越大,持续时间越短。 Scalper Arrows Period - 信号箭头(小箭头)的计算周期,改变入场信号的生成频率。值 3 表示最频繁的生成频率,参数值越大,箭头频率越低,准确度越高。 这些参数可以根据不同
Footprint 是一款用于分析订单流 (Order Flow) 和成交量的指标。 它有助于在聚类层面识别市场结构,寻找活动增加的关键区域,并直接在图表上使用过滤器,无需不断打开设置窗口。 Footprint 指标功能 Bid x Ask, Delta 聚类图表; 图表上的控制面板; 用于调整过滤器的滑块; Absorption; Initiative; Stacked Imbalances; Big Trades; dPOC / Dynamic Point of Control; Delta; 侧边市场轮廓 (Market Profile); 累计 Delta (Cumulative Delta)。 核心优势 在密集的 Tick 流上快速计算和渲染数据; 图表内管理 — 主要模式和过滤器可直接在图表上切换,无需打开设置; 通过过滤突出显示重要的价格水平和聚类; 视觉信号高亮:吸收、主动性、失衡和大单交易; 按日、周或当前可见范围显示的侧边轮廓; 包含总成交量、Delta 和累计 Delta 的面板。 Footprint 帮助您确定: 重要成交量集中的位置; 主动性压力出现的位置;
Elliott Wave Trend MT5
Young Ho Seo
4 (4)
Elliott Wave Trend was designed for the scientific wave counting. This tool focuses to get rid of the vagueness of the classic Elliott Wave Counting using the guideline from the template and pattern approach. In doing so, firstly Elliott Wave Trend offers the template for your wave counting. Secondly, it offers Wave Structural Score to assist to identify accurate wave formation. It offers both impulse wave Structural Score and corrective wave Structure Score. Structural Score is the rating to sh
Pantera Indicator
Temirlan Kdyrkhan
5 (1)
A tool for on-chart strategy backtesting and performance analysis. A utility for developing, debugging, and testing custom trading ideas and indicator functions. An indicator designed to quickly test trading concepts and visualize the effectiveness of different input parameters. An all-in-one sandbox for testing everything from simple crossovers to complex, multi-condition trading systems.
Transaction Speed MT5
Ivan Stefanov
5 (3)
当然,以下是翻译成中文(简体)的版本: 该指标标出市场中显现出 交易兴趣 的区域,并随后显示 订单积累区域 。它的工作方式类似于大规模的订单簿。 这是为 大资金 打造的指标,性能卓越。市场中有任何兴趣,你都能通过它清晰看到。 (这是一个 完全重写的自动化版本 —— 不再需要手动分析。) 交易速度 是一个全新的概念指标,它显示了市场上大订单 何时 、 何地 聚集,并揭示了其背后的意义。它可以在 非常早期 就检测到趋势的变化。 在外汇市场,所谓的“交易量”实际上是误导性的,因为那指的是价格在单位时间内的变化,因此真正的名称应是“交易速度”。 一切都取决于我们如何思考、如何行动、如何分析。 改变分析范式至关重要。 该指标完全重构了外汇市场上“交易量”的概念,用逻辑方式重新定义并应用,从而成为一个 独特而精准的工具 。 使用方法: 默认情况下,指标处于 自动模式 ,可独立用于任何时间周期。如果你希望切换到手动模式,只需点击 Auto / Manual Mode 按钮即可。 在 手动模式 下,所有计算从 2025年1月1日 开始。你可以根据需要更改该日期,以查看不同的分析结果。 最优数据周期
TrendMaestro5
Stefano Frisetti
note: this indicator is for METATRADER4, if you want the version for METATRADER5 this is the link:  https://www.mql5.com/it/market/product/108106 TRENDMAESTRO ver 2.5 TRENDMAESTRO recognizes a new TREND from the start, he never makes mistakes. The certainty of identifying a new TREND is priceless. DESCRIPTION TRENDMAESTRO identifies a new TREND in the bud, this indicator examines the volatility, volumes and momentum to identify the moment in which there is an explosion of one or more of these da
IVISTscalp5
Vadym Zhukovskyi
5 (6)
iVISTscalp5 — 基于时间的市场预测系统 iVISTscalp5 不是一个普通的交易指标。 它是一个用于 MetaTrader 5 的基于时间的预测系统(timing-based forecasting system),专注于判断市场何时最有可能发生变化,而不仅仅是价格的方向。 与传统指标不同,iVISTscalp5 不仅分析价格、成交量或趋势,还专注于时间周期、市场节奏以及重复出现的时间模式。 ⸻ 核心功能  • 提供精确的时间窗口(timing)  • 基于时间给出 BUY / SELL 预测  • 计算每个时间点的平均潜在收益  • 提供一周的预测  • 支持 120+ 金融工具 ⸻ 核心理念 市场不仅由价格驱动,也由时间驱动 ⸻ iVISTscalp5 — 你的时间优势 我们向您介绍iVISTscalp5指标,它不仅独特,而且在交易操作中也非常有效。该指标基于时间数据,是多年金融市场经验和深入分析的结果。iVISTscalp5指标是手动交易的优秀工具。便利性、简单性和可视化 - 所有的复杂性都隐藏在内部。我们将iVISTscal
ZIVA Signal Intelligence
Hassan Abdullah Hassan Al Balushi
ZIVA Signal Intelligence An Adaptive, Modular Market Intelligence System ZIVA Signal Intelligence is not positioned as a conventional trading indicator. It is a fully integrated, proprietary market intelligence system engineered to deliver structured, high-precision interpretation of price behavior within a controlled analytical environment. Developed through an independent architectural approach, ZIVA does not rely on, derive from, or replicate existing indicators. It represents a standalone
FX Analysis
Lee Teik Hong
FX Analysis is an all-in-one MT5 indicator dashboard that combines eight analytical tools in a single panel, helping traders identify high-probability setups without switching between charts or indicators. Designed for standard forex pairs on MetaTrader 5. Best results on M15 - H4 timeframes when all components are used together as part of the included workflow. Components Volatility Analyzer Displays historical average movement by hour and by day of the week. A real-time Pip Balance shows the
TraderHUD
Justino Porto Neto
TraderHUD — 交易者完整面板 TraderHUD 是一款完整的可视化指标,将交易者在图表上需要看到的所有内容整合在单个文件中:K线计时器、实时点差、可自定义水印、整点标记与价格记录,以及M5蜡烛开始标记。高度可配置,不会使图表显得杂乱。 功能 计时器和点差 当前K线剩余时间倒计时,每500毫秒更新一次——与新Tick无关 实时点差显示在计时器旁边 跟随图表上的价格线移动 智能锚定:当价格接近屏幕底部边缘时,文本自动上移以保持可见 字体、大小、颜色和分隔符完全可配置 整点标记 图表上的垂直线标示下一个整点——市场新资金可能入场的时刻 时间标签显示在线条顶部 在整点时刻自动记录当时价格 在记录价格处绘制永久水平线——可比较每个前一小时的价格位置 价格显示在标签中与时间并列 可配置偏移量:提前或延迟标记若干小时 历史价格线数量可配置(默认:3条) 切换时间周期或重新编译时价格线依然保留 线条颜色、样式和宽度均可配置 M5蜡烛开始标记 仅在低于M5的时间周期(M1、M2、M3、M4)上自动显示 直观标记每根5分钟蜡烛的开始——算法和短线交易者重新定位的时刻 可配置符号/文本(默认:^
Introduction to X3 Chart Pattern Scanner X3 Cherart Pattern Scanner is the non-repainting and non-lagging indicator detecting X3 chart patterns including Harmonic pattern, Elliott Wave pattern, X3 patterns, and Japanese Candlestick patterns. Historical patterns match with signal patterns. Hence, you can readily develop the solid trading strategy in your chart. More importantly, this superb pattern scanner can detect the optimal pattern of its kind. In addition, you can switch on and off individu
SunSignal ML — AI Gold Signals with Multi-Timeframe Confluence SunSignal ML is an advanced AI-powered signal indicator purpose-built for XAUUSD gold trading. It combines a proprietary adaptive trend algorithm with six machine learning models trained on confirmed price pivots to produce high-confidence entry signals with multi-timeframe validation. The indicator runs efficiently on M1, M5 and M15 timeframes and is designed for traders who want precision entries guided by data rather than guesswor
Ace Trend
Mikhail Sergeev
5 (3)
我们为您呈现一个革命性的指标,它改变了趋势交易世界的游戏规则。 该指标旨在重新思考性能并将您的交易体验提升到前所未有的高度。 我们的指标拥有先进功能的独特组合,使其有别于竞争对手。 "真实定价因素"的先进技术即使在最困难和最不稳定的市场条件下也能确保无与伦比的稳定性。 告别不稳定的模式,破碎的指标,欢迎有意识的,受控的交易。 该指标不仅仅是一个美丽的画面! 指标应该将赔率转移到交易者身边,从而赚取利润。 熟悉基于指标信号的交易结果(全自动模式): https://www.mql5.com/zh/signals/2339244 AceTrend在根据RBTI版本的趋势指标排名中排名第一。 AceTrend-最大的盈利能力和交易控制. 我们的指标根据当前市场报价而不是历史来突出盈利能力。 加入革命-释放您的交易经验的潜力! 指标不会在已形成的柱上重绘。 如果柱形已形成,指标读数保持不变。 该指标适用于从M1到MN的任何时间框架。 标准是H1时间框架。 您的反馈非常重要! 您有任何问题,建议,或只是想分享您的意见? 写评论或发送消息-我总是保持联系! 指标参数: PreSets - 如果选择
PredictHUDxGOLD
Kazutaka Okuno
PredictHUD_GOLD — A Future‑Driven AI Line That Moves Before the Market PredictHUD_GOLD is a GOLD‑specialized indicator that runs a true 1‑second AI model internally and visualizes a “leading trend line” directly on your 1‑minute chart. Because the AI reacts before the candlesticks move, you can visually capture reversals, accelerations, and momentum shifts in advance. Key Features 1. Zero Optimization Needed — Market‑Condition Independent PredictHUD_GOLD is powered by an AI model trained o
ARIScalping
Temirlan Kdyrkhan
ARIScalp is a powerful trading companion designed to generate high-probability entry signals with dynamic TP/SL/DP levels based on volatility. Built-in performance tracking shows win/loss stats, PP1/PP2 hits, and success rates all updated live. Key Features: Buy/Sell signals with adaptive volatility bands Real-time TP/SL/DP levels based on ATR Built-in MA Filter with optional ATR/StdDev volatility Performance stats panel (Success, Profit/Loss, PP1/PP2) Alerts via popup, sound, push, or email Cus
Moon Cycle
Navdeep Singh Kaur
使用Jean Meeus天文算法在交易图表上显示月相的技术指标。呈现连续曲线线条,以专业天文台的科学精度表示月球周期。兼容MT5上的任何符号和时间框架,包括外汇、商品、指数和股票。包含信息面板,显示当前月相、月球照明百分比和技术分析参考水平。完全可定制的颜色和样式设置。基于精确天文计算提供实时月相数据,使交易者能够客观地将月球信息纳入市场分析。该工具结合了天文学精确度与金融市场分析,为专业交易者提供科学的月相追踪功能。 ...........................................................................................
当然可以!以下是您提供的文本的中文翻译: 引入   MT4 / MT5 天文指标:您的终极天体交易伙伴 您准备好将交易体验提升到天文高度了吗?不用再寻找,就在我们的革命性 MT4 天文指标中。这个创新工具超越了传统的交易指标,利用复杂的算法提供无与伦比的天文洞察力和精确计算。 指尖上的宇宙信息:   瞻仰一个详尽的面板,展示了一宝藏般的天文数据。了解行星的地理/太阳心坐标,太阳/地球距离,亮度,伸长度,星座,黄道和赤道坐标,甚至是水平坐标——每个细节都经过精心计算并呈现得美轮美奂。指标生成的垂直线对应于时间值,为您的交易旅程提供了宇宙的视角。 行星线条与关系:   在您的图表上欣赏行星线条的魔力,具有可自定义的比例和角度。通过直观的控制面板轻松切换每个行星线条的可见性。通过连结、六分、四分、三分、对冲和逆行等指标,发现行星关系的艺术。在您选择的时间范围内探索这些宇宙构造,使您能够识别重要的交易机会。 揭示甘恩的智慧:   通过受甘恩启发的平方垂直线揭示潜在的反转时机。这种创新修改将甘恩历经考验的原则带入现实,帮助您提前了解市场的转向和趋势。 月亮引导:   在您的图表上优雅地导航月相,
KAZ Kalman Adaptative Zone
Jean Michel A Joffroy
Kalman Adaptive Zones — 量化概率通道(概率带) 不要再猜测价格将走向哪里。开始了解价格在统计意义上“应该”在哪里。 Kalman Adaptive Zones(KAZ)是一款专业量化指标,它在价格周围绘制智能概率通道——这些通道会根据市场环境实时自动适应。 与 Bollinger Bands(布林带)或 Keltner Channels(凯特纳通道)不同,它们依赖固定回溯周期,而 KAZ 结合多层量化分析,使通道真正反映当前市场行为。 工作原理 KAZ 的核心是一个自适应滤波器,它持续估计价格的真实基础趋势,同时过滤噪音,并对真实行情变化保持敏感。 围绕这条中心线,指标构建概率区域,其宽度由两个因素共同决定: 市场不确定性 :滤波器置信区间越大,通道越宽 市场状态不稳定性 :波动结构本身的变化程度,而不仅仅是波动大小 结果是一个“会呼吸”的通道结构:在平稳市场中变窄且精确,在剧烈波动中变宽并更加谨慎。 Stable Bands — 量化优势 KAZ 最独特的功能是 Stable Bands(稳定带)系统 。 大多数通道类指标会在每根K线更新时重新绘制水平,导致交
作者的更多信息
Live Forex Trading EA
Aryaman Shah
3.67 (3)
In trading, the Sell or Buy decision is not easy. You need to perform extensive analysis and wait for a suitable entry. Despite this, the majority of traders struggle to maintain consistency. Here comes my EAI, a bot designed to automatically evaluate and execute trades using its artificial intelligence. It is built to work effectively with or without news trading. The AI-powered bot is designed to learn from its trades, optimizing its strategy daily to enhance accuracy and target profitability
GeniusAI
Aryaman Shah
In trading, the Sell or Buy decision is never easy. You need to perform extensive analysis and wait patiently for the perfect entry, yet despite the hard work, the majority of traders still struggle to maintain consistency. Here comes Genius AI , a bot designed to automatically evaluate and execute trades using advanced artificial intelligence. Built to work effectively in both quiet markets and high-impact news environments, this bot takes the emotion and hesitation out of your trading routine.
筛选:
无评论
回复评论