QuadZig ZZ Semafor 4L Dashboard MT4

QuadZig MT4: 4-Level ZigZag Semafor & Multi-Timeframe Dashboard. Real-time market structure, smart trend mapping & 8-TF analysis for professional MT4 traders.

Most traders lose not because they lack information — but because they have too much of it. QuadZig cuts through the noise by mapping the market’s full structural skeleton across 4 levels and 8 timeframes, all inside one clean, intelligent dashboard.


What Is QuadZig?

QuadZig is a professional 4‑Level ZigZag Semafor Indicator with a built‑in Multi‑Timeframe Market Structure Dashboard for MetaTrader.
Instead of one ZigZag showing one picture, QuadZig runs four structural engines simultaneously, each tuned to a different scale of market movement:

L1 & L2 — The Ripples  
Minor pivots. Ideal for timing entries and intraday reactions.

L3 & L4 — The Tides  
Major structural anchors. These define the moves that truly matter.

Place QuadZig on any chart and instantly see:

Where structure formed

Which levels are active

Which timeframe is driving the market

Whether the market is expanding, reversing, or stalling

All without opening a single extra chart.


The Live Multi‑Timeframe Dashboard

Eight timeframes. One glance. Full picture.

The dashboard updates automatically and displays three critical components for M1 → W1:

🟢 Direction — Green = UP · 🔴 Red = DOWN · 🟡 Yellow = Neutral

 Dominant Level — L1-minor ripple , L2, L3- strong structure, or L4 - major tide

Current Candle — Live bullish / bearish / flat status

No other MTF Semafor tool shows you which structural level is driving the direction.
QuadZig does.


Historic Pivot Dots — Full Transparency

Every ZigZag repaints. QuadZig is honest about it.

When a pivot confirms, QuadZig permanently marks that exact position as a historic dot, color‑matched to its level. Over time, a full trail of confirmed pivots builds behind price.

This gives you:

A transparent view of how pivots form before locking

Automatic identification of key price zones

A verifiable history of every confirmed structural turn

Up to 500 confirmed pivots per level (configurable)


Formation Dots — See the Market Thinking

Enable Formation Dots to watch pivot candidates develop in real time.
See how the algorithm evaluates and rejects potential pivots as price unfolds.

Advanced traders use this to anticipate structural shifts before they confirm.

Both Historic Dots and Formation Dots can be toggled independently.


Your Chart, Your Style

QuadZig adapts to your workflow:

Dots Only — minimalist Semafor view

ZigZag Lines — enable per level (L1 dotted, L2, L3 - solid thinner, L4 solid thick )

Level Control — toggle any of the 4 levels on/off

Focus only on the structure that matters to your strategy.


Alerts — L3 and L4 Only

Get notified the moment a major structural pivot confirms:

Desktop Popup

Sound

Push Notification

Email

Choose alert‑on‑forming‑bar or alert‑on‑close.
Each channel toggles independently.


Lightning‑Fast Performance

Optimized for MetaTrader 4's architecture to ensure ultra-low CPU usage and smooth performance on older terminals while maintaining professional-grade institutional analytics.

High‑Efficiency Data Engine:  
Single‑Pass ATR system processes data once and shares it across all 4 levels.
Up to 75% faster than standard ZigZag tools.

No‑Lag Architecture:  
Heavy calculations run only on candle open, not every tick.

Direct Price Access:  
Reads all 8 timeframes without freezing or stalling.

VPS Optimized:  
Extremely low memory footprint for 24/7 operation.


The 3‑Step Method

Step 1 — Read the Dashboard  
Check H4 and D1. If they agree, that’s your directional bias.

Step 2 — Wait for the Tide  
Look for an L3 or L4 pivot on your chart.
L1 = noise. L2, L3- strong structure. L4 = major structure.

Step 3 — Confirm & Execute  
If adjacent timeframes agree, the structural window is open.
Enter with confidence.


Who Is QuadZig For?

The Overwhelmed Trader — replaces 5+ indicators with one structural map

The Multi‑Timeframe Trader — stop switching charts; see everything at once

The Transparent Trader — historic dots show exactly how pivots formed

The Structure Trader — four levels reveal the market’s full skeletal map

What’s New in Version 1.10

Full Panel Position Control
Side offset

Column spacing

Corner anchor

All X‑axis settings in one place

📏 Row‑by‑Row Vertical Layout
Independent height for each dashboard row

Global vertical shift

 Real‑Time Candle Direction
Updates on every tick — no lag, no delay.

More Visual Tweaks
Separate font, dot, and candle sizes

Optional panel heading

Fully adjustable colors

Your Feedback Matters
If this indicator improves your trading, please leave a 5-star rating and a review.
⭐⭐⭐⭐⭐


Disclaimer Trading involves risk. This indicator provides market analysis, statistical context, and decision-support tools. It does not guarantee profits and should not be used as financial advice. Always use proper risk management and follow your own trading plan.

Introductory Price $59 Available for MT4 and MT5. Early buyers receive all future updates free.

Demo version runs in Strategy Tester only. Live chart access requires rental or full purchase.


推荐产品
Market Structures Pro MT4
Andrei Novichkov
5 (1)
The Market Structures Pro indicator finds and displays 5 (five) patterns of the Smart Money Concepts (SMC) system on the chart, namely: Break Of Structures (BoS)       Change of character (CHoCH) Equal Highs & Lows Premium, Equilibrium and Discount zones with Fibo grid High-high, Low-low, High-low and Low-high extremes Patterns are displayed for two modes - Swing and Internal and are easily distinguished by color on the chart. Internal mode features higher contrast colors, finer lines, and smal
Emotions are a weakness. QHO mathematics is the future of your trading! You know what really truly frustrating?  Information garbage and noise. All those legacy, lagging indicators on the charts look like an attempt to steer a rocket ship with a steam engine. They are useless. They look at the past while the market is already flying forward on next-gen tech. We created QHO. This is not just another indicator. This is pure mathematics crushing market chaos right on your chart. Imagine completely


Features: Sharkfin Alerts Multi-timeframe Multi-currency SM TDI: To show TDI lines with sharkfin levels Zigzag MTF: To see Higher Timeframe trend Detailed blog post and extras: https://www.mql5.com/en/blogs/post/759138 Arrows works on a single timeframe and single currency. But it’s visually helps see that sharkfins. You can also get the simple arrows from mql5 site product: https://www.mql5.com/en/market/product/42405 About Scanner: It is an easy to use simplified scanner. It will show when
American Hunters
Mehmet Ozhan Hastaoglu
This indicator guides you like a hunter. Tacheprofit and StopLoss levels. See the difference in the experiment. Works in all periods. Works at all rates. You can win with this system. The crossing of the mean and the re-test were done according to the rule. You can see the transactions by moving backwards on the strategy test screen. The whole system is automatically calculated.
Quantum VWAP Pro
QUANTUM TRADING SOFTWARE LIMITED
The VWAP indicator is another of our suite of volume indicators and one which was first referred to in 1988 when it appeared in an article entitled “The Total Cost Of Transactions On The NYSE” in the March edition of the Journal Of Finance from that year, which went on to explain its importance, particularly from an institutional perspective, which underpins its significance in appreciating the power and importance of this indicator. In many ways, it is akin to the volume price analysis methodol
ToolBox 360 is the swiss knife of all indicators. It is full packed with useful tools to help you with your trading. It can be used to find best entry and exit points and help you to decide if you should open a trade or not. It shows market trends, candlestick formations outside / inside bars and you can sett time based allerts. Main features: Time based Fibonacci lines Choose a start and end time and the indicator shows you Fibonacci lines within the selected time range including range high a
Cloud Power
Andriy Sydoruk
Implementation of indication of trend movement with moments for potential stops in the Cloud Power indicator. The transition to the shadow warns of a possible reversal. The entry of the price inside the shadow speaks of a flat movement. The indicator tracks the market trend with unmatched reliability, ignoring sharp market fluctuations and noise around the average price. Simple, visual and efficient use. The indicator does not redraw and does not lag. It can be easily used as an independent t
Auto Elliott Engine
Enrique Gauto Sand
Auto Elliott Engine The Auto Elliott Engine is a tool designed for MetaTrader 4 that automates the identification, decomposition, and projection of price structures based on the Elliott Wave Theory. Powered by a pattern-recognition engine, this indicator processes price action to identify market configurations, translating data into structured scenarios. Key Features Multi-Degree Recognition: Analyzes price action across multiple fractal levels. From higher degrees, such as Supercycle or Cycle,
Jerk Trend
Ivan Simonika
Jerk Trend is a new product that allows you to identify the current market phase (uptrend, downtrend or flat). Represents a typical investor strategy that usually indicates a trend change from bearish to bullish. A tool that allows you to determine the direction and strength of a trend. Unlike most indicators, Jerk Trend finds longer-term trends and gives fewer false signals. This indicator displays arrows of different colors depending on the current state of the market and thus signals the us
Touch VWAP MT4
Danrlei Hornke
O Touch VWAP é um indicador que permite calcular uma Média Ponderada por Volume (VWAP) apenas apertando a tecla 'w' no seu teclado e após clicando no candle do qual deseja realizar o calculo, clicando abaixo do candle é calculada a VWAP baseado na minima dos preços com o volume, clicando sobre o corpo do candle é calculado uma VWAP sobre o preço medio com o volume e clicando acima do candle é calculado uma VWAP baseado na máxima dos preços com o volume, voce tambem tem a opção de remover a VWAP
Market Profile
Artem Titarenko
5 (1)
The "Market Profile" indicator displays the profiles and volumes of periods – weekly, daily, session (8-hour), 4-hour, hour, summary. The VAH/VAL price area is automatically highlighted by a dotted line for each profile (except for the summary). The indicator includes chroma Delta, which colors the profile areas. The areas of prevailing Buys is colored in green, that of Sells - in red. The intensity histogram features blue/red respectively. In the filter mode, the indicator displays the volume a
Smart Session Monitor
Mauricio Tiago Ezequiel Speroni Barboza
Smart Session Monitor Smart Session Monitor is an MT4 indicator designed to display the main trading sessions directly on the chart. The indicator highlights Tokyo, London and New York sessions using transparent background zones, allowing the trader to keep the chart clean and readable. The indicator also includes a compact information panel with ATR, spread and candle timer data. The session schedule is based on GMT time and is automatically adjusted to the broker server time. Main Features Dis
Range Exhaustion
Robert Gerald Wood
当价格达到或超过当前期间的预期范围时,范围耗尽就会发生。在这些水平上,价格开始失去相对于该时期早些时候的动力,因此最好确保您没有建立新头寸。 该指标将向您显示图表上可能发生这种情况的位置,显示每日、每周和每月的水平。 当您看到价格超过这些耗尽水平时,它告诉您移动背后的势头非常强劲,并且可能会走向更高的时间框架水平。 该指标可以使用平均真实范围 (ATR) 或平均范围 (ADR) 计算,具体取决于您的偏好。默认情况下,我们使用 ATR,因为我们发现它在外汇图表上效果更好,但 ADR 在基于股票的指数和符号上确实具有优势。 该指标有多种绘图模式,如下所述,您可以根据自己的需要对其进行定制。 设置 计算模式 选择 AverageTrueRange (ATR) 或 AverageDailyRange (ADR) 来计算水平。 绘图模式 该指标可以以不同的方式显示。 - 绘制价格调整线 - 水平根据达到的高点和低点在整个时期内调整。这是默认且最常用的方法。 - Draw Expected Maximum   - 该水平是一个固定值,是最后一个收盘价加上或减去 ATR 或 ADR 值。 - 绘制
The indicator allows you to trade binary options. The recommended time frame is М1 and the expiration time is 1 minutes. The indicator suitable for auto and manual trading. A possible signal is specified as a arrows above/under a candle. You should wait until the candle closes! Arrows are not re-painted Trade sessions: London and New York section Currency pairs: AUD/CAD Working time frame: M1 Expiration time: 1 minute The indicator also shows good results when using the martingale strategy - "Ma
FREE
Full detailed blogpost is here: https://www.mql5.com/en/blogs/post/770442 Abiroid Genesis Matrix Scanner: Complete User Guide This strategy uses four complementary indicators working together to identify trend momentum: TVI, CCI, T3, GannHiLo and when all four agree, the signal carries considerably more weight than any single indicator could on its own. This scanner takes that concept and applies it across multiple pairs and timeframes simultaneously, surfacing only the moments worth paying att
A technical indicator that displays information about the trading volume in the form of a histogram of distribution by price levels. It is used as an independent indicator that helps to evaluate the current objective situation of the instrument, as well as in the format of integration with other methods of analysis, to confirm or filter when making trading decisions. Key Features: Interactive profile update, real-time work Five modes of histogram calculation The possibility of separating the vol
The indicator allows you to trade binary options. The recommended time frame is М1 and the expiration time is 1,2,3 minutes. The indicator suitable for auto and manual trading. A possible signal is specified as a arrows above/under a candle. You should wait until the candle closes! Arrows are not re-painted Trade sessions: TOKYO section (Half-end) Currency pairs: USD/JPY Working time frame: M1 Expiration time: 1,2,3 minutes. The indicator also shows good results when using the martingale strateg
FREE
该指标基于离散哈特利变换。使用此转换允许您在处理金融时间序列时应用不同的方法。该指标的一个显着特点是它的读数不是指图表上的一个点,而是指指标周期的所有点。 处理时间序列时,指标允许您选择时间序列的各种元素。过滤的第一种可能性是建立在这种方法上的——所有不必要的高频分量都被简单地丢弃。第一个图展示了这种方法的可能性,选择CutOff参数,可以选择原始时间序列的细节(红线-只剩下主要信息CutOff = 0,黄色-主要和最低频率周期CutOff = 1 , 蓝色 - 所有最高频的噪声都被丢弃 CutOff = 4 )。然而,这不是唯一的可能性——噪声分量可以通过额外的过滤来抑制。 这两个选项都在该指标中实施。它的参数是: iPeriod - 指标周期 Shift - 指标相对于当前柱的偏移。通过更改此参数,您可以评估指标过去的表现。 NoiseReduction 是一种降低噪音的方法。可能的值:none - 不抑制噪声(在这种情况下只有 CutOff 参数起作用),constant - 噪声通过常数衰减,linear - 线性噪声抑制,对数 - 对数衰减,square - 根据平方根进行
Cancer
Vitalii Zakharuk
Cancer indicator is great for trend trading! An intelligent indicator algorithm with high probability shows the points of potential market reversal. If you are trading in a trend, then a trading strategy built on the basis of this indicator is perfect for you. The indicator filters out market noise, almost everything and all the necessary functions for working with a thread are built into one tool. It works on all currency pairs and on all timeframes, indicator setting - according to your desire
Ska ZigZag BuySell
NKATEKO VUKOSI LEROY MASANGO
Ska ZigZag BuySell indicator determines the overbought and oversold regions within a trend. The indicator determines the overbought region by the candlestick high and the oversold region by the candlestick low. This indicator only gives signals with arrow and audible alerts each and every time when a new candlestick appear. To utilize the full strategy i recommend using "Ska ZigZag BuySell" together with "Ska ZigZag Line". The Ska ZigZag Line indicator is available for free. NOTE: Indicator is h
VWAP Indicator MT4
Kyra Nickaline Watson-gordon
5 (2)
Description : VWAP (Volume-Weighted Average Price) is the ratio of the value traded to total volume traded over a particular time horizon. It is a measure of the average price at which pair is traded over the trading horizon. Read More. All Symbols and All Timeframes are supported. Indicator Inputs :     VWAP Mode : Mode of VWAP Calculation. Options can be selected : Single,Session,Daily,Weekly,Monthly     Volumes : Real Volumes,Tick Volumes     Price Type : Used price for calculating.
TMA AI Bands
Monique Ellen Miranda Dos Santos
每日趋势黄牛 (DTS) 该指标是 RPTrade Pro Solutions 系统的一部分。 DTS 是使用价格行为、动态支撑和阻力的每日趋势指标。 它旨在供任何人使用,即使是绝对的交易初学者也可以使用它。 从不重新粉刷。 指示是从接近到接近给出的。 设计为单独使用,无需其他指标。 在一天开始时为您提供趋势和潜在的获利。 它是如何工作的 DTS 正在使用结合价格行为和动态支撑和阻力的突破策略。 分析夜间趋势和波动性以在第二天使用。 通过该分析确定突破限制(蓝色和深橙色线)以及止盈 由于历史数据,可以立即检查策略和设置的“成功”。 历史部分允许立即查看策略中是否存在任何“漏洞”,并最终选择另一个更适合的时间框架或符号。 实时从蜡烛收盘到蜡烛收盘,趋势指标等待信号条件有效,然后通过箭头显示(绿色表示买入,橙色表示卖出)。 红色点划线显示了止盈和最终止损的位置。 交易是一一指示的,永远不会同时进行两笔交易。 大多数交易(80%)在白天完成。 DTS 表示: 对于购物车上所有选定的符号: 在哪里打开您的交易。 获利和止损。 可以捕获的潜在点数。 DTS 作品 如果报价是隔夜提
Leave a review for this product, and receive another "Free" product that you choose. You can see my other products here: https://www.mql5.com/en/users/zakri/seller Harmonic Patterns Detector indicator draws harmonic patterns on chart. Harmonic patterns have a high hit-rate of around 80% and are excellent for trade entries. They are used as price reversal points. Some of them have a long history of usage and were created by famous traders like H. M. Gartley. Many harmonic patterns are included
Master Volume profile
Israr Hussain Shah
Money Flow Profile MT5 HERE   Here   our more valuable tools SMC Trend Trading   ,  Easy SMC Trading  ,  Institutional SMC Architect Volume Analysis Tools  ,  Volume flow Profile  ,  Market volume profile  , FVG with Volume  , Liquidity Heatmap Profile  ,  Volume Spread Analysis This Master Edition is engineered for clarity and speed, featuring a unique Auto-Theme Sync system that instantly beautifies your chart layout upon loading. Key Features: True Money Flow Calculation: Goes beyond stand
GTAS FibTdi
Riviera Systems
GTAS FidTdi is a trend indicator using combination of volatility and potential retracement levels. This indicator was created by Bernard Prats Desclaux, proprietary trader and ex-hedge fund manager, founder of E-Winvest. Description The indicator is represented as a red or green envelope above or under prices. How to use Trend detecting When the envelope is green, the trend is bullish. When it is red, the trend is bearish. Trading Once a trade is opened, GTAS FibTdi shows retracement zones wh
FREE
GeoWprPro
Georgij Komarov
WPR by Profile, or WPR for Professionals Geo_WprPro is one of the well-known currency profile indicators. It simultaneously displays two WPR indicators with different parameters in the matrix form on all timeframes of multiple currency pairs forming the currency profile . As follows from the description, " WPR is a leading indicator that often goes ahead of the price chart. The oscillator frequently reaches extreme values before the price reversal as if anticipating that event: it almost always
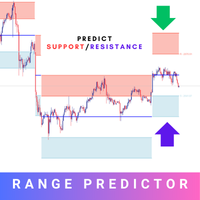
Range Predictor
Suvashish Halder
Introducing the Range Predictor : Your Ultimate Guide to Future Trading Ranges! Imagine having the power to see into the future of market moves— Range Predictor brings this dream to life. Designed to deliver real-time, predictive support and resistance levels , this tool goes beyond standard indicators, offering trend direction insights and precise range forecasts . Whether you're a day trader or a swing trader, the Range Predictor is your all-in-one toolkit for mastering the markets. MT5 Ver
Smart Market Analyser
Elias Mtwenge
5 (1)
REMINDER: Early buyers hot price discount: Price subject to rise after first 20 copies. Starting price $65 and final price will be $1275. Secure your discounted copy Now! Smart Money Analyser Indicator User Manual 1. Introduction Welcome to the   Smart Money Analyser Indicator This powerful tool provides traders with comprehensive market analysis by combining various technical indicators to generate actionable trading signals. Designed to be user-friendly, this indicator helps traders of all
Qv2 Stdev
Joao Marcilio
Qv² Stdev is indicator developed based on standard deviation of prices and trading volume. Buy signals are indicated by arrows up. Sell signals are indicated by arrows down. An important detail is that the Qv² Volume has two bands, an upper and a lower, both of which serve as a target for take profit. It is recommended to use it in H1 Can be used in all pairs (I use in Gold). Good Business, in the trending market To find out some more about my work please click here
该产品的买家也购买
M1 Sniper
Oleg Rodin
5 (27)
M1 SNIPER 是一款易于使用的交易指标系统。它是一个专为 M1 时间框架设计的箭头指标。该指标可以作为独立的系统在 M1 时间框架下进行剥头皮交易,也可以作为您现有交易系统的一部分使用。虽然该交易系统专为 M1 时间框架交易而设计,但它也可以用于其他时间框架。我最初设计此方法是为了交易 XAUUSD 和 BTCUSD。但我发现这种方法在其他市场交易中也同样有用。 指标信号既可以顺势交易,也可以逆势交易。我教授一种特殊的交易技巧,帮助您利用指标信号进行双向交易。该方法基于使用特殊的动态支撑位和阻力位区域。 购买后,您可以立即下载 M1 SNIPER 箭头指标。此外,我还为所有 M1 SNIPER 工具用户免费提供下方屏幕截图所示的 Apollo Dynamic SR 指标!这两个指标的组合可以帮助您更轻松、更准确地利用 M1 时间框架进行交易。 购买后请联系我,免费获取交易提示和奖励指标! 祝您交易成功!
Neuro Poseidon MT4
Daria Rezueva
4.8 (45)
Neuro Poseidon is a new indicator by Daria Rezueva. It combines precise trading signals with adaptive TP/SL levels - creating best possible trades as a result! Message me and get  Neuro Poseidon Assistant  as a gift to automize your trading process! What makes it stand out? 1. Proven profitability on all assets and timeframes 2. Only confirmed BUY and SELL signals present on the chart 3. Adaptive TP & SL levels generated by the software for each trade 4. Easy to understand - suitable for all
DayTrader PRO MT4
Davit Beridze
3.5 (4)
DayTrader PRO DayTrader PRO 是一款先进的交易指标,它结合了约翰·埃勒斯 (John Ehlers) 的 Laguerre 滤波器与强大的自动优化引擎。该指标不依赖固定的参数,而是根据最新的市场状况自动搜寻最佳设置,帮助您在无需手动调整的情况下适应不断变化的市场波动。 该指标可生成清晰的买入 (BUY) 和卖出 (SELL) 信号,并提供根据当前市场波动率计算得出的自适应止损 (Stop Loss) 和止盈 (Take Profit) 水平。内置的趋势、效率系数 (Efficiency Ratio)、波动率和蜡烛图过滤功能,有助于剔除低质量的交易设置,从而提高信号的准确性。 实时性能面板会显示当前已优化的设置、利润因子 (Profit Factor)、胜率 (Win Rate)、回撤 (Drawdown) 以及其他交易统计数据。DayTrader PRO 还支持弹出窗口、推送、邮件和声音提醒,确保您不会错过任何交易机会。 主要功能 全自动参数优化 自适应买入与卖出信号 基于 ATR 的动态止损与止盈 支持每日、每周或每月重新优化 内置趋势与市场过滤功能 性能统
Gann Made Easy
Oleg Rodin
4.84 (171)
Gann Made Easy 是一个专业且易于使用的外汇交易系统,它基于使用先生理论的最佳交易原则。 W.D.江恩。该指标提供准确的买入和卖出信号,包括止损和获利水平。您甚至可以使用推送通知在旅途中进行交易。 购买后请联系我,即可免费获得交易指导和超棒的额外指标! 您可能已经多次听说过江恩交易方法。通常 Gann 的理论不仅对于新手交易者而且对于那些已经有一定交易经验的人来说都是非常复杂的东西。这是因为江恩的交易方法在理论上并不那么容易应用。我花了几年时间来完善这些知识,并将最好的原则应用到我的外汇指标中。 该指标非常易于应用。您所需要的只是将其附加到您的图表并遵循简单的交易建议。该指标不断进行市场分析工作并寻找交易机会。当它检测到一个好的入口点时,它会为您提供一个箭头信号。该指标还显示止损和获利水平。 换句话说,当您像先生一样进行交易时,该指标会为您提供最佳江恩建议。江恩亲自告诉你此时此刻该做什么。但最好的部分是您不需要了解任何有关江恩交易原则的知识,因为该指标会为您完成整个市场分析工作。
目前八折优惠! 对任何新手或专家交易者来说都是最好的解决方案! 这个仪表板软件适用于28种货币对。它基于我们的两个主要指标(高级货币强度28和高级货币冲动)。它对整个外汇市场提供了一个伟大的概述。它显示高级货币强度值,货币运动速度和28个外汇对在所有(9)时间段的信号。想象一下,当你可以使用图表上的单一指标观察整个市场,以确定趋势和或剥头皮的机会时,你的交易将得到改善 我们已经在这个指标中建立了一些功能,使你更容易识别强势和弱势货币,同时识别和确认潜在的交易。该指标以图形方式显示货币的强势或弱势是增加还是减少,以及它在所有时间段的表现。 增加的新功能是动态市场斐波那契水平,它适应当前的市场条件变化,这是一个已经在我们的高级货币强度28和高级货币冲动指标中使用的成熟的加分项。 在交易时,总是将弱势货币和强势货币配对,这个新指标将帮助你做到这一点。 用户手册:点击这里  https://www.mql5.com/en/blogs/post/708783 特点  显示每个时间段的ACS28和GAP-speed(冲动)的货币强度值。 列:颜色代码以7种颜色显示货币强度:强势
Beast Super Signal
Florian Zuercher
4.73 (89)
正在寻找可以帮助您轻松识别有利可图的交易机会的强大外汇交易指标? Beast Super Signal 就是您的不二之选。 这个易于使用的基于趋势的指标持续监控市场状况,寻找新的发展趋势或跳入现有趋势。当所有内部策略一致且彼此 100% 融合时,Beast Super Signal 会发出买入或卖出信号,无需额外确认。当您收到信号箭头警报时,只需买入或卖出。 购买后给我留言,让我加入我的私人 VIP 群组! (仅限购买完整产品)。 购买后给我发消息以获取最新的优化设置文件。 此处提供 MT5 版本。 在此处 获取 Beast Super Signal EA。 查看评论部分以查看最新结果! Beast Super Signal 根据您偏好的 1:1、1:2 或 1:3 风险回报率建议入场价、止损和获利水平,让您放心交易。这个 Beast Super Signal 是 100% 不可重新绘制的,这意味着它永远不会重新计算或重新绘制,每次都能为您提供可靠的信号。 Beast Super Signal 指标适用于所有时间范围,包括货币对、指数、商品和加密货币对。 Beast Su
Advanced Supply Demand
Bernhard Schweigert
4.91 (302)
现在优惠 30%! 任何新手或专业交易者的最佳解决方案! 该指标是一款独特、高质量、且价格合理的交易工具,因为我们已经整合了许多专有功能和新公式。 依据此更新,您将能够显示双重时间帧区域。 您不仅可以显示一个较高的时间帧,还可以同时显示图表时间帧,加上更高的时间帧:显示嵌套时区。 供需双方所有交易者都会喜欢它。 :) 重要信息披露 高级供需的最大潜力,请访问 https://www.mql5.com/zh/blogs/post/720245   想象您的交易如何得以改善,是因为您能够精准定位入场或目标位吗? 构建于新的底层算法,它可以更轻松地识别出买卖双方之间的潜在失衡。 这是因为它以图形方式展示供需最强劲区域,及其过去的表现(显示旧区域)。 这些功能旨在帮助您更轻松地发现最佳入场区域和价位。 现在您可以针对您的交易品种和时间帧来优化和编辑区域强度! 高级供需指标适用于所有产品和时间帧。 它是一个新的公式,非常新的功能是两个区域强度函数可由用户输入进行调整! 这在交易中是一大优势。 当您学习如何使用专有功能,例如带有价格游离最小 X 因子的区域强度时,您能够判断该区域强劲与否。 供需
SR Liquidity
Oleg Rodin
5 (2)
SR Liquidity 是一款旨在揭示市场流动性高度集中且价格反应最剧烈的隐蔽区域的交易指标。这些特殊的流动性区域充当着强有力的支撑位与阻力位,为您清晰呈现市场最可能发生反转的位置。 SR Liquidity 指标并非简单地绘制常规的支撑/阻力线,而是通过分析实际的价格行为,识别买卖压力积聚的区域。这些区域实际上是推动市场真实波动的流动性池。通过在图表上直观呈现这些区域,该指标能助您在价格反应发生前预判走势——这意味着它实际上能够预测价格方向可能发生的变化。它将原始的价格行为转化为清晰且具实操价值的市场蓝图,标示出那些可能成为市场转折点的关键价位。 该指标适用于任何交易品种和时间周期——包括外汇、指数、金属、加密货币等。支持任意时间周期。 购买后请联系我,以获取交易指南及免费赠送的优质附加指标!
KURAMA GOLD SIGNAL PRO(MT4)— 7层过滤 · 自动止盈止损 · 质量评分 · 信号历史保存 | 完整的XAUUSD交易系统 实时不重绘。信号出现的瞬间,箭头、入场、止盈、止损当场锁定,之后绝不移动。你交易的就是这个实时信号。而且在v7.20中,每一个真正发出的信号都会自动保存,并在重启后精确还原。 购买者专属赠品 购买永久授权,即可免费获得 AI Zone Radar(价值$59)+ 完整PDF手册。在产品价格之外,额外附赠价值$59的赠品。购买后在MQL5上给我留言即可。 AI Zone Radar: https://www.mql5.com/en/market/product/175834 在黄金交易者社区中被实际使用,因精度与易用性而广受好评。 你的难题 —— 以及解决方案 黄金一天波动$30–$50。你知道机会就在那里。但这些情况是否似曾相识: - 入场太早,价格逆行$10后才朝你的方
Currency Strength Wizard
Oleg Rodin
4.85 (60)
货币强度向导是一个非常强大的指标,为您提供成功交易的一体化解决方案。该指标使用多个时间范围内所有货币的数据来计算这个或那个外汇对的力量。此数据以易于使用的货币指数和货币电力线的形式表示,您可以使用它们来查看这种或那种货币的力量。 您所需要的只是将指标附加到您要交易的图表上,该指标将向您显示您交易的货币的真实强度。该指标还向您显示买卖量压力的极值,您可以在顺势交易时利用这些压力。该指标还显示了基于斐波那契的可能目标。该指标可用于各种交易时间范围。该指标支持各种货币对的交易。 该指标为您提供所有类型的警报,包括推送通知。 购买后请联系我。我将与您分享我的交易技巧,并免费为您提供丰厚的红利指标! 祝您交易愉快,获利丰厚!
Scalper Inside PRO
Alexey Minkov
4.74 (69)
Scalper Inside PRO 帮你分析日内趋势,在入场前就把交易规划好。核心是三套专属策略,让你更精准地读懂市场。信号一出现,指标就自动判断行情方向并计算关键价位,你能提前看到潜在入场点、预期的止损以及多个止盈位。详尽的绩效统计会展示不同品种和策略在历史上的表现,帮你根据当前行情挑选合适的资产。它既可以作为独立的剥头皮工具,也可以融入你的系统,或者作为你自己 EA 的基础。运行于 MetaTrader 4 平台。 指标会直接在图表上标出入场、三个止盈位 - TP1、TP2、TP3 以及一个可选止损。你甚至可以接入自己的箭头指标,检验它们的统计数据和盈利能力。 购买后请直接联系我,即可获得指标的专属附赠 add-ons、更多关于实盘运用的说明,以及把它正确接入你自己交易系统和 EA 的帮助。 指标主要功能 内置三套专属交易策略,可即时切换。 箭头信号出现后即时计算价位:入场以及 TP1、TP2、TP3 多级目标立刻显示,方便你提前规划交易。开启手动或自动计算后,会显示止损位。 三套策略均内置优化模块:自动把参数适配到当前品种和周期,帮你快速筛选资产(仅在实时状态下可用)。 HTF
Atomic Analyst
Issam Kassas
5 (12)
本产品已针对 2026 年市场进行更新,并针对最新 MT5 版本进行了优化。 价格更新通知: Atomic Analyst 目前价格为 $99 。 接下来的 30 次购买 后,价格将上涨至 $199 。 特别优惠: 购买 Atomic Analyst 后,请发送私信给我,即可免费领取 Smart Universal EA ,并将您的 Atomic Analyst 信号转换为自动交易。 Atomic Analyst 是一款不重绘、不回绘、不延迟的 Price Action 交易指标,专为手动交易、清晰信号和 EA 自动化而设计。 User manual: settings, inputs and strategy.      &   User Manual PDF . 它分析价格行为、强度、动能、多周期方向和高级过滤器,帮助交易者减少噪音,避免弱势交易机会,并做出更有结构的交易决策。 该指标将复杂的市场计算转换为简单的视觉信号、彩色K线、趋势读数、止损水平和多个止盈区域,使交易者能够快速理解并应用于真实市场环境。 主要交易用途: 剥头皮和日内交易: 专为快速决策、清晰箭头、提醒、K线
KT Renko Patterns MT4
KEENBASE SOFTWARE SOLUTIONS
2.33 (3)
KT Renko Patterns 可在已经运行的实时 Renko 图表上识别八类形态,并直接在图表中绘制形态结构、止损参考位和斐波那契目标位。 请先准备好 Renko 图表。 MetaTrader 默认不会生成 Renko 图表。请先使用您选择的生成器打开实时 Renko 图表,然后再把本指标加载到该图表。指标只分析 Renko 砖块,不会生成砖块,也不会自动下单。 随着新砖块出现,指标会查找 W-M、Power Pennant、AB=CD、Triple Top 和 Triple Bottom、Double Top 和 Double Bottom、Two Back Strike、ZigZag Bricks 以及 Swing Breakout 形态。每个识别出的形态都会在图表上标注名称并绘出结构,无需逐块手动检查。已经识别的形态会保留在图表上,不会重新绘制。 图表上会显示什么 形态结构: 彩色线条和标签显示形态轮廓及方向。 交易参考: 止损参考位和最多三个斐波那契目标位提供一致的评估位置。 砖块反转: 标记会突出反转砖块,并可在新反转出现时发出提醒。 历史表现: 面板根据已加载的 Re
Smart Trend Trading System
Issam Kassas
4.78 (9)
本产品已针对 2026 年市场进行更新,并针对最新 MT5 版本进行了优化。 价格更新通知: Smart Trend Trading System 目前价格为 $99 。 接下来的 30 次购买 后,价格将上涨至 $199 。 特别优惠: 购买 Smart Trend Trading System 后,请发送私信给我,即可免费领取 Smart Universal EA ,并将您的 Smart Trend 信号转换为自动交易。 Smart Trend Trading System 是一套完整的交易系统,具备不重绘、不回绘、不延迟的特点,专为希望获得更清晰信号、更准确趋势方向以及更有组织交易方式的交易者打造。 Online course , manual and [download presets] . 它将 10 多种交易工具 整合到一个系统中,包括趋势检测、反转区域、Smart Cloud、移动止损逻辑、支撑与阻力、K线着色、提醒以及多周期分析。 该系统旨在帮助您应对不同的市场环境: 趋势市场: 识别主要趋势,发现回调,跟随动能,并通过止损指导和移动止损选项寻找更清晰的入场机会。
BTMM State Engine Pro MT4
Garry James Goodchild
BTMM State Engine Pro by G-Labs — Beat The Market Maker indicator for MetaTrader 4. Asian session range, London and New York kill zones, level progression (L1/L2/L3), peak formation detection (PFH/PFL), entry signals, and a multi-pair scanner from one chart. Stop scanning charts one pair at a time. The State Engine tracks the BTMM daily cycle automatically — Asian box, room boundaries, level blocks, peak formations, and filtered entries — while the scanner dashboard shows level, peak status,
Prop Firm Sniper
Mohamed Hassan
4.33 (6)
Prop Firm Sniper MT4  is a professional market structure indicator that automatically identifies high-probability BUY and SELL opportunities using BOS and CHoCH analysis. Recommended Timeframes: For backtesting, use the indicator on   M5 or M15   for Gold (XAUUSD), and   M15 or H1   for more volatile Forex pairs such as   GBPUSD, USDJPY, EURGBP , and similar markets. CONTACT ME AFTER PURCHASE TO CLAIM YOUR FREE BONUSES! Prop Firm Sniper  is a professional market structure indicator designed t
PZ Divergence Trading
PZ TRADING SLU
5 (2)
棘手的发现和频率稀缺是最可靠的交易方案之一。该指标使用您喜欢的振荡器自动查找并扫描常规和隐藏的发散。 [ 安装指南 | 更新指南 | 故障排除 | 常见问题 | 所有产品 ] 容易交易 发现常规和隐藏的分歧 支持许多知名的振荡器 根据突破实现交易信号 显示适当的止损和获利水平 可配置的振荡器参数 可自定义的颜色和尺寸 按条形过滤大小差异 实现绩效统计 它实现了电子邮件/声音/视觉警报 为了提供广阔的市场前景,可以使用不同的振荡器在同一张图表中多次加载该指标,而不会产生干扰。该指标支持以下振荡器: RSI CCI MACD OSMA 随机 动量 很棒的振荡器 加速器振荡器 威廉姆斯百分比范围 相对活力指数 由于差异可能会扩大很多,尤其是在外汇市场中,因此该指标产生了转折:它在等待交易突破之前等待donchian突破确认差异。最终结果是带有非常可靠的交易信号的重新粉刷指示器。 输入参数 幅度:用于寻找差异的之字形周期 振荡器-选择要加载到图表的振荡器。 突破期-交易信号的突破期,以柱为单位。 发散类型-启用或禁用发散类型:隐藏,常规或两者。 最小散度单位为条形-最小散度单位为条形
Finesia Sniper
Robby Suhendrawan
Finesia Scalper - High Probability & Non-Repainting System Discounted   Price   !!     Secure the Lowest Price Today. Next The price will increase to   250 USD . Are you looking for a powerful, high-probability trading indicator that removes the guesswork from your chart? Finesia Scalper is a professional-grade, 100% non-repainting trading tool designed to provide you with ultimate precision. Built on a proven algorithm, this indicator seamlessly combines three highly effective trading methodolo
Angle Iindicator - 种用于识别方向变化和确认趋势的指标。 它分析价格行为并识别反转点,识别图表上的峰值和谷值。 它支持趋势方向判断。 适用于任何金融工具和时间周期。 内部参数已配置完毕;您只需将指标放置在图表上,并设置“乘数”参数以获得所需结果即可。 该指标会在当前K线图上生成箭头。有时,箭头在K线形成过程中可能会闪烁。K线收盘后,箭头不会在之前的历史K线上重绘。 该指标会在方向变化时发出警报。 可以单独使用,也可以与您的交易系统结合使用。 要正确使用该指标,您必须配置“乘数”参数。 指标的结果取决于反转角度在图表上的生成方式。 “乘数”参数用于构建连续的K线图,从而确定反转点的频率。 0.1 到 100 的取值范围允许您针对任何选定的交易品种或时间周期自定义生成参数。 增加该数值会生成更早的反转信号,这更适合较高的时间周期(M30-H1)或在 M1-M5-M15 周期寻找入场点。 减小该数值会平滑反转和方向信号,使该指标更适合识别趋势。 绿色箭头表示向下方向,蓝色箭头表示向上方向。
Forex Breath System
Oleg Rodin
5 (5)
Forex Breath System 它是一个基于趋势的交易系统,可用于任何市场。您可以将此系统用于货币、金属、商品、指数、加密货币甚至股票。它也可以在任何时间范围内使用。该系统是通用的。它显示趋势并提供趋势箭头信号。当信号出现在趋势方向时,该指标还可以为您提供特殊类型的警报,从而使趋势交易成为一项简单的任务。 该指标非常易于使用,因为它根本不需要处理任何难以理解的设置。 您只需将其附加到图表中即可开始交易。无论您喜欢哪种交易风格,系统都会帮助您了解市场的方向以及趋势方向上可能的入场点。 该系统将对所有交易者有所帮助,无论他们的交易经验水平如何。 该指示器提供所有类型的警报,包括推送通知。 购买后请联系我以获得交易说明和丰厚奖金! 祝您交易愉快、盈利!
RFI levels PRO
Roman Podpora
5 (1)
该指标能够准确显示反转点和价格回落区域。     行业领军人物 。您能洞察新趋势的形成,并以最高的精准度做出决策,掌控每一笔交易。 与……结合时,展现其最大潜力     趋势线专业版   指标  VERSION MT5 该指标显示的内容: 新趋势开始时的反转结构和反转水平及其激活。 显示屏   获利了结   和   止损   风险回报比最低的水平     RR 1:2       。 具有智能减值逻辑的止损。 显示指定指标中两种趋势类型的反转形态。 指标: 根据     趋势线     (全球趋势变化) 潮流专业版     (趋势快速变化) 简单有效   扫描器   实时趋势(新增)。 多时间框架工具筛选。 展示   利润   在 LOGIC AI 信号之后。 以下列出今日走势积极的金融工具。(RB键) 能够为终端启用通知(警报)功能,并向移动设备推送通知。 逻辑人工智能     — 利用人工智能寻找最佳切入点。 只有在启用 MTF(多时间框架分析)模式时,该功能才可用。 兼容性。 当与趋势线指标结合使用时,该指标能发挥其最大潜力。 这     RFI LEVELS PRO    
Dynamic Forex28 Navigator
Bernhard Schweigert
4.43 (7)
Dynamic Forex28 Navigator - 下一代外汇交易工具。 当前 49% 折扣。 Dynamic Forex28 Navigator 是我们长期流行的指标的演变,将三种功能合二为一: 高级货币强度 28 指标 (695 条评论)+ 高级货币 IMPULSE 带警报 (520 条评论)+ CS28 组合信号(奖励)。 有关指标的详细信息 https://www.mql5.com/en/blogs/post/758844 下一代强度指标提供什么? 您喜欢的原始指标的一切,现在通过新功能和更高的精度进行了增强。 主要特点: 专有货币强度公式。  所有时间范围内的平滑和准确的强度线。 非常适合识别趋势和精确进入。 动态市场斐波那契水平(市场斐波那契)。  此指标独有的独特功能。 斐波那契应用于货币强度,而不是价格图表。 适应实时市场活动以获得准确的反转区域。 实时市场动量。  第 9 行显示市场是活跃还是被动。 对于定时交易至关重要。 全面的警报和显示。  每种货币最强的买入和卖出动量。 ​​28 对的双重动量买入和卖出。 超买/超卖警告外部范围和止损。 反转
Advanced Currency Strength28 Indicator
Bernhard Schweigert
4.91 (659)
目前40%的折扣 任何新手或专家交易者的最佳解决方案! 这个指标是一个独特的、高质量的、可负担得起的交易工具,因为我们纳入了一些专有的功能和一个新的公式。只需一个图表,你就可以读出28个外汇对的货币强度!想象一下,你的交易将如何得到改善,因为你的交易是在你的手中进行的。想象一下,你的交易将如何改善,因为你能够准确地确定新趋势或剥头皮机会的触发点? 用户手册:点击这里  https://www.mql5.com/en/blogs/post/697384 这是第一本,原版的! 不要买一个毫无价值的崇拜者的克隆品。 特别的 子窗口中的箭头显示强劲的货币势头GAP将指导你的交易! 当基础货币或报价货币处于超卖/超买区域(外盘斐波那契水平)时,在个人图表的主窗口中出现警告信号。 当货币力量从外围区间回落时,回撤/反转警报。 十字星模式的特别警报 可选择多个时间框架,以快速查看趋势! 货币强度线在所有的时间框架中都非常平稳,当使用较高的时间框架来识别总体趋势,然后使用较短的时间框架来确定精确的入口时,效果非常好。你可以根据自己的意愿选择任何时间框架。每个时间框架都由其自身进行了优化。
UU Bands Win Pro
Santi Dankamjad
Indicator UU Bands สำหรับเทรดเดอร์ ที่ต้องการความแม่นยำ ในการเข้าเทรด หรือ หาจังหวะในการเข้าเทรด ใช้ได้กับทุก ทามเฟรม ข้อมูลของ อินดิเคเตอร์ 1. มี แบนด์ ด้วยกันทั้งหมด 7 เส้น 2. เส้น 3 เส้น ด้านบน เป็นแนวต้าน เคลื่อนที่ แนวต้านที่1 แนวต้านที่ 2 แนวต้านที่3 3. เส้น 3 เส้น ด้านล่าง เป็นแนวรับ เคลื่อนที่ แนวรับที่ 1 แนวรับที่ 2 แนวรับที่ 3 4. เส้นตรงกลาง เป็นเส้นแบ่ง เทรน สีเขียว หมายถึง แนวโน้มขึ้น สีแดง หมายถึง แนวโน้มลง 5. สัญลักษณ์ ลูกศร สามารถนำไปอ้างอิง เป็นจุดเข้าเทรดได้  คำแนะสำหรับการเท
Trend Catcher ind
Ramil Minniakhmetov
5 (11)
趨勢捕捉指標 趨勢捕捉指標結合了作者獨有的客製化自適應趨勢分析指標,用於分析市場價格趨勢。它透過過濾掉短期噪音,並專注於潛在的動能強度、波動性擴張和價格結構行為,來識別真實的市場方向。此外,它還結合了平滑和趨勢過濾等客製化指標,例如移動平均線、相對強弱指標 (RSI) 和波動率過濾器。 您可以在這裡查看實際運行情況以及我的其他產品: https://www.mql5.com/en/users/mechanic/seller 請注意,我不會在 Telegram 上出售 EA 或任何設置,那是騙局。所有設定都可以在我的部落格上免費取得。 重要提示!購買後請立即聯繫我,以獲取使用說明和額外獎勵! 請注意,我不會在 Telegram 上出售 EA 或任何設置,那是騙局。所有設定都可以在我的部落格上免費取得。
IQ Gold Gann Levels
INTRAQUOTES
5 (5)
Presenting one-of-a-kind Gann Indicator for XAUUSD IQ Gold Gann Levels is a non-repainting, precision tool designed exclusively for XAUUSD intraday trading. It uses W.D. Gann’s square root method to plot real-time support and resistance levels, helping traders spot high-probability entries with confidence and clarity. William Delbert Gann (W.D. Gann) was an exceptional market analyst whose trading technique was based on a complex blend of mathematics, geometry, astrology, and ancient calculation
PRO Renko System
Oleg Rodin
5 (31)
PRO Renko Arrow Based System for trading renko charts.  准确的信号交易任何外汇工具. 另外,我将免费提供系统的附加模块! PRO Renko系统是RENKO图表上高度准确的交易系统。该系统是通用的。 该交易系统可应用于各种交易工具。 该系统有效地中和了所谓的市场噪音,打开了获得准确反转信号的通道。 该指标易于使用,只有一个参数负责产生信号。 您可以很容易地使算法适应您感兴趣的交易工具和renko酒吧的大小。 我很乐意通过提供任何咨询支持来帮助所有客户有效地使用该指标。 祝您交易成功!购买后,立即写信给我! 我将与您分享我的建议和我的renko发电机。 另外,我将免费提供系统的附加模块!
Legacy of Gann
Pavel Zamoshnikov
4.83 (12)
The indicator very accurately determines the levels of the possible end of the trend and profit fixing. The method of determining levels is based on the ideas of W.D.Gann, using an algorithm developed by his follower Kirill Borovsky. Extremely high reliability of reaching levels (according to K. Borovsky  - 80-90%) Indispensable for any trading strategy – every trader needs to determine the exit point from the market! Precisely determines targets on any timeframes and any instruments (forex, met
Scalping Explorer is a complete trading system. Our traders have tested and optimized its work for maximum effect. Trading with Scalping Explorer is easy. Open in Metatrader4 windows with currency pairs: EURUSD, GBPJPY, GBPUSD, AUDUSD, USDCHF. We include D1 timeframe on all currency pairs. Add the Scalping Explorer indicator to each window with a currency pair. In the indicator settings, we find the "Signal" parameter and set it to TRUE. Now, as soon as a signal appears on any of the currency p
Ichimoku Scanner Dashboard
Abir Pathak
4.75 (16)
Dashboard uses Ichimoku Strategy to find best trades. Get extra Indicators/Template: And read more about detailed Product Description and usage here: https://www.mql5.com/en/blogs/post/747457 Read more about Scanner Common features in detail here: https://www.mql5.com/en/blogs/post/747456 Features: Price Kumo Breakout Tenkan-Kijun Cross Chikou/CLoud and Chikou/Price Support/Resistance (SR-SS or SR-NRTR) Stochastic OB/OS and back Awesome Oscillator Higher Timeframe Ichimoku Trend Align
作者的更多信息
Enhanced TP SL
Gordana Batic
Instantly see your TP/SL levels with pip distances, profit in account currency, and risk‑reward ratio—fully customizable lines on the chart. Extended Description for Market Listing: The Enhanced TP/SL Indicator transforms your trading experience by displaying Take Profit and Stop Loss levels directly on the chart for each open position. No more guessing - every line shows the exact distance in pips, the expected profit/loss in your account currency, and even calculates the risk‑reward ratio.
FREE
Session lines that are actually correct. Marks Sydney, Tokyo, London, and NY open/close in your broker's local time — with automatic DST adjustment for all three regions. You set your session times once in GMT, toggle DST for Sydney/London/NY, and forget about it. The indicator handles the rest - broker offset, daylight saving, label positioning - all in the background. Clean labels, toggleable sessions, zero CPU drag. Built for traders who need the market rhythm on their chart without the clut
FREE
MTF HighLow
Gordana Batic
MTF High Low indicator displays key price levels across multiple timeframes directly on your chart,  so you always know where the market has been and what levels matter most. The   NY Session High/Low Levels  automatically plot the highest and lowest prices of the New York trading session on your chart. It provides clear horizontal lines for the   Today (TDY) ,   Yesterday (YTD) ,   Week (7D) , and   Month (30D)   sessions, with customizable display options.           Inspired by MTF.HighLow.
FREE
Trades Visualizer
Gordana Batic
4 (1)
TradeVisualizer is a dynamic chart-based indicator for MetaTrader 5, designed to visually display recent trades directly on the chart. It includes: Trade arrows for entry and exit points, color-coded by direction and profit/loss. Dotted lines connecting open and closed trades. Profit/loss labels in pips and currency. Interactive toggle button to show/hide drawings. Trade history panel showing time, ticket, type, lot size, pips, and P/L. Customizable appearance via inputs for colors, fonts, and
FREE
Features: Sydney, Tokyo, London, and New York session lines — open and close Automatic DST adjustment: Australian (Oct–Apr), European (Mar–Oct), US (Mar–Nov). Tokyo fixed, no DST Toggle each session on or off independently Fully customizable: colors, line styles, line width, label size and position Runs on new bar only — no unnecessary recalculations Works on M1 through H1. Disabled on higher timeframes automatically Inputs: Show/hide each session independently Session open and close times in GM
FREE
Trade Visuals
Gordana Batic
Trade Visuals is a dynamic chart-based indicator for MetaTrader 4, designed to visually display recent trades directly on the chart. It includes: Trade arrows for entry and exit points, color-coded by direction and profit/loss. Dotted lines connecting open and closed trades. Profit/loss labels in pips and currency. Interactive toggle button to show/hide drawings. Trade history panel showing time, ticket, type, lot size, pips, and P/L. Customizable appearance via inputs for colors, fonts, and la
FREE
Advanced Trade Information Dashboard –  MT5 Everything I need to know about my account and open positions, right on the chart. I got tired of clicking between the terminal, the trade tab, and the calculator just to check my margin, pip value, or total profit in pips. So I built this dashboard to put it all in one place. What It Shows Total P&L   – Real profit/loss from the positions I care about (filter by symbol, magic number, or include swap/commission). Margin Level   – The one number th
FREE
Enhanced TPSL
Gordana Batic
5 (1)
Instantly see your TP/SL levels with pip distances, profit in account currency, and risk‑reward ratio—fully customizable lines on the chart. Extended Description for Market Listing: The Enhanced TP/SL Indicator transforms your trading experience by displaying Take Profit and Stop Loss levels directly on the chart for each open position. No more guessing - every line shows the exact distance in pips, the expected profit/loss in your account currency, and even calculates the risk‑reward ratio.
FREE
MTF High Low
Gordana Batic
MTF High Low indicator displays key price levels across multiple timeframes directly on your chart,  so you always know where the market has been and what levels matter most. The   NY Session High/Low Levels    automatically plot the highest and lowest prices of the New York trading session on your chart. It provides clear horizontal lines for the   Today (TDY) ,   Yesterday (YTD) ,   Week (7D) , and   Month (30D)   sessions, with customizable display options.           Inspired by MTF.HighLow
FREE
Advanced Trade Information Dashboard –  MT4 Everything I need to know about my account and open positions, right on the chart. I got tired of clicking between the terminal, the trade tab, and the calculator just to check my margin, pip value, or total profit in pips. So I built this dashboard to put it all in one place. What It Shows Total P&L – Real profit/loss from the positions I care about (filter by symbol, magic number, or include swap/commission). Margin Level – The one number that k
FREE
ClearEdge HUD MT4 Market structure, momentum, flow, and trade-quality scoring in one clean trading HUD. ClearEdge HUD MT4 is a professional market-intelligence panel for MetaTrader 4. It helps traders read market direction, structure, momentum, volatility, session context, and trade quality directly beside live price action. Instead of filling the chart with multiple indicators, ClearEdge condenses the key trading conditions into one vertical dashboard and one simple score: 0 to 8 Trade Conflu
MACD FuturePredict Panel Pro MT4 Predictive MACD-style momentum, signal scoring, and execution guidance in one professional trading panel. MACD FuturePredict Panel Pro is an advanced momentum dashboard for MetaTrader 4. It is designed to help traders read market direction, momentum strength, higher-timeframe bias, signal quality, and execution context from one clean on-chart panel. Instead of relying only on a basic MACD crossover, the indicator evaluates momentum pressure, trend condition, vo
Keltner Channel Forecast MT4 is an adaptive predictive indicator that extends standard Keltner Channels into the future, giving traders a clearer view of likely price range and trend direction before the move unfolds. The indicator projects three dotted forecast lines based on current volatility and price structure, creating a visual roadmap of where price may reasonably travel in the coming bars. A built-in dashboard reads trend conditions in plain language, from quiet to active states, and no
Kalman Cone Forecast MT4 Adaptive forecast cone, trend pressure, and exhaustion detection in one clean trading panel. Kalman Cone Forecast is an adaptive predictive indicator for MetaTrader 4. It uses Kalman filter smoothing to reduce market noise, estimate current trend pressure, and project a forward price cone based on live volatility conditions. Instead of showing only a moving average line or a basic volatility band, Kalman Cone Forecast gives you a clearer answer to three important quest
Silent Arrow MT4 Strict closed-candle BUY and SELL signals with quiet multi-stage confirmation. Silent Arrow MT4 is a clean signal indicator for MetaTrader 4, designed for traders who want fewer arrows, stronger filtering, and a quieter chart. Many arrow indicators trigger too often. They react to small price movement, choppy candles, and weak market conditions. Silent Arrow takes the opposite approach. It stays quiet most of the time and only prints a BUY or SELL arrow when several confirmation
Equity Pulse MT4 Real-time equity, drawdown, and portfolio performance tracking in one clean trading panel. Equity Pulse MT4 is a practical account-monitoring indicator for MetaTrader 4. It helps traders see exactly where they stand across today, yesterday, recent days, the current week, month, and year. Instead of checking account history manually or relying only on the terminal’s floating profit number, Equity Pulse gives you a clear performance snapshot directly on the chart. It is designed
ClearEdge HUD MT5 Market structure, momentum, flow, and trade-quality scoring in one clean trading HUD. ClearEdge HUD MT5 is a professional market-intelligence panel for MetaTrader 5. It helps traders read market direction, structure, momentum, volatility, session context, and trade quality directly beside live price action. Instead of filling the chart with multiple indicators, ClearEdge condenses the key trading conditions into one vertical dashboard and one simple score: 0 to 8 Trade Conflue
QuadZig ZZ Semafor 4L Dashboard MTF MT4 Four-level market structure, ZigZag pivots, and multi-timeframe direction in one clean trading dashboard. QuadZig is a professional market-structure indicator for MetaTrader 4. It combines a 4-level ZigZag Semafor system with a compact multi-timeframe dashboard, helping traders see where price has turned, which structure level is active, and whether higher timeframes are supporting the current move. Instead of relying on one basic ZigZag line, QuadZig se
MACD FuturePredict Panel Pro MT5 Predictive MACD-style momentum, signal scoring, and execution guidance in one professional trading panel. MACD FuturePredict Panel Pro is an advanced momentum dashboard for MetaTrader 5. It is designed to help traders read market direction, momentum strength, higher-timeframe bias, signal quality, and execution context from one clean on-chart panel. Instead of relying only on a basic MACD crossover, the indicator evaluates momentum pressure, trend condition, vol
Keltner Channel Forecast MT5 is an adaptive predictive indicator that extends standard Keltner Channels into the future, giving traders a clearer view of likely price range and trend direction before the move unfolds. The indicator projects three dotted forecast lines based on current volatility and price structure, creating a visual roadmap of where price may reasonably travel in the coming bars. A built-in dashboard reads trend conditions in plain language, from quiet to active states, and no
Kalman Cone Forecast MT5 Adaptive forecast cone, trend pressure, and exhaustion detection in one clean trading panel. Kaman Cone Forecast is an adaptive predictive indicator for MetaTrader 5. It uses Kalman filter smoothing to reduce market noise, estimate current trend pressure, and project a forward price cone based on live volatility conditions. Instead of showing only a moving average line or a basic volatility band, Kalman Cone Forecast gives you a clearer answer to three important questi
Silent Arrow MT5 Strict closed-candle BUY and SELL signals with quiet multi-stage confirmation. Silent Arrow MT5 is a clean signal indicator for MetaTrader 5, designed for traders who want fewer arrows, stronger filtering, and a quieter chart. Many arrow indicators trigger too often. They react to small price movement, choppy candles, and weak market conditions. Silent Arrow takes the opposite approach. It stays quiet most of the time and only prints a BUY or SELL arrow when several confirmatio
Equity Pulse MT5 Real-time equity, drawdown, and portfolio performance tracking in one clean trading panel. Equity Pulse MT5 is a practical account-monitoring indicator for MetaTrader 5. It helps traders see exactly where they stand across today, yesterday, recent days, the current week, month, and year. Instead of checking account history manually or relying only on the terminal’s floating profit number, Equity Pulse gives you a clear performance snapshot directly on the chart. It is designed
筛选:
无评论
回复评论