Multi Timeframe Moving Average Kinvest

多时间周期移动平均线指标

使用多时间周期移动平均线指标,更深入地了解市场趋势。这款强大的 MQL5 工具允许您在单个图表上同时显示来自五个不同时间周期的移动平均线。无需在工作区中堆叠多个指标实例,即可从不同角度全面了解价格动态。

主要特点:

  • 多时间周期分析: 在一个图表上显示来自五个不同时间周期(例如,M15、H1、H4、D1、W1)的最多五条移动平均线。

  • 可自定义周期: 轻松设置所有显示线条的所需移动平均线周期。

  • 多种均线类型: 从广泛的移动平均线类型中选择,包括简单移动平均线 (SMA)、指数移动平均线 (EMA)、平滑移动平均线 (SMMA) 和线性加权移动平均线 (LWMA)。

  • 可调节时间周期: 选择您希望监控的任意五个时间周期,提供无与伦比的灵活性。

  • 清晰的可视化: 一目了然地查看多个趋势视角,帮助您识别不同时间周期之间的汇聚或背离。

  • 为 MQL5 优化: 专为 MetaTrader 5 平台开发,确保流畅的性能和可靠性。

无论您是剥头皮交易者、日内交易者还是长期投资者,此指标都能提供市场的整体视图,帮助您做出更明智的交易决策。避免在图表之间切换或添加多个指标的麻烦——在一个清晰的显示中获取您需要的所有信息。


推荐产品
Bom Senso
Adier Antonio Pereira
BomSenso 是一款市场分析指标,专为希望做出更加系统化决策、减少单纯依赖“盘感”的交易者而开发。 它能够同时、综合地分析多个时间周期中的价格行为。系统不会孤立地观察单一时间周期,而是将短期价格动态与更广泛的市场环境以及波浪结构结合起来,从而形成对当前市场状态的综合分析。 每次分析时,系统都会识别与近期历史中已经出现过的行为模式相似的市场结构,并计算其历史上出现延续或反转的概率(买入、卖出或中性)。 除了概率之外,系统还提供: 分析置信度 相似历史案例的准确率 平均预期收益 Forward 验证准确率 当前趋势环境 与重要支撑位和阻力位的距离 波浪层信号,包括当前价格在摆动结构中的相对位置 所有信息都会清晰地显示在图表面板中,并自动更新。当置信度达到用户设定的阈值时,系统还会发出声音提醒。 核心价值 BomSenso 不是一个简单的箭头指标,也不是一个承诺“保证买入或卖出”的系统。 它更像是一个 概率与市场环境过滤器 ,帮助交易者回答这样一个问题: “这种结构,在当前的趋势和波浪环境下,过去是否曾经出现过?而在那之后,市场通常发生了什么?” 通过结合: 市场行为通道分析 同步多时间
SunSignal ML — AI Gold Signals with Multi-Timeframe Confluence SunSignal ML is an advanced AI-powered signal indicator purpose-built for XAUUSD gold trading. It combines a proprietary adaptive trend algorithm with six machine learning models trained on confirmed price pivots to produce high-confidence entry signals with multi-timeframe validation. The indicator runs efficiently on M1, M5 and M15 timeframes and is designed for traders who want precision entries guided by data rather than guesswor
Strong Liquidity Zones
Imoro Abdul-rahaman
Strong Liquidity Zones A professional non-repainting liquidity mapping indicator that detects and scores high-probability imbalance zones and stop-pool zones on the chart. The indicator identifies two core types of liquidity areas: • Imbalance Zones – price gaps (similar to Fair Value Gaps) that act as magnets • Stop-Pool Zones – areas around confirmed swing highs/lows where stop orders typically cluster Each zone receives a dynamic 0–10 score based on volume pressure, zone size, number of tests
FREE
CapitalSol Forex MTF Scanner MetaTrader 5 多时间框架外汇趋势扫描器 CapitalSol Forex MTF Scanner 是一款多品种、多时间框架市场分析指标,旨在直接通过 MetaTrader 5 提供结构化的外汇市场方向概览。 交易者无需逐个打开并检查多个货币对图表。扫描器可以在一个紧凑的仪表板中显示所选外汇品种,并同时分析多个时间框架上的市场方向。 标准仪表板使用 M15、H1、H4 和 D1,并将每个市场和时间框架分类为 BULL、BEAR、NEUTRAL 或 LOADING。 该指标的目的并不是自动做出交易决策,而是帮助交易者更高效地识别不同时间框架之间的趋势一致性和多时间框架共振。 工作原理 趋势分类基于 EMA 20 和 EMA 50。 BULL: EMA 20 位于 EMA 50 上方。 BEAR: EMA 20 位于 EMA 50 下方。 NEUTRAL: 当前没有有效的方向分类。 LOADING: 所需的历史数据或指标数据尚未完全加载。 扫描器使用已经确认并收盘的K线进行分析。因此,趋势分类不会
BW Indicators
Sergei Gurov
A tool for creating Bill Williams indicators Our tool provides the ability to set Bill Williams indicators on a chart with a mouse click. - The Awesome Oscillator (AO) indicator helps to assess the driving force of the trend. - Alligator indicator — determines the current state of the trend and possible entry and exit points. - Fractals indicator — helps to identify significant levels  - Accelerator Oscillator (AC) indicator — shows the change in trend acceleration. - Market Facilitation Index
FREE
Knowledge of the strength and weakness of each currency is vital for every forex trader. Our   Currency Strength Meter indicator   measures the strength of eight major currencies (USD, EUR, GBP, CHF, JPY, CAD, AUD, NZD) by using the Relative Strength Index indicator, also known as RSI. The Currency Strength Meter indicator shows you, simply and quickly, when a currency is oversold, overbought, or in "normal area". This way, you can identify which currency is the strongest and the weakest. Our
Session Indicator — Forex Trading Sessions Visualizer Overview Session Indicator   is a professional MT5 indicator that displays the four major forex trading sessions (Sydney, Tokyo, London, New York) as colored horizontal bands on your chart. Never miss a trading session again! Free Product   |   Works on Any Broker   |   Auto-Detects Timezone Features Auto-Detects Broker GMT Offset Works automatically on any MT5 broker (XM, IC Markets, FXCM, etc.) No manual timezone configuration needed Label
FREE
At the core of the VidyaPearsonFlow Robot lies the synthesis of two key principles : a daptive filtration of market noise and statistical analysis of correlations between major Forex pairs such as EURUSD, GBPUSD, and XAUUSD. This is not merely an algorithm—it is a system that embodies the harmony of mathematical rigor and the flexibility required to operate in the ever-changing market environment. The Essence of the Method: Adaptive Filtration: The system dynamically adjusts to changing market
CacaMerba
Saiful Izham Bin Hassan
CacaMerba Pro 是一款先进的多货币交易系统,采用机构级风险管理和统计过滤设计。该系统利用数学架构测量市场波动率、识别趋势衰竭,并根据资产增长参数动态调整头寸规模。 与盲目加仓的传统网格或马丁格尔系统不同,CacaMerba Pro 使用多层安全结构。它通过计算赫斯特指数来判断市场是处于区间震荡还是趋势行情,确保仅在统计条件有利时执行交易。此外,系统还包含专用的账户保护器,持续监控您的可用保证金、浮动回撤和跨资产相关性,以防止过度暴露风险。 核心优势与特性 Alpha 置信度引擎:系统使用统计概率为每个入场信号进行数学评分。若未达到置信度阈值,则该交易被否决并跳过。 赫斯特指数矩阵:通过在 100 期移动窗口上计算赫斯特指数,系统判断当前市场状态,避免在混乱或不可预测的价格行为中入场。 动态投资组合相关性守卫:EA 会自动扫描多个货币对上的所有持仓。若检测到您对某一基础货币的敞口过大,它将阻止新的高度相关交易,以保护您的保证金。 凯利公式风险规模:对于高级用户,系统可根据当前交易时段的历史胜率和盈利因子,利用凯利公式数学化地调整手数大小。 账户保护器:一个专用
Multi-Timeframe Breakout Pressure and Confirmation Dashboard TAGLINE Track compression, stored pressure, breakout direction, and confirmation in one dashboard. PRODUCT OVERVIEW BreakoutPulse Navigator MT5 is a professional multi-timeframe breakout dashboard for MetaTrader 5. It is designed to detect two different stages of a breakout: 1. Pressure building before the breakout 2. Directional confirmation after price leaves the channel The indicator combines: - Bollinger Band squeeze - ATR
FREE
Multiple Positions MT5 Bot
Jomarch Marfil Asotigue
Kola Utraman v2 Trade — EURUSD Position Manager MT5 i upgrade to next level its high risk so think more before you put it. This Ultra aggresssive massive trade! Put your SL to max and down to smallest lot size like 0.01 and TP to 0.02 usd up this method can you make your dream,.  Change Magicnumber like 77731 to 99 etc, time  frame 1min stop every saturday and sunday so dont closed it wait to come back. thanks me later and see what wish i granted.
Xtrade Trend Detector
Dago Elkana Samuel Dadie
Xtrade Trend Detector is an indicator capable of finding the best opportunities to take a position in any stock market. Indeed, it is a great tool for scalpers but also for Daytraders. You could therefore use it to identify areas to trade, it fits easily on a chart. I use it to detect trends on Big timeframes and take positions on Small timeframes. Don't hesitate to give me a feedback if you test it.
Overview TriParity AfterShock PRO Scanner 是一款用于 MetaTrader 5 的自主判断型仪表盘指标。在本说明中,triad 指三组货币对或三种交易品种之间的关系。Scanner 可在一个面板中查看多个 triad 和多个时间周期,并帮助交易者以更有条理的方式整理观察列表。其目的是减少图表过载、并排比较候选机会,并突出显示值得进一步关注的市场状态。 本产品并不执行三角套利。真正的三角套利需要几乎同时完成三条腿的执行、极低的延迟以及极低的交易成本。Scanner 旨在用于自主判断临时性偏离状态,这些偏离可能会在平价调整之后暂时保留下来。 Functions Scanner 会在多个时间周期上分析所选 triad,并通过 NOWCAST 显示当前状态。NOWCAST 会将形态评级为 A、B、C 或 NG。在这里,NG 表示当前状态并不适合。这些评级表示关注优先级,而不是最终的买入或卖出决定。最终确认应在 Catcher 或执行图表中进行。 7.0 版本为 MTF 单元格增加了更多信息。除评级外,面板还可以显示方向偏向、已接受信号标记、如 MR、T
Fibrillar
Vitalii Zakharuk
It is very easy to use the Fibrillar indicator, since the simplest is to look at the chart and act according to the indications of the colored arrows. The algorithm takes into account the measurement of prices, and this method also focuses on measuring each of the price drops (H / C, H / O, LC, LO) - which gives more detailed information, but also more averaged. When calculating this indicator, logarithmic gains are first calculated at the closing price, which allows you to filter out the tren
AI Signal Trader
Anderson Queto
AI Signal Trader v1.0 Turn Trading Signal Codes into MT5 Trades in Seconds AI Signal Trader v1.0 is a powerful MetaTrader 5 Expert Advisor designed to bridge the gap between AI-generated trading analysis and actual trade execution. Instead of manually entering entry prices, Stop Loss, Take Profit, and pending orders into MT5, simply enter a compatible trading signal code into the EA, preview and validate the setup, then execute it directly from the chart . The EA supports simple compact codes su
Gabus Niveles
Gabriel Antonio Diaz Quevedo
Niveles G: Institutional Levels & Volume Profile Map The Edge of Professional Trading Niveles G is not just another indicator; it is a comprehensive mapping tool that automates the identification of high-relevance institutional zones. Professional traders and algorithms don't react to random prices—they react to specific liquidity anchors. Niveles G plots these anchors automatically, keeping your chart clean and your strategy focused. Why These Levels Are Crucial? In trading, these levels repres
Previous Candle Levels MT5
Wachinou Lionnel Pyrrhus Sovi Guidi
1 (1)
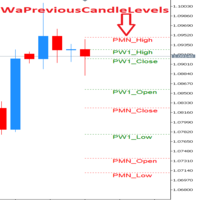
Previous Candle Levels MT5 shows the previous candle levels, it shows the previous candle Open High Low Close levels (OHLC Levels) in different time frame. It's designed to help the trader to analyse the market and pay attention to the previous candle levels in different time frame.  We all know that the OHLC Levels in Monthly, Weekly and Daily are really strong and must of the time, the price strongly reacts at those levels. In the technical analysis, the user can use them as a support and res
FREE
C U Ai
Barrak M B S H Alhaifi
C U ultra - Advanced Market Intelligence & Trend Indicator C U ultra is a professional, all-in-one trading indicator designed for MetaTrader 5, engineered to give traders a comprehensive edge through advanced trend analysis, dynamic channel mapping, liquidity flow tracking, and institutional volume metrics. Whether you are trading Forex, Indices, or Gold (XAUUSD), C U ultra combines automated price action with deep market data to help you spot high-probability entries and exits with maximum cla
DhanrangSMC
Dharagauri Niteshkumar Rangani
SMC Indicator for MT5 – Trade Like Institutions Unlock the power of institutional trading with the Smart Money Concepts (SMC) Indicator for MetaTrader 5 . Designed for traders who want to go beyond retail strategies, this advanced tool helps you identify market structure shifts, order blocks, liquidity zones, and fair value gaps with precision and clarity. Key Features: Automatic Market Structure Detection : Instantly spot Breaks of Structure (BOS), CHoCH, and trend shifts. Multi-Timeframe
Aurum mid quant pro
N'da Lemissa Kouame
AURUM MID-QUANT PRO v5.60 Quantitative Excellence for Gold (XAU/USD) & Volatility Trading Gain a professional edge over institutional markets with AURUM MID-QUANT PRO , an advanced Price Action Pattern Detection and Breakout Engine designed exclusively for MetaTrader 5 . Built specifically to capture the unique volatility of Gold (XAU/USD) and other major financial instruments, this powerful indicator combines high-precision algorithmic pattern recognition with real-time dynamic accumulation z
FXLAND Smart Reversal Indicator (MT5) FXLAND Smart Reversal Indicator is a professional technical analysis tool designed to help traders identify potential price reversal zones and key market turning points with clarity and precision. The best reversal indicator and price return by choosing only one ceiling or floor in each time frame A masterpiece of combining mathematics and Gann, fractal matrix, Fibonacci, movement angle and time. Completely intelligent Key Features Detects potenti
Hello traders, InTech Capital Group here with an important update for you. InTech GoldProp EA PRO is an automated trading system developed by InTech Capital Group for the XAUUSD instrument on the M30 timeframe. The system incorporates institutional-grade risk controls — daily loss limitation, overall drawdown management, and disciplined position sizing — designed to meet the standards required in professional evaluations conducted by Prop Firms , while remaining a suitable solution for individu
Trend Dashboard MTF 在一个简洁的面板中显示所有品种、所有时间周期的趋势方向与强度——一款真正的多时间周期趋势扫描器,基于经典的自上而下分析告诉您应该偏向哪个方向。 不用再来回翻图表。一眼看清整个市场。 无重绘——方向与强度均读取自最后一根已收盘K线,并且只有在终端报告该品种的历史数据已同步后才会读取单元格(在此之前显示加载标记),因此显示的结果不会随每个tick闪烁,也不会事后改变。(需要更早的信号?可开启未收盘K线模式。) 您将看到 - 方向 = 颜色(绿色 = 上涨,红色 = 下跌,灰色 = 盘整) - 强度 = 圆角条形的长度(由 ADX 驱动;条形越长越亮,趋势越强) - 每个品种的交易建议(LONG / SHORT,无方向时显示破折号),并附注:立即进场、等待回调,或在只有您的交易时间周期有方向时显示 M15 only 交易建议的原理(自上而下逻辑) 选择您实际交易的时间周期。面板将时间周期分为 BIAS(决定方向的更高时间周期)和 TIMING(您的时间周期,用于进场)。它按更高时间周期的趋势方向给出交易建议,并告诉您是立即进场还是等待回调。这正
FREE
Eazy Indicator
Isaac Agyei Poku
Forex BUY and SELL signals from the best Heiken Ashi Smoothed indicator. Draw bullish/bearish bars on the chart. Accurate trend detector. Heiken Ashi Smoothed is a simple MT5 indicator that draws bullish and bearish bars in the chart to reflect the direction of the trend. The indicator consists of orange bearish bars and green bullish bars. When the trend changes its direction, the indicator changes its color. The indicator is a modernization of the traditional Heiken Ashi indicator. Moving Aver
Five Point Turn
Brighton Mufaro Mudzingwa
FiveZero Spike & Trend Engine  The Ultimate Non-Repainting Multi-Asset Signal & Pattern System Take control of the markets with an elite, precision-engineered trading indicator designed to capture explosive market moves with extreme accuracy. Built on the powerful 5-0 Harmonic Pattern Structure (0-X-A-B-C) combined with a real-time Bollinger/Structure Block Engine and Reciprocal Ratio Validation, this tool gives you non-repaint buy and sell signals right at the candle open . Whether you trade Fo
The Absorption & Exhaustion Detector Professional indicator is a sophisticated volume analysis tool designed to identify critical market turning points by analyzing the relationship between price movement and cumulative volume delta (CVD). This indicator helps traders spot when price movements lack volume confirmation, indicating potential absorption or exhaustion zones. KEY FEATURES Real-time Cumulative Volume Delta (CVD) calculation and normalization Price-volume divergence gap measurement dis
Manzano SMC Institutional Pro Smart Money Concepts, ICT, historical statistics, market structure and liquidity analysis for MetaTrader 5. Any SMC indicator can draw zones. Manzano SMC Institutional Pro measures how those zones have performed in your market and compares their results against randomly selected price levels. See the structure. Examine the historical evidence. Understand the market context. Manzano SMC Institutional Pro combines Smart Money Concepts (SMC), ICT methodology, Market St
WaveBreaker Pro MT5 —— 市場動能分析領域的佼佼者。 WaveBreaker Pro 是一款高科技綜合交易指標,專為精準視覺化市場結構而設計。它能幫助識別潛在的反轉區域並捕捉強勁的價格動能。其核心演算法建立在經典指標與震盪指標的巧妙結合之上,並經過了深度改良與嚴格測試。 此指標能有效適應各種交易風格-從激進的日內超短線交易(scalping)到穩健的中長期交易,均能游刃有餘。 多週期雷達(12個週期):其獨特架構可同時掃描12個時間週期,讓交易者無需切換圖表標籤頁,即可全面掌握這12個週期內的市場概況。 支撐與阻力:直觀顯示目前的支撐位和阻力位區域,非常適合用於設定停損(Stop Loss)和停盈(Take Profit)訂單。 趨勢斜率分析器(EMA指標):內建儀表板,以度數形式顯示移動平均線的斜率角度。這使您能夠即時評估當前趨勢的真實強度及市場所處階段(是活躍波動還是動能減弱)。 訊號不重繪(Non-Repainting):所有箭頭及關鍵標記均在K線收盤時固定在圖表上,不會發生變動。 終端內音訊提醒:直接在交易平台內播放訊號通知。 行動端推播通知:直接傳送至您智
is a versatile analytical tool designed for both advanced traders and beginners. It combines classic trend line analysis with automatic Fibonacci level plotting to deliver precise market entries and structural clarity. Built as an intuitive and clean on-screen dashboard, this indicator simplifies multi-timeframe analysis without cluttering your main workspace. Technical Analysis and Entry Points The indicator automates the most critical aspects of price action and structural trading: Trend L
Trading Sessions Visualizer 是一款适用于 MetaTrader 5 的清晰实用型交易时段指标。它会在独立的指标窗口中,以彩色条形显示主要全球交易时段。 该指标适合希望快速识别当前活跃市场时段以及即将开始的交易时段的交易者。支持 Sydney、Tokyo、Frankfurt、London 和 New York 交易时段。 界面设计简洁、直观且节省空间。每个交易时段都可以单独启用或禁用。颜色、开始时间、结束时间、条形高度、间距以及显示的历史天数都可以自由设置。 指标还支持交易时段开始和结束时的弹窗提醒与推送通知。也可以启用交易时段开始前的提前提醒功能。 主要功能: - 独立指标窗口显示 - 支持 Sydney、Tokyo、Frankfurt、London 和 New York 交易时段 - 每个交易时段可单独启用或禁用 - 可自定义交易时段颜色 - 可调整开始和结束时间 - 可调整条形高度和间距 - 支持自动或固定窗口高度 - 显示历史交易时段 - 交易时段开始和结束弹窗提醒 - 通过 MT5 手机应用发送推送通知 - 适用于不同交易品种和时间周期
该产品的买家也购买
ARIPoint
Temirlan Kdyrkhan
1 (4)
ARIPoint is a powerful trading companion designed to generate high-probability entry signals with dynamic TP/SL/DP levels based on volatility. Built-in performance tracking shows win/loss stats, PP1/PP2 hits, and success rates all updated live. Key Features: Buy/Sell signals with adaptive volatility bands Real-time TP/SL/DP levels based on ATR Built-in MA Filter with optional ATR/StdDev volatility Performance stats panel (Success, Profit/Loss, PP1/PP2) Alerts via popup, sound, push, or email Cu
ARICoins
Temirlan Kdyrkhan
ARICoin is a powerful trading companion designed to generate high-probability entry signals with dynamic TP/SL/DP levels based on volatility. Built-in performance tracking shows win/loss stats, PP1/PP2 hits, and success rates all updated live. Key Features: Buy/Sell signals with adaptive volatility bands Real-time TP/SL/DP levels based on ATR Built-in MA Filter with optional ATR/StdDev volatility Performance stats panel (Success, Profit/Loss, PP1/PP2) Alerts via popup, sound, push, or email Cust
AriFocus
Temirlan Kdyrkhan
AriFocus - Non-Repainting Buy/Sell Signals AriFocus - one clear signal. AriFocus marks buy and sell signals directly on the chart and suggests a stop-loss level for each one. Every signal is confirmed on bar close and never repaints. - Buy/sell arrows, confirmed on bar close - Suggested stop-loss level for every signal - Trend band and candle coloring to show direction at a glance - 10 ready-made presets, or your own settings (14 calculation methods) - Pop-up, push and email alerts with entr
Meravith Scanner
Ivan Stefanov
5 (3)
MERAVITH SCANNER 是一款适用于 MetaTrader 5 的专业金融市场指标,将多种分析工具整合为一个统一的系统。它基于专有的成交量加权平均价格(VWAP)方法自动完成所有计算,完全消除主观判断。 该指标适用于所有资产类别(外汇、股票、指数、大宗商品、加密货币)以及从 M1 到 Monthly 的所有时间周期。其核心原理是价格跟随成交量。MERAVITH 识别机构资金成交量的集中区域,并从该集中区域中推导出数学上精确的价格水平。它不预测,不推测。它只计算。 使用 MERAVITH SCANNER,您可以在 2–3 分钟内扫描全部 28 个主要外汇货币对的所有时间周期。您也可以扫描任何您选择的市场——例如,大约 100 只股票约需 10 分钟。 该指标计算耗尽水平、平衡线、偏差、统计水平以及目标投射。 图表元素 Origin Point 标记所有计算的起始位置。指标会自动将其放置在最佳位置。红色标签(TOP)表示市场高点并带有看跌倾向。绿色标签(BOTTOM)表示市场低点并带有看涨倾向。 Sentiment Line 是一条动态曲线,反映基于成交量加权计算得出的市场情绪。
AriX
Temirlan Kdyrkhan
1 (4)
AriX Indicator for MT5 A powerful trend-following and signal-evaluation tool AriX is a custom MT5 indicator that combines Moving Averages and ATR-based risk/reward logic to generate clear buy/sell signals. It visualizes dynamic SL/TP levels, evaluates past trade outcomes, and displays win/loss statistics in a clean on-chart panel. Key features include: Buy/Sell signals based on MA crossovers ATR-based SL/TP1/TP2/TP3 levels with visual lines and labels Signal outcome tracking with real-time stat
Volume Arrow Signal Product Description Volume Arrow Signal is a smart trading indicator designed to help traders identify potential buy and sell opportunities using price action, volume behavior, and directional arrow signals. The indicator places clear arrows directly on the chart, making it easy to spot possible market reversals, trend continuations, and entry opportunities without spending hours analyzing charts manually. Whether you are trading Gold (XAUUSD) , Forex pairs, Indices, or Crypt
MasterTrend
Temirlan Kdyrkhan
MasterTrend Indicator for MT5 A powerful trend-following and signal-evaluation tool MasterTrend   is a custom MT5 indicator that combines Moving Averages and ATR-based risk/reward logic to generate clear buy/sell signals. It visualizes dynamic SL/TP levels, evaluates past trade outcomes, and displays win/loss statistics in a clean on-chart panel. Key features include: Buy/Sell signals based on MA crossovers ATR-based SL/TP1/TP2/TP3 levels with visual lines and labels Signal outcome tracking wit
PrimeScalping
Temirlan Kdyrkhan
PrimeScalping is a powerful trading companion designed to generate high-probability entry signals with dynamic TP/SL/DP levels based on volatility. Built-in performance tracking shows win/loss stats, PP1/PP2 hits, and success rates — all updated live. Key Features: Buy/Sell signals with adaptive volatility bands Real-time TP/SL/DP levels based on ATR Built-in MA Filter with optional ATR/StdDev volatility Performance stats panel (Success, Profit/Loss, PP1/PP2) Alerts via popup, sound, push, or e
Pan PrizMA CD Phase
Aleksey Panfilov
The Expert Advisor and the video are attached in the Discussion tab . The robot applies only one order and strictly follows the signals to evaluate the indicator efficiency. Pan PrizMA CD Phase is an option based on the Pan PrizMA indicator. Details (in Russian). Averaging by a quadric-quartic polynomial increases the smoothness of lines, adds momentum and rhythm. Extrapolation by the sinusoid function near a constant allows adjusting the delay or lead of signals. The value of the phase - wave s
Классификатор силы тренда. Показания на истории не меняет. Изменяется классификация только незакрытого бара. По идее подобен полной системе ASCTrend, сигнальный модуль которой, точнее его аппроксимация в несколько "урезанном" виде, есть в свободном доступе, а также в терминале как сигнальный индикатор SilverTrend . Точной копией системы ASCTrend не является. Работает на всех инструментах и всех временных диапазонах. Индикатор использует несколько некоррелируемых между собой алгоритмов для класси
FFx Universal Strength Meter PRO is more than a basic strength meter. Instead of limiting the calculation to price, it can be based on any of the 19 integrated strength modes + 9 timeframes. With the FFx USM, you are able to define any period for any combination of timeframes. For example, you can set the dashboard for the last 10 candles for M15-H1-H4… Full flexibility! Very easy to interpret... It gives a great idea about which currency is weak and which is strong, so you can find the best pai
The FFx Universal MTF alerter shows on a single chart all the timeframes (M1 to Monthly) with their own status for the chosen indicator. 9 indicators mode (MACD-RSI-Stochastic-MA-ADX-Ichimoku-Candles-CCI-PSAR). Each can be applied multiple times on the same chart with different settings. Very easy to interpret. Confirm your BUY entries when most of the timeframes are showing green color. And confirm your SELL entries when most of the timeframes are showing red color. 2 Alert Options : input to s
FFx Watcher Pro MT5
Eric Venturi-Bloxs
The FFx Watcher PRO is a dashboard displaying on a single chart the current direction of up to 15 standard indicators and up to 21 timeframes. It has 2 different modes: Watcher mode: Multi Indicators User is able to select up to 15 indicators to be displayed User is able to select up to 21 timeframes to be displayed Watcher mode: Multi Pairs User is able to select any number of pairs/symbols User is able to select up to 21 timeframes to be displayed This mode uses one of the standard indicators
FFx Patterns Alerter gives trade suggestions with Entry, Target 1, Target 2 and StopLoss .... for any of the selected patterns (PinBar, Engulfing, InsideBar, OutsideBar) Below are the different options available: Multiple instances can be applied on the same chart to monitor different patterns Entry suggestion - pips to be added over the break for the entry 3 different options to calculate the SL - by pips, by ATR multiplier or at the pattern High/Low 3 different options to calculate the 2 TPs -
FFx Basket Scanner MT5
Eric Venturi-Bloxs
MetaTrader 4 version available here : https://www.mql5.com/en/market/product/24881 FFx Basket Scanner is a global tool scanning all pairs and all timeframes over up to five indicators among the 16 available. You will clearly see which currencies to avoid trading and which ones to focus on. Once a currency goes into an extreme zone (e.g. 20/80%), you can trade the whole basket with great confidence. Another way to use it is to look at two currencies (weak vs strong) to find the best single pairs
MetaTrader 4 version available here: https://www.mql5.com/en/market/product/25793 FFx Pivot SR Suite PRO is a complete suite for support and resistance levels. Support and Resistance are the most used levels in all kinds of trading. Can be used to find reversal trend, to set targets and stop, etc. The indicator is fully flexible directly from the chart 4 periods to choose for the calculation: 4Hours, Daily, Weekly and Monthly 4 formulas to choose for the calculation: Classic, Camarilla, Fibonac
ClassicSBA
Umri Azkia Zulkarnaen
this indicator very simple and easy if you understand and agree with setup and rule basic teknical sba you can cek in link : please cek my youtube channel for detail chanel : an for detail info  contact me  basicly setup buy (long) for this indicator is Magenta- blue and green candle or magenta - green  and green candlestik and for setup sell (short) is Black - yellow - and red candle or black - red  and red candlestik
WanaScalper
Isaac Wanasolo
1 (1)
A scalping indicator based on mathematical patterns, which on average gives signals with relatively small SL, and also occasionally helps to catch big moves in the markets (more information in the video) This indicator has three main types of notifications: The first type warns of a possible/upcoming signal on the next bar The second type indicates the presence of a ready signal to enter the market/open a position The third type is for SL and TP levels - you will be notified every time price re
Recommended TimeFrame >= H1. 100% Non Repainted at any moment.  Use it carefully, only with Trend Direction. Trading Usage: 2 Variants: as Range System or as BreakOut System (Both Only With Trend Direction)::: (Always use StopLoss for minimise Risk); [1] as Range System: (Recommended) in UP TREND:  - BUY in Blue Line , then if price goes down by 50 points (on H1) open Second BUY.   Close in any Profit you wish: TrailingStop(45 points) or Close when Price touches upper Gold Line. in DOWN TREND
Spike Detector
Tete Adate Adjete
this indicator is a Spike detector indicator, it is specially designed to trade Boom 1000, Boom 500, Crash 1000 and Crash 500 We recommend using it on Deriv Boom and Crash indices only Its setting is intuitive, familiar, easy to use it has notification functions; audible notifications and push notifications. this tool is simple to use, easy to handle This update is based on different strategies for spikes
Limitless MT5
Dmitriy Kashevich
Limitless MT5 is a universal indicator suitable for every beginner and experienced trader. works on all currency pairs, cryptocurrencies, raw stocks Limitless MT5 - already configured and does not require additional configuration And now the main thing Why Limitless MT5? 1 complete lack of redrawing 2 two years of testing by the best specialists in trading 3 the accuracy of correct signals exceeds 80% 4 performed well in trading during news releases Trading rules 1 buy signal - the ap
Trend and Signals MT5  indicator scans  30 trading Instruments (Forex, Metals and Indices).     It uses special algorithm on the  current market   based on   Pure Price Action   and display the overall trend and signal on the dashboard. When signals are produced the indicator sends alert and notification. Strategy for Signals This indicator uses the daily timeframe to determine the direction of the trend. The hourly timeframe is used to identify possible entries. Main trend and is determined by
Cycles Forecast
Pooriya Alirezaee
This indicator is based on a mathematical formula and an ANN combined, designed to make a model(using previous prices) of the most recent market condition (any chart*) in order to use the model as a forecasting tool. *This indicator can operate on any chart/timeframe, but it's suggested you use multiple timeframes for each trade because this method relies solely on the time factor, you can not use this indicator to predict price volatility, but if it's fit correctly it will show you when the nex
BC Scalper Aroow
Tete Adate Adjete
This indicator is based on the crossing of two Moving Average with the RSI It is intended for scalpers Specially designed for Boom and Crash syhtetic indices from Binary.com/Deriv.com It is easy to use and intuitive. We recommend its use on M1 and is equipped with three types of notification Email alert Sound notification Push notification these parameters can be activated and deactivated.
IVISTscalp5
Vadym Zhukovskyi
5 (6)
[iVISTscalp5]:通过时间研究市场行为的实验室 TLV Framework | Liquidity Activation Points ⸻ 项目概述 iVISTscalp5 是在 VISTmany 项目框架下开发的多层级时间与价格结构指标。 该系统通过 Liquidity Activation Points(时间激活点 / timings)预测: 市场启动时间 方向 运动范围 iVISTscalp5 指标可使用默认参数应用于任何金融工具。 ⸻ 实际价值 iVISTscalp5 并不是作为传统技术指标而开发的。 它的核心理念是: 让任何人都能够通过“时间”研究市场行为。 ⸻ Time Language VISTmany (TLV) — 项目的核心概念 t(p) t(p) 是 timings 被激活的价格水平。 ⸻ p(p) p(p) 是 iVISTscalp5 指标构建的核心价格水平。 最强的市场反应通常出现在: t(p) 与 p(p) 相互作用时。 ⸻ 在 TLV(Time Language VIST
This indicator is a scalping indicator intended solely for the Boom and Crash indices of the Deriv Limited market It supports Boom 500, Boom 1000, Crash 500 and Crash 1000 Not repaint and no bug The settings are intuitive and easy to use The product activation number is 20 The Time Frame used depends on the user If you are an aggressive scalper then just use M1 For long trades use M15 If you are conservative use M5 Please contact me for more details of its use
Recuroid
Andriy Sydoruk
The Recuroid indicator shows very good entry points. Just look at the screenshots, then download the free version and look in the strategy tester and see for yourself. The system is based on two key algorithms. The first algorithm (managed) creates a system of balanced transition from the buy zone to the sell zone and vice versa, draws arrows and lines, and forms entries. The second algorithm (managing) corrects the initial data for the first algorithm (managed) by measuring virtual windows, t
Boom coins indicator and crash coins
Waleed Hamood Said Al Rawahi
YouTube上的指標直播。更多可信度請點擊下面的鏈接。還有指標的視頻可以觀看。注意直播晚了,不要依賴,只有對指標的回顧僅回顧指標的準確性,幾乎不輸,利潤率達到 95%。我將在 CRASH coin 1000 INDICES 上非常準確地工作 YouTube上的指標直播。更多可信度請點擊下面的鏈接。還有指標的視頻可以觀看。注意直播晚了,不要依賴,只有對指標的回顧僅回顧指標的準確性,幾乎不輸,利潤率達到 95%。我將在 CRASH coin 1000 INDICES 上非常準確地工作 YouTube上的指標直播。更多可信度請點擊下面的鏈接。還有指標的視頻可以觀看。注意直播晚了,不要依賴,只有對指標的回顧僅回顧指標的準確性,幾乎不輸,利潤率達到 95%。我將在 CRASH coin 1000 INDICES 上非常準確地工作
MMM Gold Sniper MT5
Gilang Wardhana Purnama Putra
Indicator is based on   Market Maker Strategy.   NO REPAINT. MM's are traders and their objective is to make money.  This includes strategies to trade against retails traders.  The major difference between them and other traders is that they have the ability, through access to massive volumes, to move price at their will.  So to make money, they aim to buy at a lower price and then sell at a higher price. They achieve this by:  1. Inducing traders to take positions. This is achieved by using a
Tatino Super Signals is Non Repaint Indicator for Binary Option trading and Forex trading. Recommendations: Timeframe: All timeframes. For best results we recommend using it on M1, M5 and M15 timeframes. Currency pairs: All Pairs Account type: All Type Broker time: Any Brokers : Alls Binary Trading : Expired 1 Candle Buffer Buy=1, Sell=0, Entry Next Candle Recommended Forex trading stop loss : 15 pips Recommended  Forex tradingTake profit levels : 15 pips Specifications: Does not repaint   Pa
作者的更多信息
多时间周期RSI指标 使用我们直观的RSI指标,释放多时间周期分析的强大功能! 在一个图表上全面了解不同时间周期的市场动量。我们的多时间周期RSI指标允许您在五个可自定义的时间周期中以一致的周期跟踪相对强弱指数(RSI),使您能够做出更明智的交易决策。 主要特点: 同步多时间周期视图: 在一个图表上同时监控多达五个不同时间周期的RSI,无需在窗口之间切换。 可自定义时间周期: 定义您喜欢的时间周期以适应您的交易策略,从M1到MN。 统一的RSI周期: 在所有选定的时间周期中保持一致的RSI计算周期,以便进行直接比较。 清晰的视觉表示: 轻松识别超买/超卖情况以及多个市场周期中的动量变化。 增强的决策制定: 发现时间周期之间的背离和趋同,提供对市场趋势的更深入洞察。 用户友好的界面: 简单直观的设置,可立即使用。 为什么选择我们的多时间周期RSI? 该指标是寻求改善市场分析的交易者不可或缺的工具。通过提供跨各种时间周期的RSI的整体视图,您可以更好地理解资产的潜在强度或弱点,并预测潜在的价格变动。无论您是日内交易者、波段交易者还是长期投资者,该指标都将显著提高您的分析能力。
MQL5季节性分解指标 是一个强大的工具,旨在帮助交易者识别和分析金融时间序列数据中的潜在趋势和季节性模式。通过将价格走势分解为其核心组成部分,该指标提供了更清晰的市场动态视图,从而做出更明智的交易决策。 主要特点: 趋势线: 清晰地可视化市场的长期方向,平滑短期波动。 季节线: 突出显示以固定间隔(例如每日、每周或每月周期)出现的重复模式。 可自定义周期: 用户可以定义 趋势周期 和 季节周期 ,以根据特定的工具和交易策略调整分解。这种灵活性允许在各种时间框架和市场行为中进行分析。 增强市场洞察力: 通过将可预测的季节性影响与潜在的趋势运动分开,更深入地了解价格行为。 该指标对于希望改进技术分析并将周期性模式纳入其交易策略的交易者来说是一笔宝贵的资产。
带内置移动平均线的RSI指标 本指标将相对强弱指数(RSI)与其内置的移动平均线相结合,提供更清晰、更动态的市场动能视图。与容易产生虚假信号的标准RSI不同,这个增强版本可以帮助交易者更有信心地确认趋势和识别潜在的反转。 主要特点: 集成的移动平均线: 该指标直接在RSI线上绘制一个可定制的移动平均线。这使得交易者可以轻松识别趋势变化和确认信号。 早期信号检测: 通过观察RSI与其移动平均线之间的交叉,交易者可以比单独使用标准RSI更早地发现潜在的进场和出场点。 可定制参数: 调整RSI周期、移动平均线周期、移动平均线类型(SMA, EMA等)以及应用价格,以适应您的交易策略。 警报功能: 当发生交叉、超买/超卖情况或RSI线突破特定水平时,接收通知。 用户友好界面: 该指标设计易于使用,并能无缝集成到任何交易策略中。 使用方法: 买入信号: 当RSI线从下方穿过其移动平均线时,尤其是在RSI处于超卖区域时,寻找买入信号。 卖出信号: 当RSI线从上方穿过其移动平均线时,尤其是在RSI处于超买区域时,寻找卖出信号。 趋势确认: 移动平均线作为RSI的动态支撑/阻力水平,确认了潜在趋势的
带信号的移动平均线斜率 这款创新型指标超越了简单的移动平均线,提供了对其斜率的动态而强大的分析。它不仅计算并显示移动平均线的斜率,还计算并显示该斜率的移动平均线,为趋势变化和动能转换提供了高效的信号。这种双层分析可以帮助交易者过滤掉噪音,以更高的精度识别真实的趋势强度和潜在的反转。 主要特点: 双层分析: 该指标绘制主移动平均线的斜率,并在此基础上绘制斜率的第二层移动平均线。这提供了一个更平滑、更可靠的信号。 早期趋势变化检测: 斜率线从正变为负(反之亦然)是趋势变化的一个强大早期预警。斜率与其移动平均线之间的交叉提供了出色的进场/出场信号。 可定制参数: 调整主移动平均线和斜率的第二层移动平均线的周期和类型,以适应您的特定交易风格。 视觉清晰度: 该指标显示在一个单独的副窗口中,带有零线,可以轻松识别正(上升趋势)和负(下降趋势)斜率。 警报功能: 当斜率发生交叉、穿越零线或达到特定的斜率值阈值时,接收通知。 使用方法: 买入信号: 寻找斜率线从下方穿过零线和其移动平均线。这表明趋势正在向上加强。 卖出信号: 寻找斜率线从上方穿过零线和其移动平均线。这表明趋势正在减弱或可能向下反转。
跨时间周期和自定义设置的移动平均线 移动平均线是任何交易者的基本工具。我们先进的 移动平均线 指标超越了标准,为您提供无与伦比的灵活性和控制。该指标允许您在当前图表上显示任何时间周期的移动平均线,提供独特的视角,帮助您发现您可能错过的趋势。 在金融市场分析中,理解不同时间周期(例如,从1分钟图到月线图)的趋势至关重要。传统上,交易者需要不断切换图表来查看不同时间周期的移动平均线。我们的指标通过在一个图表上直接显示所有相关信息,解决了这一痛点。例如,您可以在一个H1(1小时)图表上,同时观察一个D1(日线)移动平均线,从而更好地理解短期价格行为如何与长期趋势相关联。 主要特点: 跨时间周期功能: 在您当前的图表上直接查看任何时间周期(例如,H4、日线、周线)的移动平均线。这使您能够更全面地分析市场,识别更广泛的趋势,并做出更明智的交易决策。 可自定义设置: 轻松调整移动平均线的 周期 、 偏移 和 类型 (SMA、EMA、SMMA、LWMA),以适应您的特定交易策略。无论您是使用短期移动平均线进行剥头皮交易,还是使用长期移动平均线进行趋势跟踪,本指标都能满足您的需求。 直观界面: 该指
Classical and hidden RSI divergence  – MetaTrader 5 高级交易指标 使用专为 MetaTrader 5 设计的专业级指标 RSI Divergence Pro , 充分释放价格行为和动量分析的潜力。 无论你是经验丰富的日内交易员还是系统的波段交易员, 在价格图表显现之前捕捉动量转变, 都是把握高概率市场转折的最可靠方法之一。 该指标以绝对的精准度自动完成了这一复杂的流程。 核心功能与特点: 全面的背离检测: 该指标可自动扫描并识别用于趋势反转的 常规(经典)背离 以及用于趋势延续的 隐藏背离 。 由于算法能够跨所有时间周期和资产类别检测微妙的市场动量变化, 你将不会再错过任何一个交易设置。 双图表可视化: 与仅在独立振荡器窗口中绘制线条的标准指标不同, RSI Divergence Pro 同时在 RSI 子窗口和主价格图表上 直观显示背离。 这种双重视图布局允许你立即将趋势线斜率与K线图上的对应摆动高点和低点联系起来, 从而一目了然地简化你的技术分析。 可定制的警报系统: 无需一整天盯着屏幕也能紧跟市场动态。 该指标配备了完全
Polynomial Regression Pro – MetaTrader 5 高级曲线拟合指标 通过专为 MetaTrader 5 设计的专业级指标 Polynomial Regression Pro , 将先进的数学建模引入你的交易中。 通过将平滑的多项式曲线拟合到历史价格行为中, 该指标可帮助交易者准确识别周期性趋势、 市场转折点以及动态支撑或阻力位。 核心功能与技术亮点: 最小二乘法: 核心数学模型依赖于稳健的普通最小二乘法(OLS)。 这能将残差平方和降至最低, 确保回归曲线以最佳的客观性和精度拟合价格数据。 基于霍纳法则(Horner’s Scheme)优化: 为了保证图表上闪电般的性能且零延迟, 多项式求值通过 霍纳法则 进行了高效计算。 这种数学优化大大减少了乘法运算次数, 即使面对庞大的历史数据集和繁重的多时间周期扫描, 也能确保平滑的计算与渲染。 动态回归通道: 配备了围绕中心回归线绘制的、 完全可调节的上下置信/偏差通道。 这些通道有助于发现超买和超卖的市场极端情况、 潜在突破以及波动率收缩。 完全可定制的参数: 根据你的个人交易策略量身定制指标。 轻
DFA Hurst Trend Strength Pro – MetaTrader 5 高级分形与动量指标 利用专为 MetaTrader 5 开发的尖端技术指标 DFA Hurst Trend Strength Pro , 深入解锁市场动态的底层统计特性。 该高级工具基于去趋势波动分析(Detrended Fluctuation Analysis, DFA), 旨在量化价格波动的自相似性和长期记忆性, 帮助交易者精确测量趋势持续性与市场模式。 核心功能与技术亮点: 去趋势波动分析(DFA)核心: 该指标采用高级统计物理学算法, 消除局部趋势并测量不同时间尺度上的均方根波动。 这能隔离金融数据的底层标度特性, 有效过滤高频市场噪音。 标度指数 Alpha ( $\alpha$ ) 与赫斯特相关性: 通过估计标度指数 $\alpha$ , 该指标可以高度近似赫斯特指数( $H$ )。 这为交易者提供了市场状态的精确数学读数:数值显著高于 0. 5 表明具有持续的强趋势行为;数值低于 0. 5 预示着均值回归或反持续市场;而数值在 0. 5 左右波动则代表随机游走。 实时趋势强度测
筛选:
无评论
回复评论