PZ Candlestick Patterns MT5
- 指标
- 版本: 1.2
- 更新: 21 十月 2020
- 激活: 20

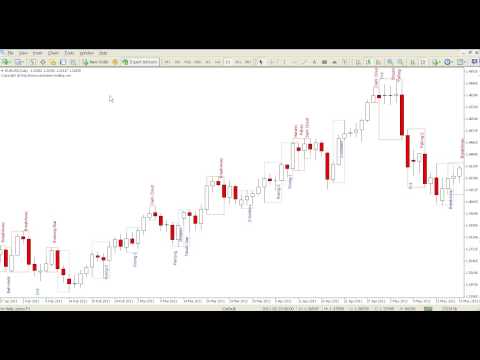
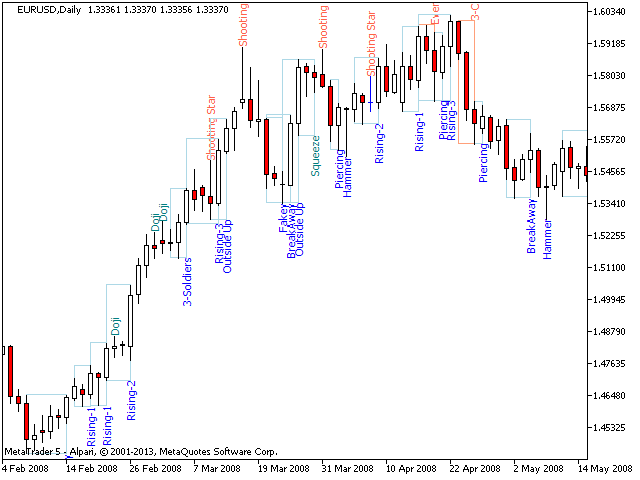
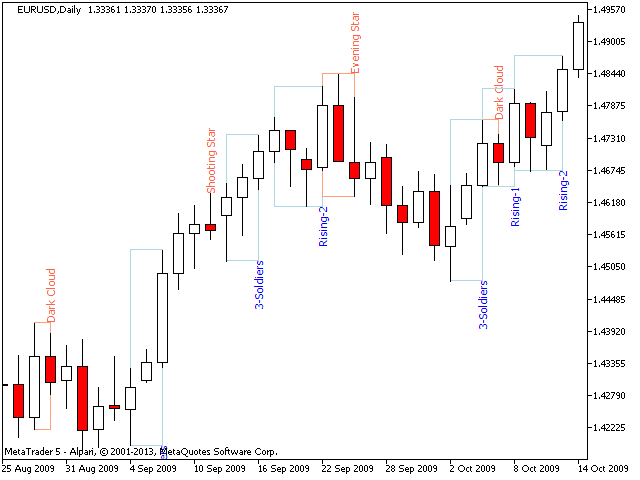
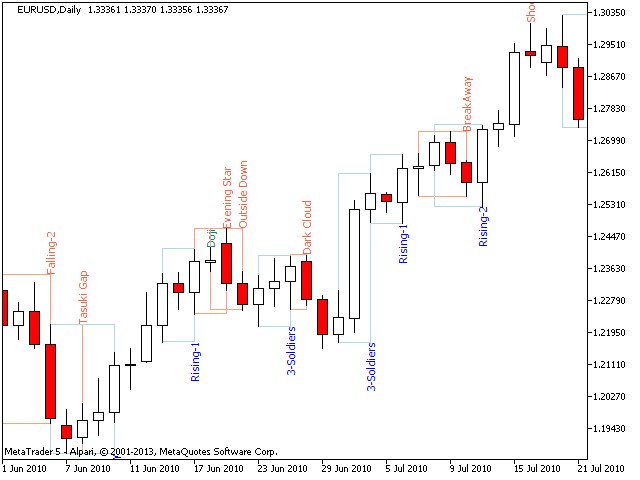
该指标可识别30多种日本烛台图案,并在图表上突出显示它们。这只是价格行为交易者不能没有的那些指标之一。
- 一夜之间增强您的技术分析
- 轻松检测日本烛台图案
- 交易可靠且通用的反转模式
- 使用延续模式安全跳入已建立的趋势
- 指示器不重涂并实施警报
- 该指标实现了一个多时间框架 仪表板
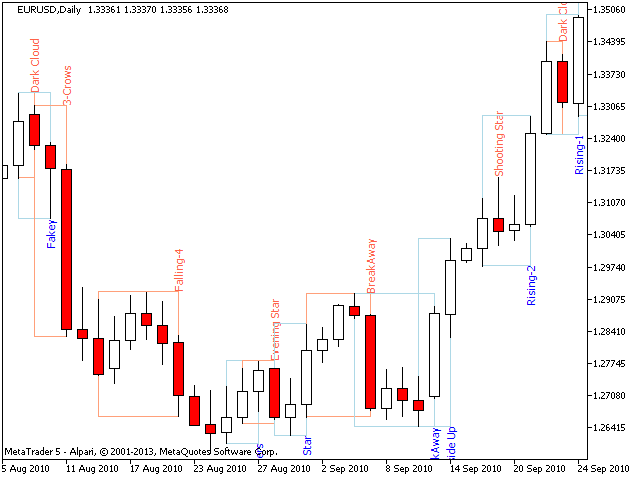
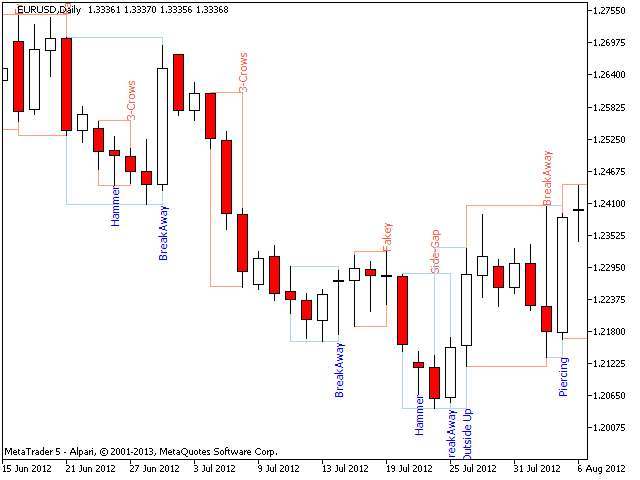
它检测到的模式太多,以至于图表看起来非常混乱,难以阅读。交易者可能需要禁用指标输入中的不良图案,以使图表更具可读性。
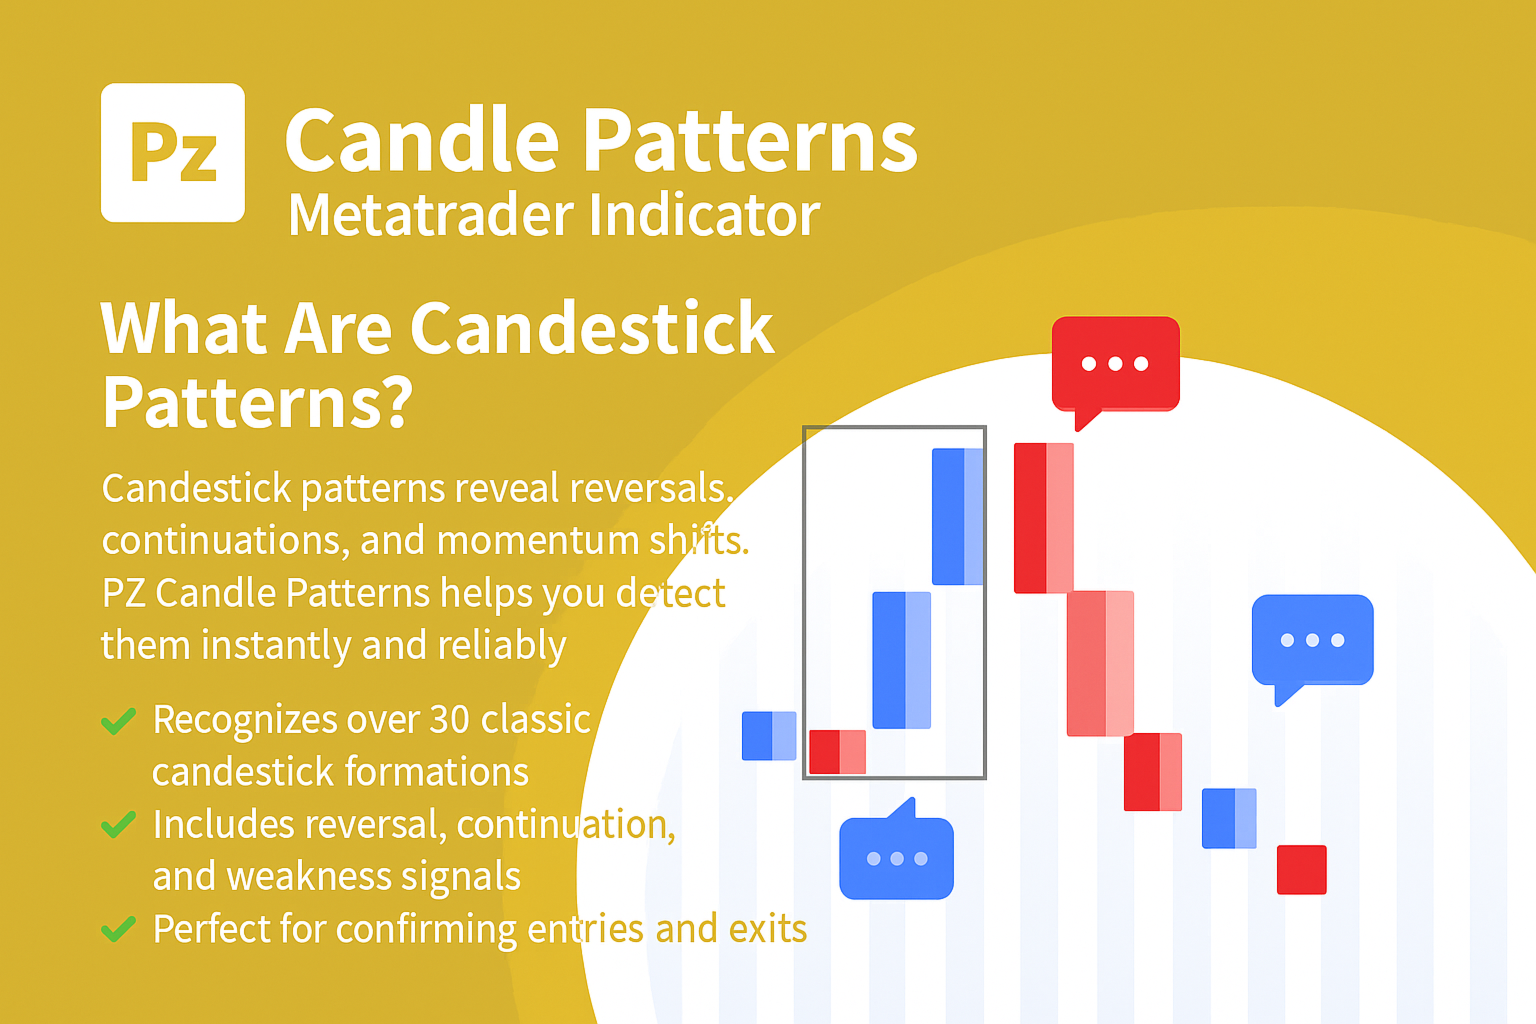
- 它检测1条,2条,3条和多条样式
- 它检测逆转,持续和弱点模式
- 模式可以启用或禁用
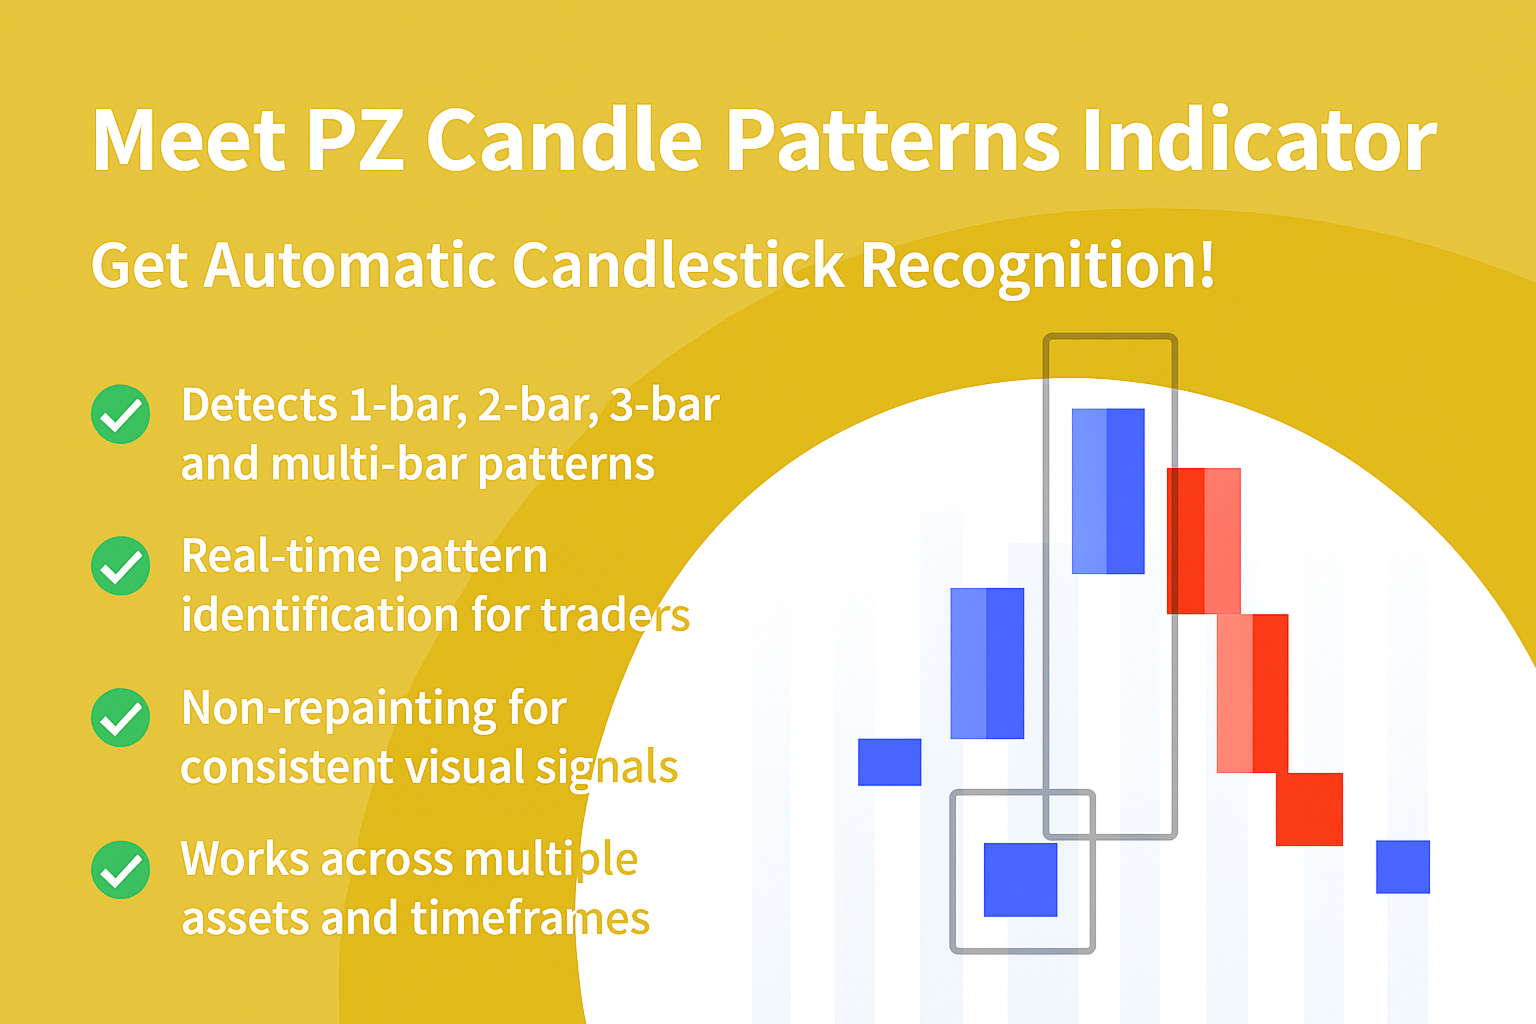
检测到的烛台模式列表
- 从1到5小节的突破距离(又名线罢工)
- 法基(又名Hikkake)
- 反间隙
- 三名士兵/三只乌鸦
- 锤子/流星/吊人
- 吞没
- 外上/外下
- Harami
- 由上至下
- 晨星/晚星
- 踢球者
- 刺穿/乌云
- 皮带托
- 从1到5小条上升三分/下降三分
- 田木峡
- 并排间隙
- 视窗
- 前进块/下降块
- 审议
- Marubozu
- 挤压警报(又称主蜡烛)
- Dojis
设置
- PaintBars
使用条形的颜色打开/关闭图案的突出显示。 - DisplayLabels
显示或隐藏显示已识别模式名称的文本标签。 - BullLabel / BearLabel
为看涨和看跌模式选择文本标签的颜色。 - DisplayRectangles
显示或隐藏识别出的图案周围的框。 - BullRectangle / BearRectangle
为看涨和看跌模式选择矩形的颜色。 - 一杆式
一对一地打开/关闭识别一格模式。 - 2杆式
一对一地打开/关闭识别两个条形图案。 - 3条式
开启/关闭3格图案及其他图案的识别。 - DonchianFilter
此选项仅适用于反转模式。由于反转形态仅在趋势结束时才有效,因此必须放置某种条件才能显示或忽略某些形态。 Donchian过滤器允许我们使用所需的最后一根柱数的最高/最低来过滤任何反转形态。默认行为是忽略低于最后四个柱线最高点的看跌反转形态,并忽略高于最后四个柱线最低点的看涨反转形态。此参数允许您打开/关闭此过滤器。 - ReversalDonchian
评估要显示或忽略反转图案的所需条形数量。 (仅在启用上述选项的情况下适用) - RedundantReversals
市场转向时,反转模式经常会接二连三地发生,这表明随着价格的变化,反转不止一次。例如,经常看到与以下情况非常相似的逆转。牛势锤(第1条),然后是吞噬模式(第2条),外部向上模式(第3天)和三名士兵(第4天),在第一把锤子发生之后,所有这些都是多余的反转模式。如果禁用,则RedundantReversals参数将消除此冗余,并在第一个有效模式后沿相同方向隐藏将来的反向模式。如果您在视觉上对图表进行回测,但对于实时交易而言却不是那么多,则此功能非常有用,因为您希望接收尽可能多的信号-或可能没有交易第一手锤子。确保启用此选项进行实时交易,以便查看所有机会并接收警报。 - 警报
为上述启用的模式启用警报,电子邮件警报和/或声音警报。
作者
ArturoLópezPérez,私人投资者和投机者,软件工程师和Point Zero Trading Solutions的创始人。

用户没有留下任何评级信息