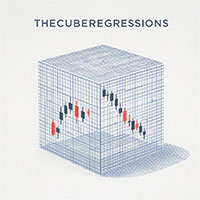
The Cube Theory Indicator

TheCubeTheory - Seu Indicador de Análise de Mercado em Cubos

📌 Descrição Completa 

🔥 O Que é o TheCubeTheory?

O TheCubeTheory é um indicador exclusivo para MetaTrader 5 que mapeia os níveis de suporte e resistência usando uma abordagem inovadora baseada em cubos de tempo e Fibonacci. Desenvolvido pela Ethernal, ele combina:

  • Análise de Máximas e Mínimas em períodos personalizáveis

  • Níveis Automáticos (8 níveis ajustáveis)

  • Visualização em Tempo Real com retângulos e linhas coloridas

Ideal para traders que querem identificar zonas de reversão com precisão matemática.

🎯 Benefícios para o Trader

✅ Precisão Científica:

  • Calcula máximas/mínimas em períodos definidos pelo usuário

  • Projeta níveis  automaticamente

✅ Visualização Clara:

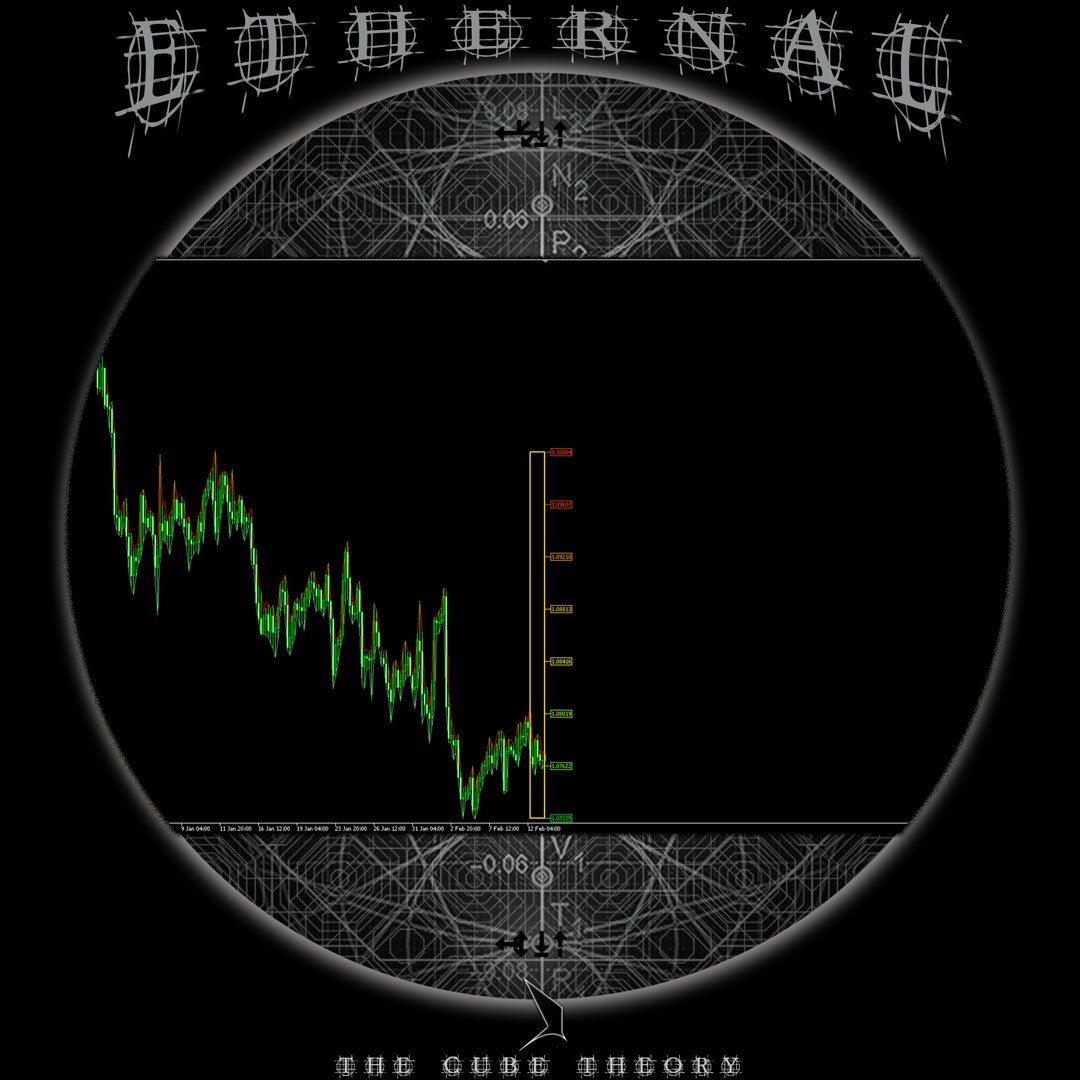
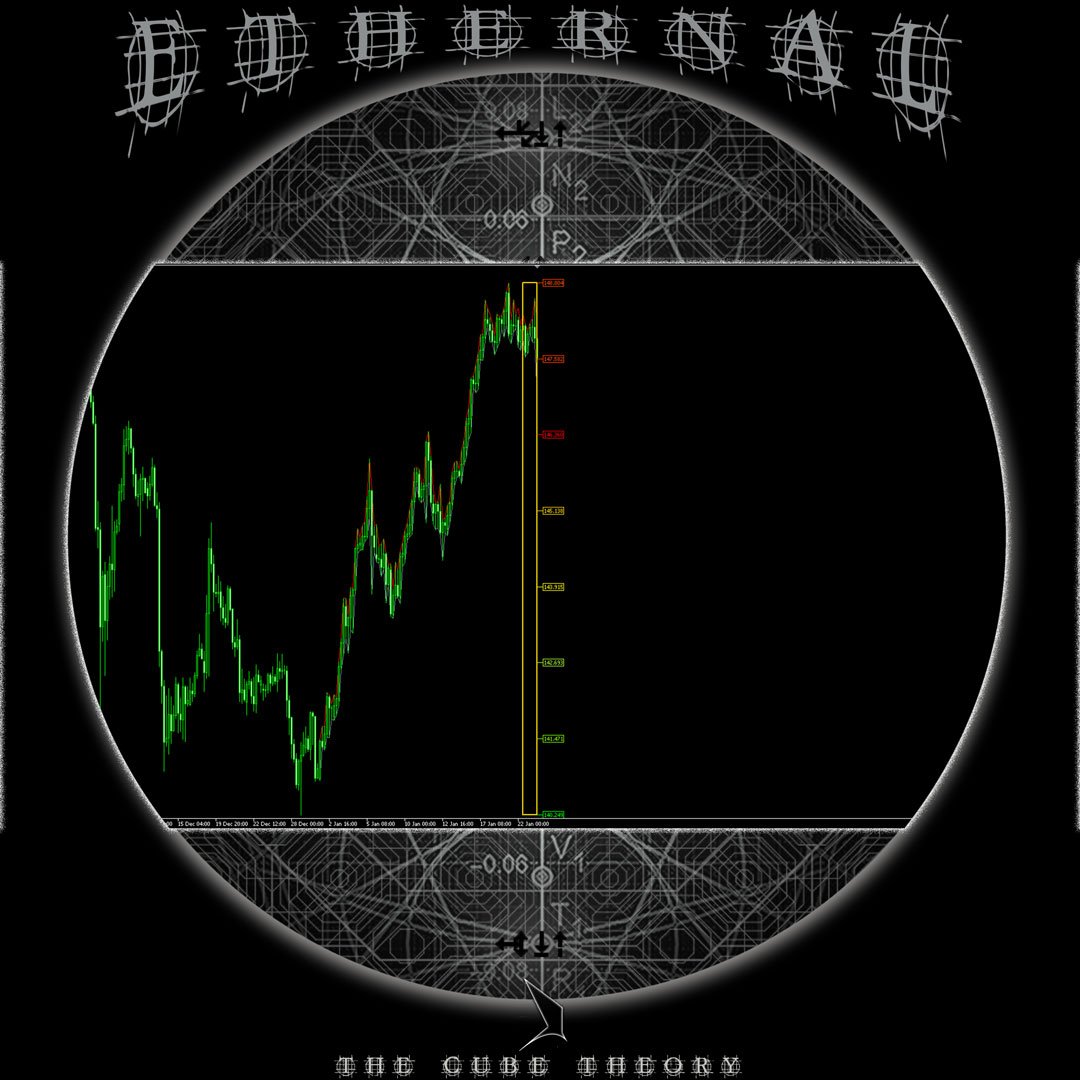
  • Retângulo Dourado destaca a área de análise

  • 8 Níveis Coloridos (de verde a vermelho) para suporte/resistência

✅ Flexibilidade Total:

  • Período ajustável (horas)

  • Intervalo de tempo personalizável (minutos)

✅ Multi-Ativos:

  • Funciona em Forex, Ações, Criptomoedas e Commodities

  • Compatível com todos os timeframes

⚙️ Como Funciona?

  1. Análise de Máximas/Mínimas:

    • Identifica os preços extremos no período selecionado

    • Desenha um retângulo (cubo) no gráfico

  2. Fibonacci Automático:

    • Divide o intervalo entre máximas e mínimas em 8 níveis

    • Cada nível tem uma cor específica (de suporte para resistência)

  3. Atualização em Tempo Real:

    • Recalcula os níveis conforme novos dados chegam

📊 Exemplo de Uso


input int PERIODO = 24; // Analisar últimas 24 horas input int TimeInterval = 60; // Intervalo de 60 minutos

Resultado:

  • Um "cubo" dourado destacando a área de análise

  • Linhas coloridas indicando onde o preço pode reagir

💡 Estratégias Recomendadas

🔵 Breakout Trading:

  • Opere rompimentos acima/abaixo do cubo

🟢 Reversão em Fibonacci:

  • Compre nos níveis verdes (suporte)

  • Venda nos níveis vermelhos (resistência)

🟣 Scalping:

  • Use em timeframes menores (M5/M15) com períodos curtos (1-4 horas)


📌 Depoimentos

"O TheCubeTheory mudou minha forma de operar. Agora vejo os níveis de forma clara e objetiva!" - Marcos T., Trader Profissional

"Melhor indicador de Fibonacci que já usei. Precisão incrível!" - Ana L., Investidora de Crypto

🚨 Aviso Legal

  • Sem garantias de lucro

  • Teste em conta demo antes de usar com capital real

  • Não recomendado para traders iniciantes sem gestão de risco


TheCubeTheory - Transforme Seu Gráfico em um Campo de Batalha Estratégico! ⚡📊

(Pronto para vendas! Adapte os valores e formas de pagamento conforme sua necessidade.)

e si para ver quem sai vitorioso e vc agora esta no meio dessa batalha . Experimente e negocie dentro do cubo universal 


推荐产品
Point and Fignure (P&F) chart plots price against changes in direction by plotting a column of Xs as the price rises and a column of Os as the price falls. Features Support for several kinds of price types - High/Low and Close. Clean and easy-to-read chart. Displays column high and low prices as indicator values. Support for both 4 and 5-digit brokers. Customizeable colors. Advantages Filter insignificant price movements and noise. Less noise and more stable work. Focus on important price move
Fibonacci Auto Levels Pro MT5 – 回撤、扩展和枢轴点 (Pivot Points) Fibonacci Auto Levels Pro MT5 是一款先进的技术分析工具,可自动检测市场摆动点,并在图表上绘制完整的斐波那契回撤、扩展和枢轴点结构。 该指标将几个独立的系统组合成一个统一的分析工具: 枢轴点 (Fibonacci 模式) 枢轴点用于根据前一期的价格范围确定潜在的支撑和阻力区域。 该指标使用 斐波那契枢轴点 ,这些点是应用斐波那契比率计算得出的,并应用于前期的最高价 (High)、最低价 (Low) 和收盘价 (Close)。 枢轴点的时间周期可以手动设置,也可以根据以下逻辑自动设置: 日内交易 ≤ 5 分钟 → 4 小时 5–45 分钟 → 1 日 45 分钟–4 小时 → 1 周 日线 → 1 月 周线 → 3 月 月线 → 12 月 用户也可以手动选择任何更高的时间周期。 斐波那契回撤水平 (自动) 斐波那契回撤可帮助交易者在回调期间确定潜在的支撑/阻力区域。 该指标自动扫描图表,检测摆动低点/高点,并绘制所有主要回撤水平: 23.6%、38
Momentum Ninja Advanced MT5
Mohammed Maher Al-sayed Mohammed Ahmed Saleh
Momentum Ninja Advanced MT5 This indicator is an enhanced version of the classic Momentum indicator.  Main features: - Based on NinjaTrader-style momentum logic. - Uses EMA-based smoothing for cleaner and more stable readings. - Displays dynamic color changes to highlight bullish and bearish strength. - Sends alerts when the momentum crosses above or below zero. - Fully customizable and completely non-repainting. - Lightweight and optimized for all symbols and timeframes. How it differs from t
ZnalgoAiTrend
Zamin Mujtaba Zaidi
Here is a professional and compelling product description you can use directly for the MQL5 Market. It highlights the advanced mathematical logic under the hood while keeping it accessible for everyday traders. Znalgo Ai Trend: Advanced Dynamic Trend Tracker Znalgo Ai Trend is a professional-grade trend-following indicator engineered to track market momentum using a highly responsive, recursive ATR-stepping algorithm. Originally adapted from advanced quantitative TradingView models, this indica
Big Players
Cesar Afif rezende Oaquim
Nade com os grandes ou evite-os a todo custo. Com esse indicador, a escolha é sua! Indicador por coloração de barras, com respostas simples se os "grandes" estão negociando ou não. Saiba quando agir se o mercado está calmo ou agitado, de forma simples, pelo valor de retorno do indicador ou pela aparência das barras. Indispensável indicador para a construção do seu robô ou para seu setup. Resultado do Indicador: 0 - 5. Participantes do mercado: 0 e 1 = Big Players! 2 e 3 = Dia normal. 4 e 5 = Mo
VWAP Wave
Rizwan Akram
VWAP WAVE [Riz] - MT5 Indicator               Advanced VWAP Divergence Detection System VWAP Wave is a professional-grade Volume Weighted Average Price indicator with built-in divergence detection system. It identifies high-probability reversal and continuation signals by analyzing price-VWAP relationships across multiple timeframes.
FREE
Opulence Order Block
Tokunbo Greatpath Adebowale
Opulence OB is a precision-engineered, non-repainting Order Block indicator that identifies high-probability institutional supply and demand zones directly on your MetaTrader 5 chart. Unlike generic OB tools, Opulence OB is fully context-aware — it reads live market structure before drawing anything. A bullish order block only appears when bullish structure is valid. A bearish order block only appears when bearish structure is valid. No noise. No contradiction. Just the zone that actually matter
Professional Percentage Levels Indicator
Danton Dos Santos Sardinha Junior
专业百分比水平指标 基于周期开盘价精密构建的百分比水平 这是一款专业级交易工具,可自动从日线、周线或月线的开盘价向上和向下对称绘制百分比水平,为日内交易和波段交易策略提供清晰、可靠的价格参考区域。 核心功能: 双工作模式: 周期模式 :基于当前周期的开盘价计算水平 投影模式 :基于上一周期开盘价,向前投射的价格水平 灵活配置: 三组可自定义百分比水平(默认值:0.70%、1.00%、1.23%) 支持日线、周线和月线周期 可选周末数据过滤 每条水平线均支持颜色、样式和宽度的完整自定义 技术规格: 14 个指标缓冲区(每种模式各 7 个) 兼容所有图表周期 水平线在倒数第二根K线处终止,确保图表视觉干净整洁 参数更改时自动重新计算 适用人群: 英国 / 欧洲交易者 :非常适合在伦敦交易时段跟踪 FTSE 100、DAX 及外汇品种 德国系统化交易者 :为规则化交易策略提供精确的数学价格水平 专业资金管理者 :为风险控制和利润目标提供清晰直观的参考 波段交易者 :周线和月线水平可作为优质的支撑 / 阻力区域 使用场景: 识别主要指数(日经、DAX、FTSE、Euro Stoxx 等)的关键
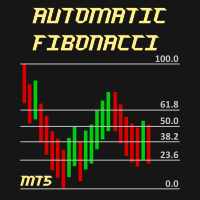
Automatic Fibonacci  is an indicator for automatic Fibonacci Levels drawing. It is fully customizable by user. User can also select different Fibobonacci Levels by user settings or can use multiple Automatic Fibonacci indicator in one chart. All details can be found >>HERE<< Instructions Move Indicator to the chart (simply drag and drop) When pop up window appears select desired settings. Confirm settings and enjoy the Automatic Fibonacci indicator. Features Any chart Any time-frame Custom
Projection of Phi
Nestor Jose Mendez Boza
Projection of Phi   Is a technical indicator that calculates dynamic support and resistance levels. It uses angular geometric projections and mathematical ratios to identify market expansion ranges. Features: Dynamic Fibonacci Expansion: Extension level projection Geometric Calculation: Angular analysis and mathematical ratios Visualization: Graphical objects with informative labels Compatibility: M1 to H4 timeframes Applications: Identification of zones for trade management Analysis of volatil
FREE
Nummereins Pivot Points
Ikechukwu Benedict Umekwe
NummEinz — Pivot Lines for MetaTrader 5 NummEinz automatically draws classic pivot levels on your trading chart. It gives you clear price reference points to support your chart analysis and trade planning. The indicator calculates its levels from the previous completed day, week, or month, using that period’s high, low, and closing prices. Main Features Seven pivot levels: Displays the central pivot point (P), three resistance levels (R1, R2, R3), and three support levels (S1, S2, S3). Daily, we
BR Market Structure
Gustavo Franthesco Kerntopf
Watermark – Marca D'Água para MetaTrader 5 O Watermark é um indicador visual elegante e funcional projetado para exibir uma marca d'água centralizada no gráfico do MetaTrader 5. Ele mostra automaticamente: Símbolo atual (ex: EURUSD) Timeframe ativo (ex: H1) Nome completo do ativo (opcional) Ideal para traders que desejam personalizar visualmente seus gráficos com informações importantes, mantendo o espaço de negociação organizado e informativo. Principais Recursos: Marca d'água centralizada At
ArcTracer
Syed Oarasul Islam
This Indicator draws Fibonacci Arc levels in two different ways. You can select whether to draw Fibonacci Arc levels based on your favourite ZigZag settings or you can let the indicator to draw Arc levels based on given number of bars or candles.  You can also set Mobile and Email notification for your favourite Arc levels individually. With this indicator you will not have to feel lonely as the it can generate Voice alerts, which will keep you focused on your trading and remove boredom.  Produc
POWStrikeETH
Marius Ovidiu Sunzuiana
POWStrikeETH is the evolution of a proven quant‑grade breakout‑truth engine, rebuilt and optimized specifically for the Ethereum (ETHUSD) market. Derived from the original core architecture, POWStrike integrates enhanced volatility‑adaptive logic, ETH‑specific micro‑structure calibration, and refined trap‑detection algorithms that outperform any conventional retail indicator. Ethereum’s unique liquidity behavior, regime transitions, and breakout patterns required a dedicated optimization layer —
Descrição sugerida (português) AVA ICT Pro Signals é um indicador profissional para MetaTrader 5 baseado em conceitos ICT, projetado para encontrar pontos de reversão e continuidade com alta precisão. Ele combina pivôs inteligentes, detecção de FVG e leitura de momentum para gerar sinais de compra e venda visualmente claros no gráfico. O indicador não repinta, é leve e funciona em qualquer par e timeframe, o que permite usar a mesma lógica em Forex, índices, ouro e criptomoedas. As entradas são
Range Filtered AlgoAlpha 是一款技术分析工具,通过分析市场波动性帮助识别潜在交易机会。该指标是AlgoAlpha原创TradingView指标的MetaTrader改编版,融合多种分析方法提供直观的市场评估。 技术特点 采用卡尔曼滤波(Kalman Filtering)平滑价格数据 结合基于ATR的波动带(ATR-based Bands)衡量市场波动性 融入超级趋势(Supertrend)元素进行趋势分析 通过彩色K线(Candles)和标记(Markers)提供可视化信号 支持可配置的警报选项(Configurable Alerts) 功能 该指标处理市场数据实现以下功能: 使用ATR(平均真实波幅)计算波动范围 应用滤波技术(Filtering Techniques)减少市场噪音 通过可视化元素(Visual Elements)显示潜在趋势方向 适用场景 适用于基于波动性的交易策略(Volatility-based Trading) 可作为多种交易品种技术分析(Technical Analysis)的辅助工具 提供市场条件的直观参考(Visual Refer
MTSR — MultiTimeframe Support Resistance for MetaTrader 5 MultiTimeframe Support Resistance (MTSR) is an institutional-grade price action and volume analysis indicator designed for MetaTrader 5. Instead of cluttering your workspace with five separate charts, MTSR projects confirmed Support and Resistance pivot levels from up to five independent timeframes directly onto your execution chart, combined with Multi-Timeframe Delta Volume Zones and Volume Growth Breakout Candles . Built for scalpers,
TeaCii Auto Fibonacci MTF is an implementation of Fibonacci Levels The indicator is simple and yet more powerful than those in the market IMPORTANT: UNIQUE SELLING POINTS - The Levels are set automatically - You can see ANY TIMEFRAME Levels in ANY Chart. E.g. Watch H1 on M1. Watch M1 on H1 - The Levels are available in Buffers for EA Use - Helps you to get an edge early in by using multi timeframe Parameters TimeFrame  :  The timeframe of the indicator. It can be same, higher or lower than the
MultiSymbolsWpr Indice x IBOV
Israel Goncalves Moraes De Souza
O Indicador identifica relação do Índice com a soma dos principais ativos, funciona para qualquer mercado do mund o, possui um oscilador WPR com a soma dos principais ativos escolhidos, indicando a antecipação do movimento em relação ao Índice. Características WPR com a soma dos papéis escolhidos - branco WPR do papel atual - vermelho Canal de Tendência O indicador pode indicar movimento de entradas, sendo: cruzamento das linhas cruzamento da linha Multi Symbols no -50 cruzamento entre os canai
FREE
VR Pivot MT5
Vladimir Pastushak
VR Pivot 这是顶点(pivot)的关键反转点指示器。 Pivot 点一这是一种特殊类型的支撑 (support) 和阻力 (resistance) 水平,用于确定最强的价格区域。专业交易者使用级别 pivot 来确定价格有较大概率反转的价格。水平是根据特殊的数学公式计算的,计算是前一个时间段的收盘价、开盘价、最高价和最低价。最有效的是白天。重要的是要注意,乍一看,这些水平似乎没有什么特别之处,但如果你用水平 pivot 分析价格走势,你可以清楚地看到,在大多数情况下,这些水平显示良好,准确的结果。 技术支持,设置,演示版本的程序可以要求在作者的配置 文件。. 级别 pivot 不仅可以用作反转点,还可以用作可以充分利用止盈以最大化利润的水平,止损以最大限度地减少损失,将仓位转移到无损区域以降低风险。 指标优势 VR Pivot: 该指标支持计算多个公式: Classic Pivot - 经典枢轴公式 DeMark Pivot - 德马克公式 Woodie Pivot - 伍迪公式 Camarilla Pivot - 卡马里利亚公式 Fibonacci Pivot - 斐波那契公
Axiom FVG and OB
Miguel Angel Leon Yanez
AXIOM FVG + Order Block Pro v4.1 MetaTrader 5 的专业 ICT 和 SMC 机构交易指标。 概述 AXIOM FVG + Order Block Pro 是一款非重绘指标,基于 ICT 和 SMC 方法论检测 Fair Value Gaps 和 Order Blocks。它识别可能发生机构活动的供需区域。 主要功能 在任何时间周期上检测 Fair Value Gap,具有可配置的最小尺寸和实时缓解跟踪。 检测 Order Block,具有冲动确认和可配置的蜡烛数量。 高级过滤器,包括与市场结构一致的趋势背景、近期高点和低点附近的流动性检测、伦敦、纽约和亚洲时段的 Killzone 时段过滤器,以及专有的 0.5 到 10 的区域强度评分算法。 汇合检测识别 FVG 与 Order Blocks 重叠的情况,为高概率区域增加强度分数。 专业深色模式面板,显示时段状态、区域计数器、警报计数器、市场偏向、最佳区域和过滤器状态。 通知系统具有推送和电子邮件警报、每个区域的反垃圾邮件保护以及全局冷却时间。 CSV 导出所有检测到的区域,用于回测和日志记
Weis Wave Double Side
Eduardo Da Costa Custodio Santos
The Weis Wave Bouble Side Indicator for MT5 is part of the toolkit (Wyckoff Academy Wave Market) The Weis Wave Bouble side Indicator for MT5 was created based on the already established Weis Wave created by David Weis. The Weis Wave Double Side indicator reads the market in waves as it was done by R. Wyckoff in 1900. It helps in the identification of effort x result, cause and effect, and Supply and demand Its differential is that it can be used below the zero axis, further improving plus operat
Cobalt Predictive Channel:预见未来的动态回归助手 别再手动画通道了,别再因为假突破(fakeouts)亏钱了,也别再总是最后一个进场了。 Cobalt Predictive Channel 是一款机构级别的“预警与回归”辅助工具,专为 XAUUSD(黄金)、比特币和外汇主要货币对等高波动性市场设计。与传统指标不同,它不仅描绘过去,更能预测刚刚萌芽的趋势,让您始终领先市场一步。 为什么要使用 Cobalt Predictive Channel? 大多数交易者试图在市场形成清晰的通道后才入场,这通常会导致在“趋势末端”入场而亏损。此外,在黄金和加密货币等市场中,被称为“扫损(liquidity hunts)”的剧烈插针(上下影线)会让手动绘制的通道变得毫无意义。 Cobalt Analyst 架构正是为了解决这两个主要问题而开发的: 预见未来: 当市场开始转向时,在趋势完全确立之前,它会通过“预测通道(Predictive Channel)”用虚线为您绘制出潜在的新路径。 避开陷阱: 它不会被影线欺骗。它基于质量中心(典型价格,Typical Price)进
FREE
TransitTrendlines
TRANSITBK98
5 (1)
TransitTrendlines this is a automatically trendline drawer, it draw both horizontal and diagonal trendlines. The horizontal trendlines are the pivot points of the day timeframe and the diagonal trendlines are based on the current time frames. You can adjust the diagonal trendlines by increasing the number of bars to draw the diagonal trendline and can also adjust the steepness. Note that the Horizontal trendlines are based on the day pivot points not currant time frame. Join mql5 transitbk98 cha
FREE
OBV Divergence MT5
KEENBASE SOFTWARE SOLUTIONS
KT OBV Divergence 显示价格与 OBV(On Balance Volume)指标之间形成的常规和隐藏背离信号。 功能特点 为了提高准确性并减少图表杂乱,非对称背离信号将被自动忽略。 支持趋势反转和趋势延续两种交易策略。 完全兼容 Expert Advisor,可直接集成使用。 可用于设置入场点和出场点。 支持所有 MetaTrader 平台的提醒和通知功能。 什么是背离? 在技术分析中,如果价格创出新高,震荡指标也应创出新高;如果价格创出新低,指标也应跟随创出新低。当这种同步关系被打破时,说明价格与指标之间出现了背离。 背离主要分为两种类型: 常规看涨背离:   当价格创出新低,而 OBV 指标却形成更高的低点。 常规看跌背离:   当价格创出新高,而 OBV 指标却形成更低的高点。 隐藏看涨背离:   当价格形成更高的低点,而 OBV 指标却创出更低的低点。 隐藏看跌背离:   当价格形成更低的高点,而 OBV 指标却创出更高的高点。 “常规背离用于判断趋势反转,而隐藏背离则用于识别趋势延续。”
Swift Algomatic Pro MT5
Emma-ekong Ben Eshiet
SWIFT ALGOMATIC PRO - MT5 Indicator The 80% Edge on BTCUSD M15 SWIFT ALGOMATIC PRO isn't just another moving average crossover system - it's a precision-engineered algorithmic weapon forged in the fires of real market warfare. While the masses chase lagging indicators and repainting gimmicks, this powerhouse delivers something far more valuable: certified non-repainting signals with documented 80% profitability on BTCUSD 15-minute charts. What Makes This Beast Different? Institutional-Grade
Zenith Fibo Premium
Cristofher Robles
Zenith Fibo Premium is a prop-firm ready, professional-grade trend and range trading indicator. It is strictly engineered to assist traders in passing prop firm challenges by providing clear mathematical entry levels, targets, and risk-management boundaries. Key Features: Prop Firm Safe: Focuses on high-probability setups to protect daily drawdown limits. Drawdown Boundaries: Clearly plotted Entry, Target, and Stop Loss lines. Visual Candles: Non-repainting candle coloring engine for trend conti
FibExtender
Syed Oarasul Islam
This Indicator draws Fibonacci Extension levels in two different ways. You can select whether to draw Fibonacci Extension levels based on your favourite ZigZag settings or you can let the indicator to draw Fibonacci Extension  level based on given number of Bars or Candles.  You can also set Mobile and Email notification for your favourite Extension  levels individually. With this indicator you will not have to feel lonely as the it can generate Voice alerts, which will keep you focused on your
AUTO FIBONACCI MULTI-TIMEFRAME TOOLKIT Technical analysis tool that automatically draws Fibonacci levels for 4H, Daily, Weekly, and Monthly sessions. AUTOMATIC FIBONACCI RETRACEMENTS (7 CLASSIC LEVELS): - 0.0% (Previous session Low - support level) - 23.6% (Fibonacci Golden Ratio - early entry level) - 38.2% (Strong retracement level) - 50.0% (Key pivot level highlighted in YELLOW - market equilibrium) - 61.8% (Main Golden Ratio - critical decision level) - 78.6% (Deep retracement level) - 100.0
Harmonic Patterns SwingCore Pro | For MetaTrader 5 (MT5) Technical analysis indicator for detecting and visualizing harmonic patterns on the chart, with Fibonacci level projection and configurable alert system. ================================================================================ WHAT THIS INDICATOR IS It is a visual analysis tool. Its function is to identify structures on the chart that satisfy the geometric relationships of six classic harmonic patterns: Gartley, Bat, Butterfly
该产品的买家也购买
Trend Sniper X
Sarvarbek Abduvoxobov
4.87 (45)
Trend Sniper X 是一款适用于 MetaTrader 5 的多周期趋势跟踪指标,可帮助交易者清晰精准地识别趋势方向和潜在的反转点。 适用于 MT4: https://www.mql5.com/en/market/product/193245 价格信息: 当前价格为促销价,随着后续更新和新功能的推出,价格可能会有所变动。 赠品优惠: 购买后联系作者,即可免费获取该指标的 Auto-Trade Assistant EA(自动交易助手 EA)。 Code2Profit 频道 通过多时间框架分析掌控市场! 如何使用 Trend Sniper X 最大化您的胜率:核心规则与交易时段技巧 技术规格 平台 MetaTrader 5 指标类型 多时间周期趋势指标 运行时间周期 任何图表时间周期,可独立选择更高的时间周期 (M1–MN1) 主要交易品种 外汇、黄金 (XAUUSD) 及其他差价合约 (CFD) 推荐账户 任何账户类型 可视化 彩色趋势蜡烛 (买入/卖出/微弱/变化) + 买入/卖出箭头 附加模块 交易时段方框 (悉尼、东京、伦敦、纽约) 主要功能 多时间周期趋势分析: 直接在
全新王者降临 - 指标 + 订单管理提示(TP1 + TP2 + TP3)+ 可选 Telegram 信号发送器 INCLUDED(免费) (完整交易与信号系统) 我们最强的黄金 EA: Gold Slayer 该指标包含先进的交易策略、可自定义订单管理系统,以及结合 Envelope 扩展的均值回归系统,并通过 RSI 等多重智能确认过滤器进行验证,以捕捉高概率反转入场机会,提供 BUY 与 SELL 信号。 你不仅能够学习如何交易,还能学会如何高效管理多个仓位,并利用之前盈利的持仓来覆盖亏损交易。 专为 M5 周期打造并优化,在 BTCUSD 和 XAUUSD 上表现尤为出色,因为这些市场的流动性能够让信号更加干净、可靠。 该指标会自动生成清晰的多头(Long)与空头(Short)信号,同时基于 ATR 自动计算入场位、止损位和止盈位,让风险管理从一开始就融入系统之中。 多 TP 系统设有三个渐进式目标位,你可以在 TP1 锁定部分利润、在 TP2 继续持仓,并在更大的行情中将仓位持有至 TP3,而这正是平均风险回报比真正开始大放异彩的地方。 默认参数开箱即用,已经针对稳定表现进行
Smart Trend Trading System — MetaTrader 5 购买后,请在 MQL5 上给我发消息,即可免费获得 Smart Universal Expert Advisor,以及在线课程、PDF 手册和私人群组访问权限。 STTS 将趋势方向、入场和出场信号、反转区域及重要价格水平集中呈现在图表上。您可以根据系统手动交易,也可以连接单独的兼容 EA,按照您选择的设置自动执行交易。 一套系统,四种交易思路 STTS 将交易方法分为四大类: • 剥头皮交易 — 跟踪短期信号和市场波动。 • 趋势交易 — 评估方向,寻找趋势中的交易机会。 • 反转交易 — 识别潜在的转折区域和方向变化。 • 成交量交易 — 利用成交量相关信息评估市场活跃程度。 入场和出场箭头、趋势信息、支撑与阻力位及反转区域,帮助您直接在图表上分析交易形态。 先从一种方法开始。了解其信号和设置后,再探索其他方法。 从信号到自动化 Smart Universal Expert Advisor 可连接 STTS,让您自动执行受支持的交易信号。 启用自动交易前,请配置指标连接、仓位大小和交易管理设置
Entry Points Pro for MT5
Yury Orlov
4.55 (153)
Entry Points Pro 会在您下单之前,告诉您在哪里入场、止损放在哪里、用多大的手数交易。 价格 现在 199 USD,按此价格出售 8 份,之后为 249 USD。最终价格为 349 USD。 我靠交易市场赚钱,并公开展示,所以我不需要把这个指标卖给所有人。它是为独立思考的交易者准备的工具,而不是一个神奇按钮。 没有突破,就没有交易。灰色箭头表示信号已取消:价格没有突破信号K线,因此没有入场,也没有亏损。 箭头在 K 线收盘时出现,并且不会重绘。只有两项设置:您的本金和每笔交易的风险。 付款前先验证:免费演示版可在 MT5 策略测试器中运行,只需两分钟。购买后,我会亲自帮您完成设置。 2019 年,我向全世界展示了这款指标的能力。我按它的信号手动交易,用的是真实账户,全程公开——账户在 Myfxbook 上接受监控,我还在 Facebook 上详细记录了这次实验。结果:10,000 美元在四个月内变成了 941,411 美元。风险是我有意设得极高的——回撤一度达到 54%,因为在我们这一行,利润和风险总是相伴而行。Myfxbook 的截图就是图库中的第一张图片。 看来
M5 Sniper
MeanFX
5 (4)
让您的交易优势尽在视野之中! M5 Sniper 是 MeanFX 推出的一款全新指标。它将 精准的交易信号 与 自适应 TP/SL 水平 相结合——从而创造出最佳的统计交易机会! 每售出 5 份,价格上涨一次,下一价格为 69$ 购买后请给我发消息,以获取技巧/指南和奖励 EA 它有哪些突出优势? 经过验证的统计表现 ,适用于 Gold XAUUSD( 几乎适用于每一种资产 ,专注于掌握一个时间周期,而不是试图面面俱到却无法获得稳定的结果) 每天每个交易品种 1 至 8 笔交易 ,具有较高的胜率百分比,并让所有统计优势站在我们这一边 图表上 仅显示已确认的 BUY 和 SELL 信号 自适应 TP 和 SL 水平 ,由指标针对每笔交易生成 平均胜率 75%+ 平均 Signal Ratio 最低 1.1+ 警报 和通知也会发送至 手机 **适合 Prop Firm(资金管理公司)**的交易方式 易于理解——适合 所有经验水平 的交易者 创作者提供的个人支持 100% 不重绘、不重新绘制、不滞后 奖励自动化 Expert Advisor(EA) 背后的策略: M5 Sniper 基于
Ultra Indicator
Ihor Otkydach
5 (1)
ULTRA 是一項採用「一站式」運作模式的技術指標——它能獨立分析市場、產生交易訊號、顯示設定停損單的價位,並建議何時平倉以鎖定獲利或將損失降至最低。 換句話說,無論您是否懂得分析市場、判定價位(該將停損設在哪裡),或是對資金管理感到棘手,都無妨。ULTRA 會為您處理所有這些事情! 買家專屬好禮 : 購買 ULTRA 指標後,請透過私訊聯繫我,即可免費獲贈「ULTRA BOT」。這是一款特別設計的工具,能協助您根據該指標發出的訊號來管理已開倉的交易(它會為每筆交易設定停損點,並依照策略規則自動平倉,以爭取最佳交易結果)。 我還會為買家提供各種資產的預設參數,讓該指標能發揮最大效能。請透過私訊聯繫我,免費獲得這些超級好處! ULTRA 策略的運作方式 ULTRA 指標會分析歷史價格數據(涵蓋約過去 4 年),並自動學習辨識波段反轉,以便在實際交易中為您創造最大利潤。 該指標的訊號絕不會重新繪製!!一切都盡可能做到真實且直觀! ULTRA 指標運用特殊的虛擬化演算法,根據歷史數據計算所有訊號的結果,並將其交易成果顯示於儀表板上。這意味著您甚至在開始交易之前,就能預先了解 ULTRA 指標
Gann Made Easy MT5
Oleg Rodin
5 (13)
Gann Made Easy   是一个专业且易于使用的外汇交易系统,它基于使用先生理论的最佳交易原则。 W.D.江恩。该指标提供准确的买入和卖出信号,包括止损和获利水平。您甚至可以使用推送通知在旅途中进行交易。 购买后请联系我,即可免费获得交易指导和超棒的额外指标! 您可能已经多次听说过江恩交易方法。通常 Gann 的理论不仅对于新手交易者而且对于那些已经有一定交易经验的人来说都是非常复杂的东西。这是因为江恩的交易方法在理论上并不那么容易应用。我花了几年时间来完善这些知识,并将最好的原则应用到我的外汇指标中。 该指标非常易于应用。您所需要的只是将其附加到您的图表并遵循简单的交易建议。该指标不断进行市场分析工作并寻找交易机会。当它检测到一个好的入口点时,它会为您提供一个箭头信号。该指标还显示止损和获利水平。 换句话说,当您像先生一样进行交易时,该指标会为您提供最佳江恩建议。江恩亲自告诉你此时此刻该做什么。但最好的部分是您不需要了解任何有关江恩交易原则的知识,因为该指标会为您完成整个市场分析工作。
Zoryk Gold
Reda El Koutbane
4.79 (19)
折扣将在 24 小时后结束——下一价格为 69 美元 ZORYK — MetaTrader 5 专用高级 XAUUSD 黄金信号系统 你一定熟悉这种感觉。 你花了很多时间分析黄金,等待合适的入场机会。终于开仓后,价格却立刻朝相反方向移动。你过早平仓、移动止损,或者只犹豫了几秒钟。随后,市场却在没有你的情况下到达了你原本预期的目标。 问题并不总是方向判断错误。 真正的问题是缺乏确定性。 你不知道准确的入场位置在哪里。 你不知道什么时候交易逻辑已经失效。 你不知道应该先锁定较近的利润,还是继续等待更大的行情。 你也不知道当前信号是否足够强,还是自己只是在强行寻找交易机会。 黄金市场变化非常快。一个没有明确计划的好想法,可能在几秒钟内变成错误的交易决定。 ZORYK 正是为了解决这个问题而开发。 什么是 ZORYK ZORYK 是一套完整的 XAUUSD 黄金信号与交易计划系统,专门为 MetaTrader 5  和 M5 时间周期 开发。 它不是一个只显示 BUY 或 SELL 箭头,然后让你独自决定其余所有内容的简单指标。 每个确认后的信号都可以在图表上显示完整的可视化交易计划,包
SMC Intraday Formula
VividMind Digital Solutions
5 (26)
让我们先坦诚一点。 没有任何一个指标可以单独让你实现盈利。如果有人告诉你可以,那他是在向你兜售一个梦想。任何显示完美买卖箭头的指标都可以被做得看起来毫无瑕疵——只需要放大历史中的某一段并截取成功交易的截图。我们不会这样做。 SMC Intraday Formula 是一个工具。 它为你读取市场结构,标记出概率最高的价格区域,并用简单直白的语言准确告诉你当前智能资金的行为轨迹。你仍然需要做决定。你仍然需要执行交易。但现在,你是带着精确性执行,而不是靠希望。 我们已经在黄金(XAUUSD)以及主要外汇货币对的日内剥头皮交易中使用该指标将近三年。这是我们在 M1、M5、M15 和 M30 上的日常主力工具。它之所以有效,是因为它不试图预测未来——它展示的是当前正在形成的高概率交易机会,并解释 为什么 。 它与其他所有指标有什么不同? 大多数交易指标只做一件事。移动平均线交叉。振荡指标触及某个水平。出现一个箭头。你进场交易。你亏损。你责怪指标。重复。 SMC Intraday Formula 将多个机构级概念整合为一个统一的市场解读: - 斐波那契共振引擎 不只是普通的斐波那契水平——该指标
SuperScalp Pro
Van Minh Nguyen
4.54 (37)
SuperScalp Pro - Professional Multi-Layer Confluence Scalping System SuperScalp Pro 是一款先进的剥头皮交易指标,在经典 Supertrend 的基础上加入了多种智能确认过滤器。它可以帮助您识别成功概率更高的 Buy/Sell 交易机会,同时显著减少虚假信号。 清晰的 Buy 和 Sell 箭头会直接显示在图表上,并实时自动计算基于 ATR 的 Stop Loss 和 Take Profit 水平。 购买后,请通过 MQL5 给我发送消息,即可免费获取 SuperScalp Pro Auto Trader EA、用户指南以及私人群组的访问权限。 下载推荐的设置文件: [Set File] 完整文档请参阅产品博客: [User Guide] 加入官方频道,获取最新更新: [Official Channel] SuperScalp Pro 如何工作? 只有当多个确认层同时满足条件时,指标才会生成信号(趋势 + 动量 + 成交量 + 波动率 + 高时间周期趋势)。 Multi-Timeframe (MTF)
GoldenX Entry MT5
VividMind Digital Solutions
5 (17)
GoldenX Entry 是一款用于 MT5 的指标,包含自适应 Smart Entry Trend 算法、信号评分系统、市场状态识别器以及波动率过滤器。每个信号都包含计算得出的入场位、三个止盈位(TP1、TP2、TP3)以及止损位。它基于多个分析层构建,旨在适应不同市场条件,将多层分析系统与内置优化器及统计跟踪系统相结合。该指标基于风险收益比(RR)指标和历史交易行为提供量化分析。 开始使用非常简单——在所选时间周期上运行优化器,然后在图表上开始使用该指标。 核心功能 GoldenX Entry 将信号引擎与内置交易管理及历史统计跟踪整合在同一图表中: - 内置优化器: 优化器可在图表上单击运行。它通过两阶段搜索流程测试200种参数组合——先进行探索,再进行优化——并在完成后自动应用选定配置。结果会按时间周期缓存,因此当返回已优化的周期时,会立即恢复相同设置。 - 黄金品种自动周期识别: 将指标加载到任何 XAUUSD 图表(M1 到月线)。系统会自动识别当前周期并加载对应预设。共包含9个时间周期配置文件,专为黄金在标准周期上优化设计。切换周期时,参数会自动调整。 - 资金参考面
Gold Trend Coach MT5
Cristhian Alexander Gaibor Cuasquer
4.27 (11)
MetaTrader 5 黄金(XAUUSD)买卖信号,不重绘。每个信号都自带止损和三个止盈。Smart Money Concepts 过滤,实时标出 BOS 和 CHoCH,让你顺着结构交易,而不是逆势硬扛。面板上的实时导师,从入场到 TP3 一步步带着你走。信号直接推送到你的手机和你自己的 Telegram 频道。这就是 Gold Trend Coach。从此不再孤军奋战。 购买即送买家礼包: 1. Telegram Alert Bridge: 信号推送到你自己的 Telegram 频道,附图表截图和每日报告。 2. 使用手册和安装设置指南。 如何领取: 礼包不在下载文件里。购买后通过 MQL5 站内信联系我,当天发给你。 $39 和 $45 的首发份额已售罄。现价 $59,仅限接下来 10 份,之后 $79。 先说实话。 我自己不用的指标,绝不会拿出来卖。我每天都用 Gold Trend Coach 手动交易黄金,周期 M1、M5 和 M15,只在出现顺我方向的 CHoCH 或 BOS 之后才接信号。 你大概已经试过几十个黄金指标。大多数只给你一个箭头,然后把最难的部分丢给你:
Boba Analysis Suite
Trade Ready Solutions LLC
5 (2)
Boba Analysis Suite Boba Analysis Suite 是一款适用于 MetaTrader 5 的分析指标。它将市场结构、关键价格区域和整体市场背景整合到同一图表视图中。 该指标源于交易及交易教学的实践经验,旨在帮助用户建立有条理的分析流程:评估市场方向、识别重要价位,并结合多个时间周期进行分析。 结合市场背景进行分析 单个信号的意义取决于市场背景。Boba Analysis Suite 帮助用户将当前图表状况与更大范围的市场结构相结合,并根据预先制定的规则评估交易思路。 分析功能包括: **趋势与市场结构:**评估市场方向及相关结构背景。 **关键价格区域与价位:**在图表上直观标示值得进一步分析的重要区域。 **多时间周期:**整合不同时间周期的信息,评估整体市场背景。 **可视化分析流程:**直接在图表上查看分析信息。 自主做出交易决策 Boba Analysis Suite 适合希望系统分析图表并结合多个时间周期信息的交易者。 该指标用于辅助分析,不会开仓或平仓,也不能替代交易策略或风险管理。每一笔交易的决策均由用户自行做出。 使用与许可 平台:Meta
FX Power MT5 NG
Daniel Stein
5 (33)
FX Power:分析货币强度,助您做出更明智的交易决策 概述 FX Power 是一款专业工具,帮助您全面了解主要货币和黄金在任何市场条件下的真实强度。通过识别强势货币用于买入,弱势货币用于卖出, FX Power 简化了交易决策,并帮助您发现高概率的交易机会。不论您是想跟随趋势还是通过极端的 Delta 值预测反转,这款工具都能完美适应您的交易风格。别再盲目交易——用 FX Power 让您的交易更加智慧。 1. 为什么 FX Power 对交易者极具价值 实时货币和黄金强度分析 • FX Power 实时计算并显示主要货币和黄金的相对强度,助您全面了解市场动态。 • 监控领先或落后资产,轻松识别值得交易的货币对。 全面的多时间框架视图 • 跟踪短期、中期和长期时间框架的货币和黄金强度,以便将您的交易策略与市场趋势保持一致。 • 无论是快进快出的短线交易还是更长期的投资策略, FX Power 都能为您提供所需的信息。 Delta 动态分析用于趋势和反转 • 极端 Delta 值常常预示反转机会,而平缓的 Delta 变化则确认趋势延续。 • 使用 Delta 分析,轻
Azimuth Pro
Ottaviano De Cicco
5 (7)
Azimuth Pro V2:MT5合成分形结构分析与确认入场 概述 Azimuth Pro 是 Merkava Labs 推出的多层级波段结构指标。四层嵌套波段层级、锚定波段的VWAP、ABC形态识别、三时间框架结构过滤以及收盘确认入场——一个图表,一个从微观波段到宏观周期的完整工作流程。 这不是盲目的信号产品。它是一个以结构为先的工作流程,专为重视位置、背景和时机的交易者打造。 1. V2的变化 合成多时间框架引擎 高时间框架分析从零开始重建,采用与Meridian Pro相同的专有合成架构。更清晰的HTF背景、稳定的实时行为、无经典MTF同步问题。合成引擎还解锁了 固定比率时间框架级联 (x2、x3、x4、x6)——不再在经纪商的固定时间框架之间任意跳转,您可以按图表时间框架的固定倍数分析结构,在每个尺度上保持相同的分形关系。 确认入场箭头 作为稳定且可恢复的执行层而设计的收盘确认箭头。当ABC设置形成且自适应确认逻辑在收盘K线上验证方向时,箭头会写入下一根K线的开盘,并设计为在刷新、切换时间框架、重新加载指标或重启终端等正常图表生命周期事件后仍能一致恢复。 这些不是独立的买
FiboSniper Pro
Van Minh Nguyen
5 (4)
FiboSniper Pro – Multi-Filter Fibonacci System with Auto SL/TP and Control Panel FiboSniper Pro 是一款技术指标,将动态 Fibonacci Envelopes 与多个确认过滤器相结合,以生成经过筛选的 Buy 和 Sell 信号。Fibonacci 水平基于 Moving Average 和 ATR 计算,然后通过 ADX、EMA、RSI、ATR、Volume、Time 和 Candle 结构进行过滤。该指标直接在图表上显示基于 ATR 自动计算的 Stop Loss 和 Take Profit 水平,并提供交互式控制面板,以便快速调整参数。 购买后,请通过 MQL5 给我发送消息,即可免费获取 Auto Trader X,以及有关如何将该指标的交易信号自动化的说明。 用户指南和设置文件: [Click here] 完整文档请参阅产品博客: [Click here] 加入官方频道获取最新更新: [Click here] 专为偏好结构化入场和清晰风险管理的交易者设计,适用于 Gold (XAU
Atomic Analyst MT5
Issam Kassas
4.51 (65)
Atomic Analyst — MetaTrader 5 购买后,请在 MQL5 上给我发消息,即可免费获得 Smart Universal Expert Advisor,以及在线课程、PDF 手册和私人群组访问权限。 Atomic Analyst 将价格行为、趋势方向、入场和出场信号、止损位及多个止盈位集中呈现在图表上。 看清信号,理解交易形态 Atomic Analyst 将分析结果整理为清晰的可视化信息: • 买入和卖出箭头,用于识别潜在的入场机会。 • 止损位和多个止盈位,帮助规划交易。 • 趋势、强度和动量读数,用于评估市场方向。 • 多时间周期分析,用于比较更广泛的市场背景。 • 彩色K线和提醒,帮助您跟踪变化的市场条件。 结合辅助分析查看信号,再判断该交易形态是否符合您的交易规则。 从短期形态到更大级别的行情 您可以将 Atomic Analyst 用于剥头皮交易、日内交易,或跟踪持续时间更长的市场走势。 建议从 H1 时间周期开始。建议交易品种包括 EURUSD、AUDUSD 和 XAUUSD。 从信号到自动化 Smart Universal Expert A
M1 Sniper MT5
Oleg Rodin
5 (7)
M1 SNIPER   是一款易于使用的交易指标系统。它是一个专为 M1 时间框架设计的箭头指标。该指标可以作为独立的系统在 M1 时间框架下进行剥头皮交易,也可以作为您现有交易系统的一部分使用。虽然该交易系统专为 M1 时间框架交易而设计,但它也可以用于其他时间框架。我最初设计此方法是为了交易 XAUUSD 和 BTCUSD。但我发现这种方法在其他市场交易中也同样有用。 指标信号既可以顺势交易,也可以逆势交易。我教授一种特殊的交易技巧,帮助您利用指标信号进行双向交易。该方法基于使用特殊的动态支撑位和阻力位区域。 购买后,您可以立即下载 M1 SNIPER 箭头指标。此外,我还为所有 M1 SNIPER 工具用户免费提供下方屏幕截图所示的 Apollo Dynamic SR 指标!这两个指标的组合可以帮助您更轻松、更准确地利用 M1 时间框架进行交易。 购买后请联系我,免费获取交易提示和奖励指标! 祝您交易成功!
SQN Max indicator for MT5 by ITC
Renaud Herve Francois Candel
Sqn Max Indicator Sqn Max is an exclusive indicator to trade the market with high effectiveness. The indicator is based on price action, volatility and trend. This indicator is as simple as possible but not too simple. The indicator can generate alerts to ease the trading process. You don't have to stay all day in front of your screen. The indicator can be used with any class of assets and with any time frame. It is possible to achieve better results trading our list of selected assets. We achi
Auto Optimized SpeedAngle 是一款机构级的动量向量化系统,通过持续的前瞻优化(Walk-Forward Optimization, WFO)彻底消除了曲线拟合(curve-fitting)。该指标没有采用在市场 状态转换时容易失效的静态输入参数,而是利用出样外验证(Out-of-Sample, OOS) dynamically 动态重新校准设置,从而确保显示的 信号代表真正的统计优势,而非历史巧合。 核心机构级架构 前瞻优化引擎(Walk-Forward Optimization Engine): 核心算法持续扫描数千种回溯周期(lookback)与阈值组合,严格将数据划分为样本内(in-sample)和样本外(out-of-sample)。只有当参数配置在未知数据环境中证明具备数学优越性时,系统才会对其进行 adoption。 量化目标函数(Quantitative Objective Functions): 优化引擎不一味追求绝对毛利,而是聚焦于机构级的稳定性指标。用户可针对系统质量数(SQN)、期望值(每笔交易的平均 R 倍数)或净 R 值进行优化,从而优
Apex Patterns PRO 购买指标 — 免费获取基于该指标的 Expert Advisor。 自我优化的图表形态与突破分析智能 传统的形态扫描器依赖固定输入,在市场波动和结构发生变化时通常表现不佳。 Apex Patterns PRO 旨在适应不断变化的市场条件,将结构性图表形态识别、动量过滤和统计自我优化结合到一个分析框架中。 适应性扫描引擎 自我优化形态模式 在近期历史数据中自动搜索合适的形态参数,使指标能够根据当前市场行为调整其结构检测,而不是使用静态配置。 智能突破过滤 将经典形态识别与动量、成交量和价格行为指标相结合。引擎不会同等对待每次突破,而是评估潜在的市场结构,以识别符合当前统计环境的交易设置。 主要功能 固定的、不重绘的实时信号 自我优化的形态检测参数 丰富的图表结构库(顶部/底部、头肩顶/底、三角形、楔形) 基于动量和成交量的突破过滤 基于市场结构的动态止损和止盈水平 图表信号和实时性能指标 标准的推送、电子邮件和平台提醒 专为适应不断变化的市场条件而设计,而非依赖永久固定的参数 核心理念 目标不是将静态的几何形状强加于动态的市场。 目标是让历史市场数据
Adaptive Price Action Engine 买指标,免费送EA 自适应多时间框架趋势与K线形态智能分析系统 市场环境始终在变化,不同的市场阶段中,并非所有 Price Action 形态都具有相同的参考价值。 Adaptive Price Action Engine 旨在适应不断变化的市场条件,将 趋势结构、多时间框架分析、K线形态与统计优化 整合到一个统一的分析框架中。 两种自适应模式 Dual Alpha Trend Mode(双 Alpha Trend 模式) 自动搜索适合的 Alpha Trend 参数,并结合低周期与高周期市场结构,使指标能够根据近期市场行为动态调整趋势识别。 Candlestick + Alpha Mode(K线 + Alpha 模式) 将 Alpha Trend 市场状态与 22种多空K线形态 相结合。系统不会简单地对所有形态一视同仁,而是对不同的形态组合进行统计评估,并识别在特定市场环境下表现出更强历史统计特征的配置。 主要功能 趋势参数自动优化 多时间框架市场状态分析 22种多头与空头 Price Action K线形态 对数千种可能
下一次更新 — 版本 2.52 即将推出![全新功能] 准备迎接 4 项重大新功能,全面提升您的市场分析能力与交易流程! 我们将通过 4 项全新功能,进一步提升市场分析水平,满足您的交易需求。现为您介绍: 1. TRADE OVERVIEW DASHBOARD 2. CONFLUENCE AT ZONE 3. STRONG & WEAK HIGH/LOW 4. OTE 1. TRADE OVERVIEW DASHBOARD 一个帮助您更轻松地了解整体市场状况的仪表盘,为您的交易决策提供参考指引,帮助您系统地分析市场并规划交易,所有信息尽在一个屏幕中。 多时间周期市场概览(Multi-Timeframe Market Overview) 更清晰地了解市场方向与价格结构 快速查看市场状况 为系统化市场分析和入场规划提供指引。 2. CONFLUENCE AT ZONE 当价格进入关键区域时……您将了解有多少项支持因素相互吻合。 关键区域是交易决策至关重要的地方。但仅仅是价格进入某个区域还不够。此功能可帮助您在入场交易前,识别相互吻合的因素,包括信号及其他相关因素,从而进行更全面的分析,并
Divergence Bomber
Ihor Otkydach
4.89 (94)
购买该指标的每位用户将额外免费获得以下内容: 原创工具“Bomber Utility”,该工具会自动跟踪每一笔交易,设置止损和止盈点,并根据策略规则自动平仓; 适用于不同交易品种的指标设置文件(Set 文件); 三种不同风险模式下的 Bomber Utility 设置文件:“最低风险”、“平衡风险” 和 “观望策略”; 一套详细的 视频操作手册,帮助您快速完成安装、配置并开始使用本交易系统。 注意: 要获取以上所有赠品,请通过 MQL5 的私人消息系统联系卖家。 我为您介绍原创的自定义指标 “Divergence Bomber”(背离轰炸机),它是一套基于 MACD 背离交易策略 的“全功能”交易系统。 该技术指标的主要任务是识别 价格与 MACD 指标之间的背离,并发出交易信号(包括推送通知),指示未来价格可能的运动方向。平均而言,这些信号的准确率超过 98%。有关该指标如何工作的详细说明,请观看本页面上的视频演示。 该系统使用 止损订单 和 动态回撤平仓机制 来管理交易。 Divergence Bomber 指标的主要特点: 支持交易的品种: AUDCAD、AUDCHF、AUDS
Power Candles MT5
Daniel Stein
4.58 (12)
Power Candles V3 - 自我优化的强度指标 Power Candles V3 把货币与品种的强度直接转化为图表上可执行的交易方案。指标不再仅根据强度给K线着色,而是在后台持续运行实时自动优化,为您正面对的品种给出最佳 Stop Loss、Take Profit 与信号阈值。一键采用,Entry、Stop Loss、Take Profit 线就以精确价格绘制在图表上,提醒消息中直接包含方向。 本工具是 Stein Investments 生态系统的一部分 - 18+ 款工具,加上 Max,您的一对一 AI 交易导师。  随时在线,深入了解每一款指标,在您需要梳理思路的那一刻就在那里。  立即认识他: https://stein.investments 每根收盘K线运行 3,000+ 次交易模拟。9 种强度状态。2 种策略并行测试。一键采用最优配置。 为什么需要这个 大多数强度指标只给您一个数值,然后留下三个问题:相信哪个阈值、用哪个 Stop Loss、走哪个交易方向。Power Candles V3 在每根收盘K线上自动回答这些问题。结果就是一个完整的交易方案 -
货币强度向导是一个非常强大的指标,为您提供成功交易的一体化解决方案。该指标使用多个时间范围内所有货币的数据来计算这个或那个外汇对的力量。此数据以易于使用的货币指数和货币电力线的形式表示,您可以使用它们来查看这种或那种货币的力量。 您所需要的只是将指标附加到您要交易的图表上,该指标将向您显示您交易的货币的真实强度。该指标还向您显示买卖量压力的极值,您可以在顺势交易时利用这些压力。该指标还显示了基于斐波那契的可能目标。该指标可用于各种交易时间范围。该指标支持各种货币对的交易。   该指标为您提供所有类型的警报,包括推送通知。 购买后请联系我。我将与您分享我的交易技巧,并免费为您提供丰厚的红利指标! 祝您交易愉快,获利丰厚!
Tokyo mt5 Indicator
Vasiliy Strukov
5 (15)
Tokyo Indicator(东京指标)直观地展示了趋势方向、潜在交易信号及市场状况。 其采用颜色编码的阶梯式趋势线,以蓝色标识看涨阶段,以洋红色标识看跌阶段。配套的方向箭头会在趋势发生变化时,标示出潜在的买入与卖出机会。 内置的综合仪表盘将当前信号、市场倾向、动能、波动率及信号质量整合于同一视图中,方便交易者在观察价格走势的同时评估指标数据,无需在不同面板间切换。 凭借清晰的图表显示和简洁的市场概览,Tokyo Indicator 支持以系统化的方式进行趋势分析与交易确认。 适用于任何时间周期及各类交易品种,尤其适合黄金交易。 购买后请立即联系我,以获取专属赠品!您可以免费获得我们的“强力支撑与趋势扫描”(Strong Support and Trend Scanner)指标,请私信我! 设置说明与使用手册请见此处。 请注意:我不会在 Telegram 上出售我的 EA 或特殊参数设置(set files);我的 EA 仅在 Mql5 平台上提供,而参数设置文件仅在我的博客(此处链接)上发布。请务必警惕诈骗,切勿从他人处购买任何参数设置! 设置 ShowHUD —— 在图表上显示
Naked Forex Tweezer Pro Indicator Tweezer Pro Indicator is a pattern recognition indicator for Forex, Stocks, Indices, Futures, Commodities and Cryptos. The standard Tweezer is a two bar pattern. Our enhanced version is a multi-bar pattern. We filter the patterns for you so that you only get the     best and most effective patterns   and ignore the noise. The Tweezer pattern is a simple and effective pattern to trade. The strategy that comes with the Tweezer is based on price action. The Twe
Unix Scalper
Issam Kassas
4 (4)
Unix Scalper — MetaTrader 5 购买后,请在 MQL5 上给我发消息,即可免费获得 Smart Universal Expert Advisor,以及在线课程、PDF 手册和私人群组访问权限。 发现交易形态,看清交易计划,选择执行方式。 UNIX Scalper 将市场分析、BUY/SELL/WAIT 决策以及 Entry、Stop Loss、TP1 和 TP2 水平集中在一个清晰的面板中。 看清信号与交易计划 • 明确的决策:BUY、SELL 或 WAIT。 • 明确的价格水平:Entry、Stop Loss、TP1 和 TP2。 • 多时间周期概览:比较面板中各时间周期的信号。 • 辅助分析:趋势、动量、成交量、波动率、支撑与阻力,以及市场质量。 • 灵活的布局:Minimized、Compact、Standard 或 Full。 查看信号,检查价格水平,再判断该交易形态是否符合您的交易规则。 从黄金和比特币开始 建议首先使用的交易品种:XAUUSD 和 BTCUSD。 探索短期剥头皮交易和较高时间周期分析。选择历史K线范围,通过表现曲线查看所选设置
FX Levels Premium indicator for MT5
Renaud Herve Francois Candel
Fx Levels Premium Indicator Support and Resistance are important concepts in trading. Fx Levels Premium was created to easily draw important levels of support and resistance for the active trader. The indicator will give you all important levels (support/resistance) to watch for a wide range of assets. Trading without these levels on your chart is like driving a car for a long journey without a roadmap. You would be confused and blind. Support and resistance levels should be used as guideline
作者的更多信息
Veloticker
Alexandro Matos
VeloTicker PRO is a professional trading indicator designed to reveal hidden market pressure at key institutional price levels. At these levels, the market often experiences: - Liquidity concentration - Institutional participation - Price reactions (reversals or breakouts) The indicator displays two real-time gauges: BUY Pressure Gauge SELL Pressure Gauge Each gauge measures the strength of buying and selling activity based on tick volume flow. This allows traders to instantly iden
FREE
價格範圍計算器 相信我的價格,相信,信仰! 每天在Lekimdikator Live上關注我們在YouTube上的視頻! Lekimdikator計算進入或離開市場的最佳價格 與您喜歡的指示器一起使用! 了解如何在Lekimdikator上的股票交易所,外匯,股票,股票期權,外匯,投資基金,房地產基金或任何可訪問MetaTrader 5的市場上進行交易 它是針對新手或經驗豐富的交易者的工具,每個人都需要使用它來保護自己的帳戶並在交易中獲得更多紀律 Jiàgé fànwéi jìsuàn qì xiāngxìn wǒ de jiàgé, xiāngxìn, xìnyǎng! Měitiān zài Lekimdikator Live shàng guānzhù wǒmen zài YouTube shàng de shìpín! Lekimdikator jìsuàn jìnrù huò líkāi shìchǎng de zuì jiā jiàgé yǔ nín xǐhuān de zhǐshì qì yīqǐ shǐyòng! Liǎojiě rúhé zài Lekimdikat
TheCubeBars - Colored Volume Indicator for MetaTrader 5 Full Description What is TheCubeBars? TheCubeBars is a revolutionary indicator that transforms volume visualization in MetaTrader 5, coloring candles according to the intensity of tick volume. Developed by Ethernal, it offers: Instant visualization of volume strength in each candle Testimonials "After I started using TheCubeBars, my breakout hit rate improved by 40%!" - Ricardo F., Professional Trader "Finally a volume indicato
TheCubeBars - Colored Volume Indicator for MetaTrader 5 Full Description What is TheCubeBars? TheCubeBars is a revolutionary indicator that transforms volume visualization in MetaTrader 5, coloring candles according to the intensity of the tick volume. Developed by Ethernal, it offers: Instant visualization of the volume strength in each candle Testimonials "After I started using TheCubeBars, my breakout success rate increased by 40%!" - Ricardo F., Professional Trader "Finally a vol
RaSunGod
Alexandro Matos
NO DLL NEEDED ! #property description "  RÁ – WHY RÁ ?" #property description "  YOU CAN START WITH LITTLE AND MAKE A LOT OF PROFIT" #property description "  ADX with thousandths filter for precise entries" #property description "  Trade only at the best times or 24 hours, you choose! " #property description "  Resets lot size when targets are reached" #property description "  Customizable settings for any trading style" #property description "  CREATED BY TOMAS LEKIM "
PaintPatternCandle - The Most Advanced Candlestick Pattern Indicator on the Market Detailed Description (300+ Lines) What is PaintPatternCandle? PaintPatternCandle is a revolutionary indicator for MetaTrader 5 that automatically identifies and colors 13 candlestick patterns in real time. Developed by ETHERNAL, it transforms your technical analysis into an intuitive visual process, highlighting buy and sell opportunities with vibrant colors. Unique Features 13 Recognized Patterns: E
IsisQueen
Alexandro Matos
ISIS Indicator - The Power of Moving Average Crossovers for Accurate Trading ISIS Indicator Overview ISIS is an advanced technical indicator for MetaTrader 5, designed to identify accurate buy (BUY) and sell (SELL) signals based on the crossover of two configurable moving averages. It is designed to be used in conjunction with the OSIRIS robot, but can also be applied manually by traders looking for trend-based strategies. With a smart combination of a fast moving average (Fast MA) and a sl
Osyrys
Alexandro Matos
使用 Osiris 掌控市场走势 基于智能移动平均线和高级风险管理的高精度自动化系统! 趋势跟踪: 非常适合欧元/美元和英镑/美元等波动性货币对 Osiris 是一款专业的智能交易系统 (EA),旨在交易外汇、指数和贵金属,其特点包括: 子窗口中设有两条可自定义的移动平均线,可精准识别趋势。 仅支持 Tomas Lekim 的 CUBE THEORY 价格交易 动态水平线,突出显示反转区域 智能风险管理:止损、止盈和自动调整手数。 可选反转模式,适应波动性市场。 ◼ ◼ ◼ 通过 重置后的最低余额和 盈利来控制余额和利润目标 每日、每周或每月增加交易手数键 ◼ ◼ ◼ 逻辑控制“当亏损大于盈利时反转或止损” MAXORDERS 参数用于控制订单数量! 适用人群: 寻求自动化且简单易用的交易者。 希望交易多种货币对(EURUSD、XAUUSD、GBPUSD 等)的交易者。 重视完全控制参数的初学者或专业人士。 独家优势: ️ 高级保护: 实时保证金检查。 反向平仓 ◼ ◼
H4des
Alexandro Matos
出售 Hades EA 的精彩描述 “HADES EA” – 外汇之神的机器人! 使用 HADES 称霸市场,这款专家顾问旨在像真正的外汇之神一样交易!HADES 将智能移动平均线策略与先进的风险管理相结合,旨在最大化利润的同时保护您的资金。 为什么选择 HADES? 久经考验的策略 – 移动平均线交叉,千分之一精度过滤器,可实现精准入场 时间控制 – 仅在最佳时机或 24 小时交易,由您选择! 智能风险管理 – 止损、止盈和自动增加交易手数 利润重置 – 达到目标时重置交易手数,保护您的利润 灵活强大 – 可自定义设置,适用于任何交易风格 “今晚,我们在 Hades 用餐!” – 列奥尼达斯国王 别让您的资金闲置 – 让 HADES 发挥作用,让您的账户焕然一新! 强大的回测功能 | 轻松设置 | 始终如一的结果 体验外汇黑市的力量!
AnubisTheGuardian
Alexandro Matos
#property description " ANUBIS – WHY ANUBIS ?" #property description " YOU CAN START WITH LITTLE AND MAKE A LOT OF PROFIT" #property description " CCI INDICATOR FOR TRIGGERS with thousands of filters for precise entries" #property description " Trade only at the best times or 24 hours, you choose!" #property description " Resets lot size when targets are reached" #property description " Customizable ATR BASED STOPS settings for any trading style" #property description " CREATED BY
Demiurgo
Alexandro Matos
NO DLL NEEDED ! DEMIURGO — The Market Architect Demiurgo is more than an Expert Advisor — it’s a market architect, designed to build trades with precision, discipline, and adaptability. Named after the ancient concept of the Demiurge, the creator who shapes order from chaos, this EA uses layered Moving Average strategies, dynamic lot sizing, and time-based control to turn volatile price action into structured profit opportunities. Key Features Controlled Operation Hours — Activate on
Aeth3r
Alexandro Matos
AETHER – Dual Matrix Adaptive Trading System AETHER is a unique Expert Advisor that combines two independent matrices to map the market: Price Matrix: Precise division of the price into thousandths to find strategic reversal or continuation points. Time Matrix: Intelligent segmentation of the chart into time columns, adapting the strategy to the asset and timeframe in use. 100% automated trading Compatible with any asset and timeframe Integrated dashboard showing: Open positions E
EnkY
Alexandro Matos
NO DLL NEEDED ! //+------------------------------------------------------------------+ #property description "  ENKI – WHY ENKI ?" #property description "  YOU CAN START WITH LITTLE AND MAKE A LOT OF PROFIT" #property description "  SAR PARABOLIC  with thousandths filter for precise entries" #property description "  Trade only at the best times or 24 hours, you choose! " #property description "  Resets lot size when targets are reached" #property description "  Customizable setting
Centundecim
Alexandro Matos
NO DLL NEEDED ! Centundecim Automata Negotiationis Strategia mathematica a gradibus numericis universalibus inspirata Centundecim Automata Negotiationis est Consiliarius Peritus plene automatus qui pretia in millesimis identificat et negotiationes in punctis mathematice pertinentibus in charta aperit. Proprietates principales: Inscriptiones in incitamentis numericis (L1–L6) fundatae, sine indicibus externis. Gestio voluminis automatica: magnitudinem partis ad bilancium et marginem praest
Shamash
Alexandro Matos
SHAMASH is a simple and efficient robot that allows the user to start with a small balance and, depending on how they use it, can turn them into a millionaire. - Balance and profit control - lot increments input double lot_size = 0.01;                                        // Lotz input double stop_loss = 900;                                        // sTOp lOSs  input double take_profit = 95;                                       // tAKe peoFIt input int order_deviation = 4;                 
VeloTicker PRO
Alexandro Matos
VeloTicker PRO — Real-Time Flow Reading VeloTicker PRO is an advanced indicator designed for traders looking to interpret market dynamics beyond just price. With an intuitive visual interface based on dual gauges (BUY vs. SELL), it transforms market flow into clear signals, enabling faster and more precise decision-making. What It Delivers Instant reading of buying and selling pressure Clear visualization in a gauge (speedometer) format Rapid response to market changes Intelligent smoot
ADX Panel - Professional Trading Dashboard Monitor the Market in Real Time with Surgical Precision The TCT ADX Panel is a professional indicator that transforms your chart into a complete control center for your trades. With a clean design and essential information always visible, you'll never miss important market details again. WHAT YOUR DASHBOARD SHOWS Real-Time Account Status Balance, Equity, and Profit/Loss updated tick by tick Percentage drawdown with color-coded visual alert
Tct RSI Panel
Alexandro Matos
TCT RSI PANEL - Relative Strength Dashboard IDENTIFY OVERBOUGHT AND OVERSOLD CONDITIONS WITH PRECISION The TCT RSI PANEL is a professional indicator that monitors the RSI (Relative Strength Index) and generates signals at extreme levels, combined with "thousandths" levels for precise entry points. WHAT YOUR DASHBOARD DISPLAYS ACCOUNT DATA: • Balance, Equity, Profit, and Drawdown in real-time O
TcT MACD Panel
Alexandro Matos
TCT MACD PANEL - Momentum Dashboard CAPTURE MOMENTUM SHIFTS WITH PRECISION The TCT MACD PANEL monitors the MACD (Moving Average Convergence Divergence) and generates signals based on the crossover of the MACD line with the signal line, combined with "Milésimos" (Thousandths). WHAT YOUR PANEL DISPLAYS Account: Balance, Equity, Profit, Drawdown Positions: Buys, Sells, Total MACD: MACD Line, Sig
TcT CCI Panel
Alexandro Matos
TCT CCI PANEL - Commodity Channel Dashboard DETECT BREAKOUTS AND REVERSALS IN THE COMMODITY CHANNEL The TCT CCI PANEL monitors the CCI (Commodity Channel Index) and generates signals within extreme zones (+100/-100), combined with "Milésimos" (thousandths) for maximum precision. WHAT YOUR DASHBOARD DISPLAYS Account: Balance, Equity, Profit, Drawdown Positions: Buys, Sells, Total CCI: Current
TcT MA Dashboard
Alexandro Matos
TCT MA PANEL - Moving Average Dashboard THE BEST WAY TO VISUALIZE PRICE VS. MOVING AVERAGE The TCT MA PANEL monitors the relationship between price and its Moving Average, generating clear trend signals. WHAT YOUR PANEL DISPLAYS Account: Balance, Equity, Profit, Drawdown Positions: Buys, Sells, Total MA: Average value, relationship to current price Milestones: Detection, Last Touched, Next
TcT SaR DashBoard
Alexandro Matos
TCT SAR PANEL - Parabolic Dashboard SMART TRAILING STOP WITH VISUAL SIGNALS The TCT SAR PANEL monitors the Parabolic SAR—one of the best indicators for trailing stops and trend identification. WHAT YOUR DASHBOARD DISPLAYS Account: Balance, Equity, Profit, Drawdown Positions: Buys, Sells, Total SAR: Position of the dots relative to the price Millipips: Detection, Last Touched, Next
TCT BB PANEL - Bollinger Bands Dashboard MASTER VOLATILITY WITH BOLLINGER BANDS The TCT BB PANEL monitors Bollinger Bands, identifying volatility squeezes and price extremes. WHAT YOUR DASHBOARD DISPLAYS Account: Balance, Equity, Profit, Drawdown Positions: Buys, Sells, Total BB: Upper, Middle, and Lower Bands Milestones: Detection, Last Touched, Next
TCT COMPLETE BUNDLE - All 7 Panels COMPLETE COMBO WITH ALL INDICATORS Get all 7 TCT panels at a special price and have every trend analysis tool right at your fingertips! PACKAGE INCLUDES TCT ADX PANEL (Direction & Strength) TCT RSI PANEL (Overbought/Oversold) TCT CCI PANEL (Channels & Breakouts) TCT MACD PANEL (Momentum) TCT MA PANEL (Moving Average) TCT SAR PANEL (Parabolic Stop) TC
MULTIPLE VOTING INDICATOR - The Power of 7 Indicators in ONE Trade with Consensus, Not Guesses Stop relying on individual indicators that generate false signals. The MULTIPLE VOTING INDICATOR combines 7 professional indicators into one powerful system that generates a signal only when the MAJORITY agrees. WHAT YOU GET 1. VISUAL ARROWS ON THE CHART GREEN ARROW UP = BUY Signal (majority voted BUY) RED ARROW DOWN = SELL Signal (majority voted SELL) Appears directly on your chart, on
The Cube MA
Alexandro Matos
MATC — Cube Theory M.A An indicator that moves only when the price actually touches the structure—not on every bar or event. Description Most oscillators and moving averages recalculate at the close of each bar, tracking the passage of time. The MATC follows a different logic: it updates its value only when the price touches one of the levels of a four-layer fractal grid (Cube Theory—M1 through M4, ranging from larger to smaller scales). Between touches, the value remains static. The result i
The Cube MA Cross
Alexandro Matos
MATC CROSS VERSION — Arithmetic Averages Cube Theory An indicator that only moves when the price actually touches the structure — not with each bar, with each event. Description Most oscillators and moving averages recalculate with each closed bar, following time. MATC follows a different logic: it only updates its value when the price touches one of the levels of a four-layer fractal grid (Cube Theory — M1 to M4, from larger to smaller scales). Between touches, the value remains still. The re
Ulysses
Alexandro Matos
ULYSSES — Consultor Especialista em Negociação Automatizada ULYSSES é um Expert Advisor projetado para traders que desejam automatizar suas negociações no MetaTrader 5, combinando análise de tendências, filtros de entrada proprietários e gerenciamento automático de posições. O robô foi desenvolvido para monitorar o comportamento do mercado de forma sistemática, eliminando decisões emocionais e executando negociações com base em uma lógica predefinida. Principais recursos Negociação 100% au
Polifemo
Alexandro Matos
POLIFEMO EA  Este bot foi testado apenas no simulador de estratégias, com uma aposta inicial de US$ 10. Antes de utilizá-lo em uma conta real, teste-o em uma conta demo. Nos meus testes, consegui atingir um índice Sharpe de 19% — um valor que nenhum outro bot no mundo jamais alcançou. Execute backtests; você poderá obter melhores resultados. Está escrito em português, então traduza para entender. 
筛选:
无评论
回复评论