Currency Strength Dynamic
- 指标
-
Ivan Butko
 問候,朋友們!
我用 mql4 和 mql5 寫。 在我的市場上你會發現各種各樣的產品,每天我都會開發一些新東西,我會研究一些東西。 新的指標和顧問將在不久的將來出現。
請參閱 https://www.mql5.com/ru/users/capitalplus/seller - 版本: 1.0
- 激活: 20
Currency Strength Dynamic
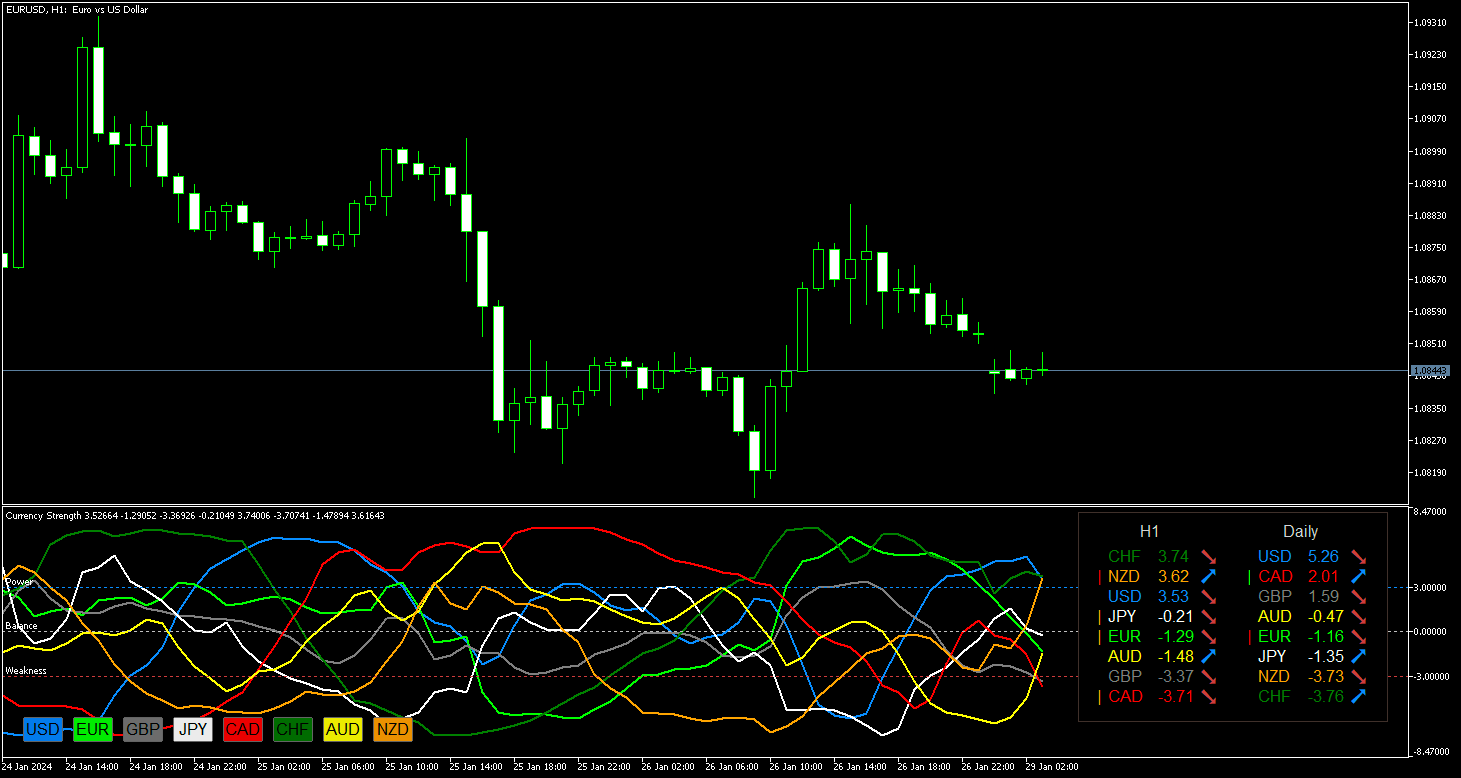
貨幣強弱動態是貨幣強弱的指標。 貨幣強度是指某種貨幣所屬的大多數或所有貨幣對的趨勢方向。
該指標基於 28 種最受歡迎的貨幣對(主要貨幣對和次要貨幣對)的移動平均線之間的差異讀數,類似於 MACD 指標。
優點
- 獨特的振盪計算方法
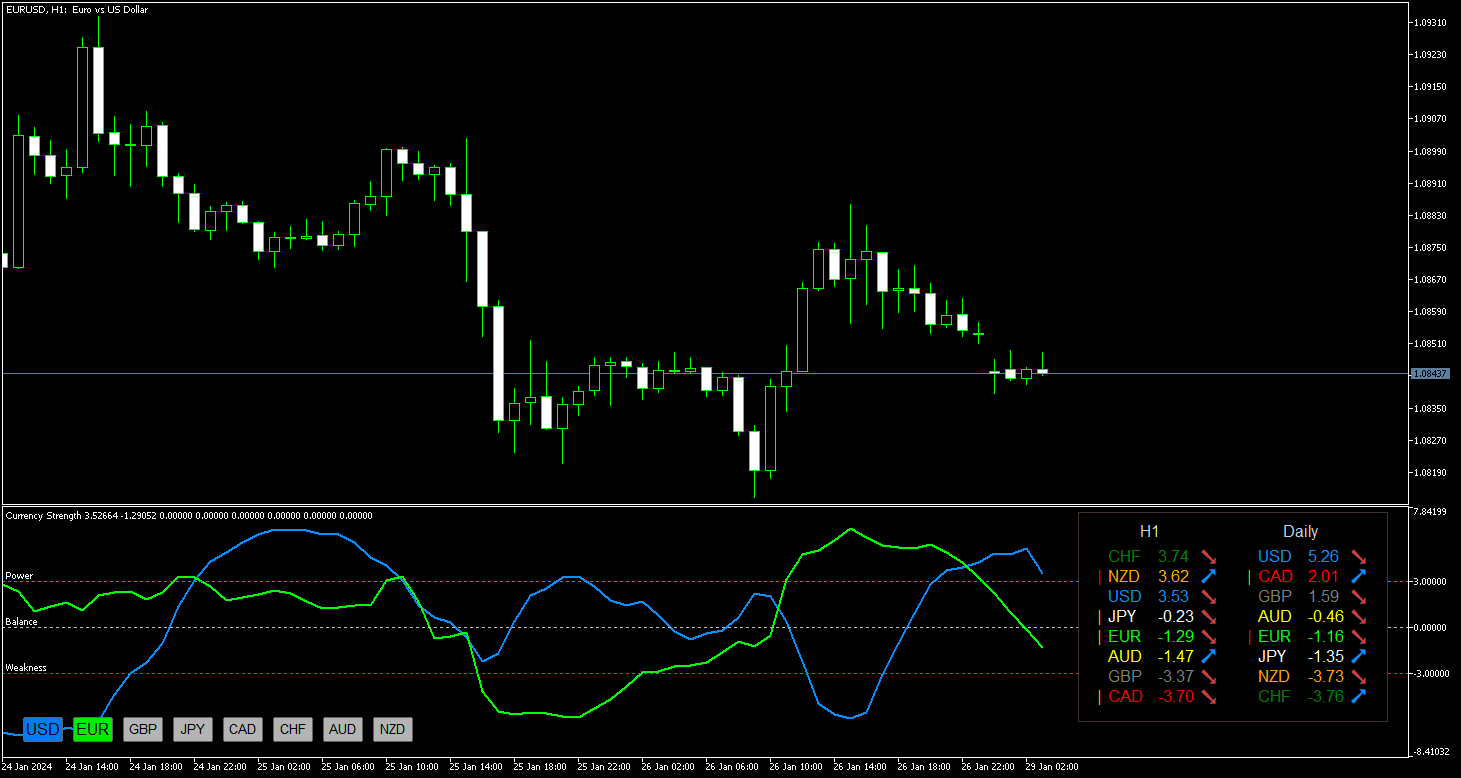
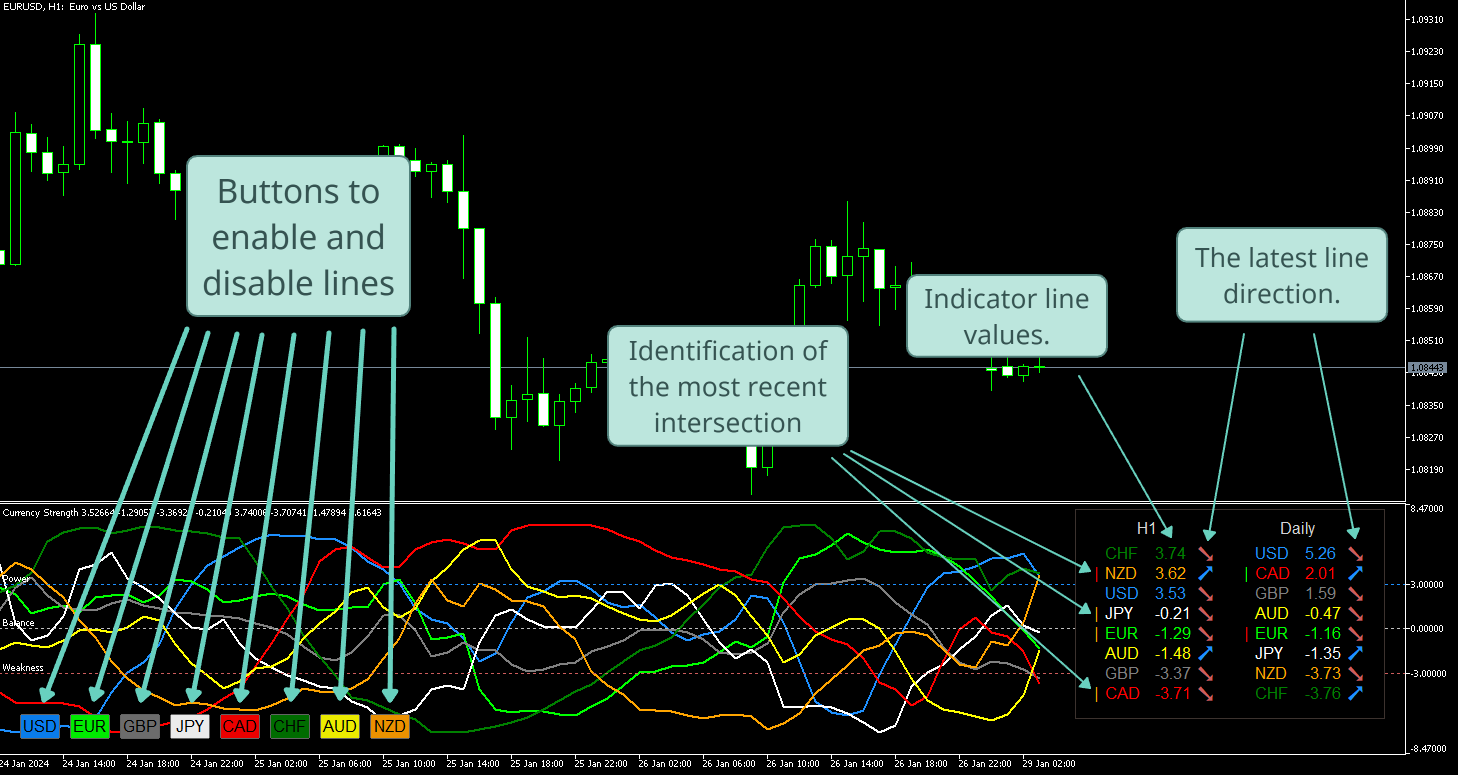
- 可用按鈕停用或啟用特定貨幣行
- 資訊表
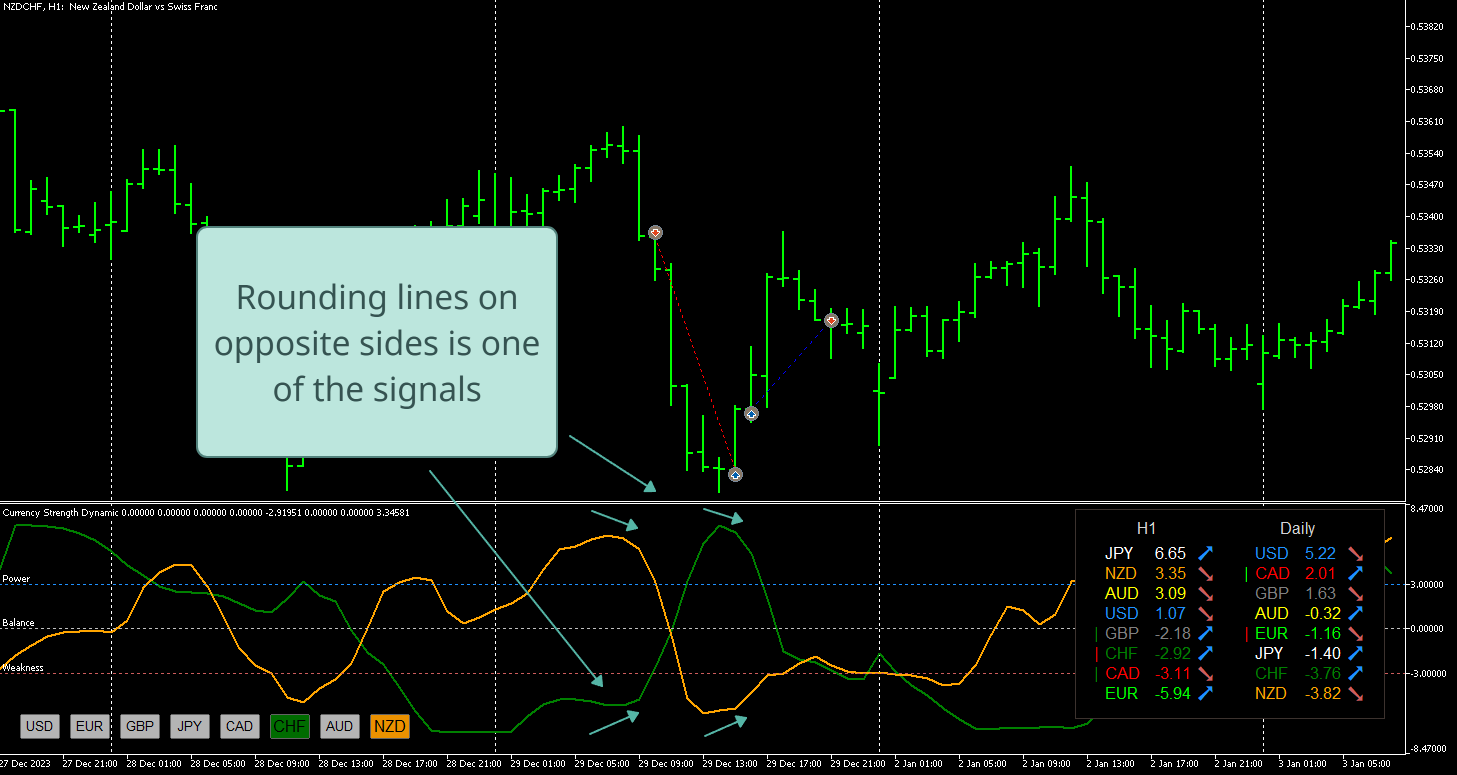
- 2 種類型的警報:當指標線交叉時和當指標線交叉指定水平時。
- 繪製的條數是可選的。
讓我們詳細看看每一點:
獨特的振盪計算方法使指標不會長時間保持在最大值,而是提前退出它們,類似於熟悉的背離和收斂效果。 該方法還包括指定的計算週期和讀數的平滑程度,這使得讀數更加平滑。 計算中不包含不必要的混亂和不必要的冗餘公式,因此減少了終端的負載。
使用按鈕來停用或啟用特定貨幣行是最方便的功能之一,因為它可以讓您擺脫未使用的貨幣,或者只是在視覺上提高您的可見性。
資訊板是該指標的另一個便利功能;它不僅反映了線條的數值讀數,還反映了高級 TF 的讀數。 此外,還有最後走勢方向的箭頭,以及指示哪些貨幣交叉的垂直配對符號。 最後的運動箭頭記錄了倒數第二根柱上的運動 - 這是一個非常方便的功能,用於直觀地識別最大值或最小值反轉的開始。
繪製的柱數是一個非常有用的功能,不僅對於那些不需要查看整個歷史記錄的人來說,而且還可以節省處理器資源。 在多貨幣指標中,由於不僅需要 28 種貨幣對的報價請求,而且如果需要,還需要其他金融工具的報價,因此計算會增加數倍。 因此,限制條數可以顯著節省時間、資源並減少終端的負載。
使用貨幣強弱動態指標作為您交易系統的補充
也試試我在市面上的其他產品 https://www.mql5.com/ru/users/capitalplus/seller
✅ 如果您喜欢该指标,请对其进行评分并留下评论,这对我来说非常重要!
交易獲利豐厚!