Correlation Matrix MT5 Indicator by PipTick
- 指标
-
Michal Jurnik
 "Talent is cheaper than table salt. What separates the talented individual from the successful one is a lot of hard work." - Stephen King. Those few words reflect myself very well. I am probably not the most talented developer in the world but I truly believe in hard work, professional attitude and
 - 版本: 1.2
- 更新: 3 十二月 2021
- 激活: 5
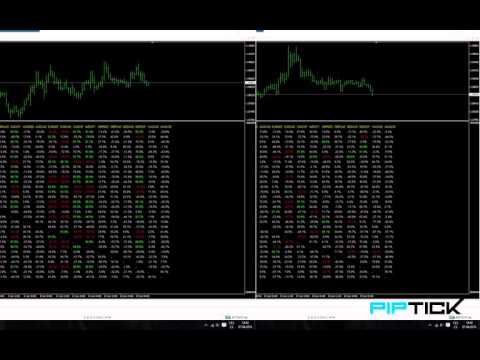
The Correlation Matrix indicator shows the actual correlation between the selected instruments. The default setting is set to 28 currency pairs, gold, and silver, but the indicator can compare any other symbols.
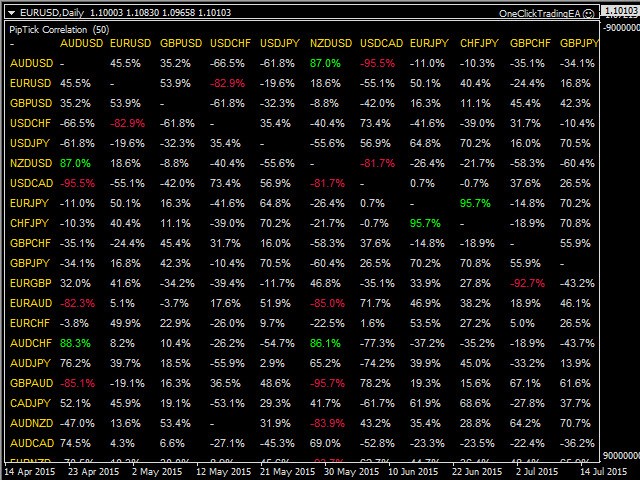
Interpretation of the indicator
- Positive correlation (correlation is above 80 %).
- Negative correlation (correlation is below -80 %).
- Weak or no correlation (correlation is between -80 and 80 %).
Main features
- The indicator shows the actual correlation between the selected instruments.
- A simple comparison of one symbol against another.
- Works on every timeframe (M1, M5, M15, M30, H1, H4, D1, W1, MN).
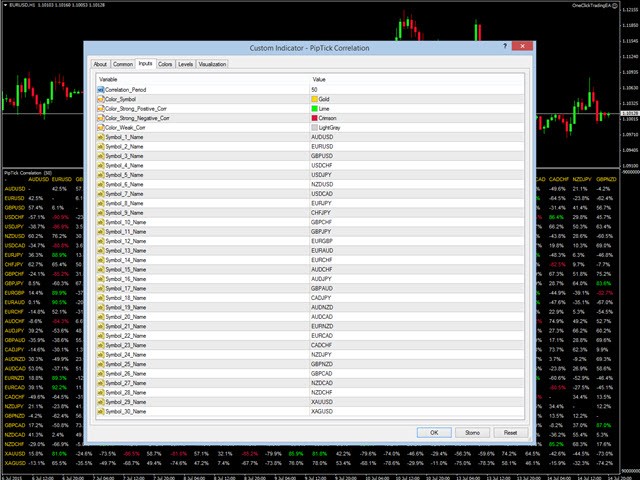
- Customizable parameters (Colors, Correlation Period, Symbols...).
- High-speed calculation.
- The indicator works with prefixes and suffixes of symbols as well (EURUSD.m, EURUSD-pro...).
- Available for MT4 and MT5.