适用于MetaTrader 5的EA交易和指标 - 53
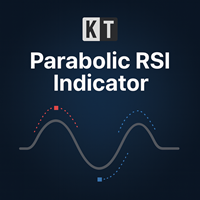
KT Parabolic RSI 将抛物线SAR直接叠加在RSI线上,用来突出可能的市场转折点。传统的RSI超买和超卖读数已经提示潜在的反转,但加入PSAR过滤器后,能有效去除大量噪音,使信号更加清晰和可靠,从而为交易者提供更稳健的入场和出场机会。 大方块信号: 当RSI处于超买或超卖区域时,Parabolic SAR翻转。这通常标志着高概率的市场转折。 小方块信号: 当RSI位于中性区间时出现的SAR翻转。将其视为低概率提示,更适合用于部分止盈或顺势跟随。
功能特点 将RSI动能和Parabolic SAR趋势翻转整合在同一个窗口中,无需再使用两个分离的指标。 出现在RSI窗口中的方块标记会同步显示在主图表上,这样您可以在观察价格走势的同时捕捉到信号。 结合K线形态分析和RSI-SAR定量信号,帮助您在入场前确认图表形态的可靠性。 支持自定义RSI周期、Parabolic SAR步长与最大值,以及超买和超卖阈值,以便适应不同交易风格与市场环境。 提供弹窗、声音、邮件和移动推送提醒,让您即使不在电脑前也能及时掌握每一个信号。
为什么结合RSI和Parabolic SAR有效 RSI
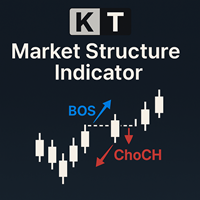
The KT Market Structure intelligently detects and displays Break of Structure (BOS) , Change of Character (CHoCH) , Equal Highs/Lows (EQL) , and various significant swing high/low points using our proprietary algorithm for accurate pattern detection. It also offers advanced pattern analysis by effectively demonstrating the captured profit for each pattern. A fully automated EA based on this indicator is available here: KT Market Structure EA MT5
Features
Accurate Pattern Detection: Our advance

Советник для скальпирования фьючерса BR на ММВБ. Внутридневный, в 23=45 закроет позицию. Работает на 15-ти минутках. По появлению отфильтрованного индикаторами сигнала на покупку/продажу выставляет отложенный ордер. Более короткий вариант таймфрейма выбирать не рекомендую из-за введенных ограничений для переменных в примененных индикаторов. Мартингейл не применён, EA тестирован на ММВБ на срочном рынке и только на фьючерсах BR. Для демонстрации результатов на склейке, параметры дооптимизир
FREE

Keep your MetaTrader 5 charts alive, updated, and always in sync — automatically.
The MT5 Auto Refresh Utility is a smart, zero-lag chart updater designed for traders who want real-time accuracy across every open chart. Whether you use complex dashboards, multi-timeframe systems, or long-running analysis setups, this utility ensures your charts stay active and refreshed without manual clicks or chart reloading. Why You’ll Love It Automatic Chart Refresh
Refreshes your MT5 chart at a fixed int
Custom Candle – Multi-Timeframe Visualization Analyzing multiple timeframes is essential for accurate trading decisions, but switching between charts can be inconvenient and inefficient. The Custom Candle indicator solves this problem by overlaying higher-timeframe (HTF) candles directly onto your lower-timeframe (LTF) chart. This allows you to see the bigger picture at a glance, align with the higher trend, and improve trade accuracy—without leaving your current chart. Key Features Multi-Timefr
FREE

EMLU Precision AI — Free Demonstration Version for MT5 Type: Expert Advisor (MT5) ️ Important Notice (Read Before Downloading) This Free version of EMLU Precision AI is designed strictly for demonstration, research, structural inspection, and interface familiarisation . It does not represent the behaviour, logic depth, live signals, or performance results of the full paid version. Performance, trade frequency, and result quality are intentionally reduced to prevent misuse of the free edition as
FREE

Candle Countdown Pro – Real-Time Timeframe & Spread Tracker Love it? Hate it? Let me know in a review! Feature requests and ideas for new tools are highly appreciated. :) Try "The AUDCAD Trader":
https://www.mql5.com/en/market/product/151841 Never miss a candle close again! Candle Countdown Pro is an essential trading tool that displays real-time countdowns for multiple timeframes,
live spread monitoring , and key trading information—all in one clean, customizable panel.
Key Features:
FREE

自动化艾略特波浪理论 (Automated Elliott Wave) 1. 自动数浪并减少主观偏见 (客观性) 通常,艾略特波浪的计数往往带有很强的“主观想象”或个人观点。该指标通过以下方式提供帮助: 寻找推动浪 (Impulse Wave 1-2-3-4-5): 使用严格的规则(例如:第3浪不能是最短的,第4浪不能与第1浪重叠),为您展示理论上正确的价格结构。 寻找调整浪 (Corrective Wave A-B-C): 帮助捕捉价格回调的时机,以便顺势再次入场。 2. 多层次分析 (Multi-Degree Analysis) 该指标不仅仅关注单一时间框架,而是同时分析3个深度的波浪级别,提供3D市场视图: 微浪 (Minor): 用于观察快速波动。 中浪 (Intermediate): 用于观察主要趋势。 主浪 (Primary): 用于观察市场大局。 优点: 您可以根据自己的交易风格开启或关闭每个级别的显示。 3. 寻找价格目标和入场点 (Targeting & Entry) 当系统发现完整的波浪时,它不仅会标记波浪,还会帮助制定交易计划: 斐波那契预测 (Fibonacci
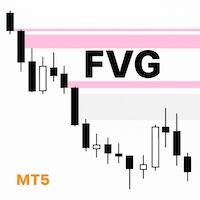
What Makes UTurn FVG indicator Unique I’m a trader, and I built a simple and clean FVG indicator that focuses on what traders actually need. Flexible color and transparency settings. The option to extend unmitigated and partially mitigated FVGs to the current price. Automatic removal of fully mitigated FVGs. Clear visual confirmation when an FVG has already been tested. A clean, professional look that helps traders make faster, more confident decisions. Overview UTurn FVG is a clean, efficient,
FREE

描述
Candlestick Pattern Analyzer 是一款面向离散交易者和系统交易者的高级工具,旨在自动识别主要日式蜡烛图形态,并对其历史表现进行详细的统计分析。
该指标非常适合希望验证图形态实际有效性,并将其与确认筛选(如趋势、关键水平、成交量等)以及明确的风险管理策略结合使用的交易者。 主要功能 自动检测超过 20 种蜡烛图形态(吞没形态、十字星、光头光脚线、锤头、流星、孕线等) 计算每种形态出现后可调节数量的后续 K 线内的平均收益和累计收益 显示检测到的形态总数,以客观评估其出现频率 在图表上通过彩色框和文字标注直观突出每个形态 新图形态出现时实时推送通知和警报 界面完全可定制:选择启用的形态、配色方案、分析周期和数据显示位置 优势
许多交易者对蜡烛图形态的解读依赖直觉和主观判断。Candlestick Pattern Analyzer 提供定量化、可视化的方法,帮助你识别在所选标的或时间框架内真正具有统计优势的图形态。 使用场景 研究具有实际统计优势的蜡烛图形态 构建基于客观数据的交易策略 实时接收可视化信号和交易提醒 重要提示
本工具非自动交易系统,而是

AI Trend Targets – Precision Entries, Targets & Risk in One Overlay AI Trend Targets is a premium smart overlay that turns raw price action into clear, rule-based trade plans: entry, dynamic guard (SL) and three projected targets (TP1–TP3).
It is designed for XAUUSD, major FX pairs and index CFDs, and works on intraday as well as higher timeframes. What it does Behind the scenes, AI Trend Targets combines: A volatility-adaptive “AI Baseline” to define trend direction Context-aware rejection logi
FREE

Guardian Equity EA for MetaTrader 5 Guardian Equity EA is an Expert Advisor designed to automatically manage the closure of all open positions when predefined profit or drawdown levels are reached. It operates in real-time and is compatible with any broker or trading instrument supported by MetaTrader 5. Main Features Continuous monitoring of account balance and equity. Automatic closing of all trades if the maximum drawdown level is reached. Automatic closing if the configured profit target is

The Basket expert advisor can open up to 10 trades at once. It was developed for basket traders who need to open a lot of trades on many different pairs. Expert advisor allows to set a take profit and stop loss as a value in money for each basket trade. This EA is also equipped with hedge functions and allows traders to use the Classic hedge strategy or Sure-Fire strategy, also known as "Always in profit".
Main features Opening multiple trades simultaneously EA Works on any market (forex,

Haven Fibonacci Volume Profiles — 您的自动市场区间分析师 隆重推出 Haven Fibonacci Volume Profiles — 一款将市场分析提升到新水平的强大工具。该指标可自动识别基于重要转向点(枢轴点)构建的关键价格区间,并在每个区间上叠加详细的成交量分布图和斐波那契水平。这使交易者能够即时了解流动性集中在哪里,以及真正的支撑位和阻力位位于何处。 其他产品 -> 这里 . 无需再猜测哪个区间是有效的。该指标为您完成所有复杂的工作,同时显示历史和当前的价格区间,让您全面了解市场背景。 指标主要功能 自动识别区间: 指标可独立找到重要的高点和低点(枢轴点),并在此之间构建价格区间。 详细的成交量分布图: 为每个区间计算并显示成交量分布图,突出显示交易活动最多和最少的区域。 可自定义的斐波那契水平: 斐波那契水平会自动应用于每个区间。您可以启用、禁用并自定义每个水平的颜色(0.0、0.236、0.5、1.0 等)。 POC(控制点)可视化: 成交量分布图清晰显示成交量最大的水平,该水平通常作为强支撑或阻力。 历史分析: 指标不仅显示当前的价格区间

Adaptive ATR Trailing Stop Volatility-Adaptive Stop Loss Management Tool This Expert Advisor manages stop losses for existing positions using the Average True Range indicator to adapt trailing distance based on current market volatility. Brief Description Adaptive ATR Trailing Stop is a utility Expert Advisor that automatically adjusts stop loss levels for open positions. The tool uses ATR to calculate appropriate trailing distances that adapt to changing market conditions, protecting gains whil
FREE

MTF Currency Pairs Breakout Scanner v1.1 (MT5) Description MTF Currency Pairs Breakout Scanner is a technical analysis indicator for MetaTrader 5 designed to scan multiple Forex symbols across multiple timeframes and detect channel breakout conditions based on predefined rules. The indicator provides visual signals and alerts only .
It does not perform automatic trading and does not guarantee trading results. Disclaimer This product is intended for technical analysis and market monitoring purpo
FREE

Excellent tracking performance and minimal noise! This trend detection indicator that avoids whipsaws and uncertain market noise and is also agile enough to react to changes in trend.
It is also designed to adapt to dynamic markets.
Functions mainly as a filter to help you trade in the direction of the trend.
Features.
Simple and easy to use. Low load and easy to try out The excellent tracking performance and smooth lines that make it ideal for market analysis Can be used as a trend filter for
FREE

Multi-Currency Strength Dashboard PRO MT5 (v2.6) – 货币强弱仪表盘指标 Multi-Currency Strength Dashboard PRO 是一款用于 MetaTrader 5 的指标,可实时计算并显示 8 种主要货币 (USD、EUR、GBP、JPY、CHF、CAD、AUD、NZD)的相对强弱,并分析最多 28 个外汇货币对 (具体取决于您的经纪商是否提供相应交易品种)。 本工具旨在提供清晰、结构化的强弱概览,帮助您更快地 筛选需要进一步分析的货币对 (强势货币对弱势货币),并识别强弱差较小、方向性可能较弱的组合。 主要功能 图表内可视化仪表盘 :以强弱柱状条显示结果(0–100 归一化刻度)。 最多 28 货币对分析 :自动生成可用品种列表,并支持经纪商后缀(如存在)。 Best Pairs :根据可配置的最小强弱差,列出值得关注的组合。 Worst Pairs :识别强弱差较小的组合,用于过滤与回避。 提醒功能 :强势/弱势货币提醒与最佳机会提醒(可选推送通知)。 v2.6 更新内容 新增 3 种计算模式 : Price

DA 100€/$ A 400.000 IN UN ANNO !!! SI è PROPRIO COSI QUESTO BOT METTE AUTOMATICAMENET L'INTERESSE COMPOSTO. ( SCARICARE IL FILE SET DA INSERIRE NELLE IMPOSTAZIONI ALTRIMENTI IL BACK TEST NON FA GLI STESSI PROFITTI, LO TROVATE SOTTO I COMMENTI )
G-load Pro. MARCHIO REGISTRATO è L'UNICO ORIGINALE I TEST SONO STATI FATTI SU XMGLOBAL ( NO ECN) ( SCARICARE IL FILE SET DA INSERIRE NELLE IMPOSTAZIONI ALTRIMENTI IL BACK TEST NON FA GLI STESSI PROFITTI, LO TROVATE SOTTO I COMMENTI )
TIME FRAME h1
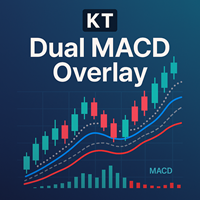
KT Dual MACD Overlay 在价格图表上直接叠加两组完整的 MACD:一组来自当前周期,另一组来自更高周期。快速 MACD 捕捉短线动能,而慢速 MACD 让你始终与大周期趋势保持一致。 两者与 K 线同屏显示,无需来回切换窗口即可获得市场动能的完整视角。
买入信号
主买入: 当上涨趋势启动时,图表会出现一条蓝色竖线。 加仓买入: 快速 MACD 上穿信号线且得到慢速 MACD 与总体多头趋势确认时触发。 卖出信号 主卖出: 当下跌趋势启动时,图表会出现一条橙色竖线。 加仓卖出: 快速 MACD 下穿信号线且得到慢速 MACD 与总体空头趋势确认时触发。
功能 双 MACD(快+慢)联用,形成更完整可靠的系统;单一 MACD 往往缺乏背景。 用竖线清晰标记新趋势起点。 即使错过主入场,仍提供多次顺势再入场机会。 相比标准 MACD 金叉死叉,叠加方案精度与可读性更高。 三类关键事件提醒:主趋势变化、快速 MACD 交叉、来自高周期的慢速 MACD 交叉。 对快速 MACD 交叉进行平滑处理,降低虚假信号。 从零开始编码,界面简洁无杂乱。 支持所有 MetaTrader
Volume Flow Indicator (VFI) - User Manual 1. General Introduction The Volume Flow Indicator (VFI) is an advanced technical oscillator designed to measure the strength and sustainability of a price trend by incorporating both price and volume data. Developed based on the concepts of On-Balance Volume (OBV) but with significant improvements, the VFI provides deeper insight into money flow and the conviction behind price movements. This indicator is not an automated trading system but a powerful an
FREE

Megatron Shark Indicator – MT5 Harmonic Pattern Detection Tool The Megatron Shark Indicator is a MetaTrader 5 tool for detecting and displaying Shark harmonic patterns directly on the chart. It automatically identifies bullish and bearish Shark formations, calculates entry, stop-loss, and take-profit levels, and provides real-time alerts. This allows traders to quickly integrate harmonic pattern analysis into their trading process without manual drawing. Advantages * Automatic Pattern Detection
FREE

INTRODUCTION Maximize Your Trading Potential Gold Miner Pro is an automated trading tool designed for the gold market (XAUUSD). It applies a precise scalping strategy powered by mathematical models and statistical analysis to detect favorable market setups. Specializing in gold trading, Gold Miner Pro works for you 24/7, minimizing risk and maximizing trading performance. Let Gold Miner Pro be your trusted companion in your gold investment journey!
RECOMMENDATIONS - Account Type: Use a Cent Acc

Smart Risk Manager FOREX – Free On-Chart Lot Size Helper Smart Risk Manager Forex is the free & simplified edition of the Smart Risk Manager family. It helps you calculate your position size on Forex pairs using a clean drag-and-release workflow. Just drag on the chart and the indicator shows the recommended lot size based on your RiskUSD amount. It is small, fast and easy to use. Features ️ Drag-to-measure lot size directly on the chart ️ Clean & very lightweight – no panels, no clutter
FREE

WYSIWYG OPEN RANGE BREAKOUT - PRO EDITION
Ultra-precise ORB indicator with smart line-breaking, dynamic ATR-based targets, and multi-session adaptability. Perfect for day, swing, and algorithmic traders seeking clear visuals and actionable levels . Trade with confidence – see what you trade, trade what you see . "What You See Is What You Get" "What You See Is What You Get" – The ultimate ORB indicator delivering ultra-precise trading range visualization with a smart line-breaking system. Built
FREE

This MT5 expert adviser is based on price action trading , which is a method of technical trading that relies on observing price movements and patterns. It can capture trend phases as well as be used as a scalping tool. The settings allow both options. You can also adjust the take profit and stop loss levels dynamically according to the market conditions by using the average daily range (ADR) . However, you should always do your own backtests with your data and understand that profits are not g

Trading Exporter for AI Assistant Trading Exporter for AI Assistant 是一款专为 MetaTrader 5 设计的专业指标,旨在以 JSON 格式 导出完整且结构化的交易数据 。其目的是让任何人工智能助手(无论是免费的还是付费的,如 ChatGPT、Gemini、Copilot、Claude 或 DeepSeek)都能分析这些信息,并提供个性化的建议、策略和解释。 特别推荐:DeepSeek 尽管此导出器兼容任何人工智能,但 特别推荐使用 DeepSeek ,原因如下: 扩展上下文能力 :非常适合处理指标导出的海量数据。 原生多语言支持 :与内含的 7 种语言完美兼容。 高级技术分析 :在解释技术模式和指标方面具有卓越能力。 高效的 JSON 处理 :专为处理复杂数据结构而优化。 导出哪些信息? 该指标会自动收集和整理以下数据: 历史价格和交易量数据 ,涵盖多个时间周期(M5、M15、M30、H1、H4、D1)。 原生技术指标 :MACD、RSI、ATR、Stochastic、ADX、布林带、DeMarker、MFI、A
FREE

Body Ratio 指标(MT5)– 蜡烛图强度与震荡压缩分析器 Body Ratio 指标是一款技术分析工具,用于评估蜡烛图结构,并根据实体(开盘与收盘之间的差)与总范围(最高与最低之间的差)之间的比例来识别市场状态。
这种简单但强大的计算方法可以帮助交易者识别出具有强烈方向性动量的蜡烛图、犹豫不决的蜡烛图以及通常出现在重大突破前的区间压缩阶段。 每根蜡烛图会被实时分类: 弱蜡烛图 (实体 < 总范围的30%):通常出现在 犹豫日 , 十字星 或 上影线/下影线很长的蜡烛图 ,表示市场缺乏明确方向 中性蜡烛图 (实体占比30%–70%):常见于 震荡区间 、 窄幅整理 、 波动收缩 或 压缩形态 (如 NR4、NR7、内包线) 强蜡烛图 (实体 > 总范围的70%):表示 强烈的趋势动能 ,适用于寻找 突破形态 、趋势延续以及顺势交易机会 该指标以彩色柱状图的形式实时显示在图表上,便于快速解读价格行为。 为什么使用此指标 识别 突破前的压缩形态 发现 犹豫蜡烛图 ,避免低质量交易信号 确认 强趋势蜡烛图 ,配合趋势方向交易 根据 蜡烛图质量 过滤不可靠的入场信号 在波动率收缩区域
FREE

动态RSI卫士 – 精准交易与全面风险管理 动态RSI卫士是一款专为重视稳定性能、严格风险控制和灵活性的交易者设计的专业算法交易系统。基于先进的点差计算和智能RSI驱动的过滤器,它确保每笔交易遵循严格的规则,以最小化风险,同时最大化机会。 主要功能 : 智能入场系统
• 基于RSI的多重过滤器确认
• 检测高概率信号并在图表上以箭头可视化 全面风险管理
• 基于风险百分比的动态手数计算
• 最大持仓量和交易检查(防止过度交易)
• 无效止损水平保护 高级退出策略
• 基于ATR或固定点差的追踪止损
• 可调止损和止盈(基于点差)
• 自动调整止损以适应经纪商限制 可视化HUD仪表板
• 实时状态(买入、卖出、阻止)
• 市场条件显示
• 信号跟踪和分隔线 支持回测与优化
• 专为剥头皮和日内交易设计
• 适用于多个交易对和时间框架
• 易于优化以适应不同策略 策略与使用 :
动态RSI卫士在低延迟环境(ECN/STP经纪商)中表现最佳。
推荐使用: 交易对 :EURUSD、GBPUSD、XAUUSD(黄金)、US30 时间框架 :M1 – M15 低点差经纪商以获
FREE

Trend Hunter EA: Stop Guessing, Start Trend Following Are you tired of entering trades that look perfect, only to have the market reverse strongly against you? The most common reason for this is trading against the dominant, underlying trend. The Trend Hunter EA is meticulously engineered to solve this exact problem by ensuring you are always trading in harmony with the market's primary direction. The Professional Strategy: Power on the High Frame, Precision on the Low Frame The Trend Hunter EA
FREE

GoldMacher – Session-Aware XAUUSD EA Start from $50 – Low Leverage 1:20 or 1:10 – Fixed Lot – No Martingale Contact me for the manual for back testing pls LAST COPY available at $90 MT4 Version available here Trade gold with structure, timing, and discipline.
GoldMacher is built for traders who want clarity, not complexity. It focuses on the sessions and market conditions where XAUUSD tends to behave in repeatable ways — and it stays quiet when conditions are poor. Why GoldMacher? Session int

Cycle Sniper MT5 Cycle Sniper MT4 Version and definitions : https://www.mql5.com/en/market/product/51950 Important Notes: MT5 Version does not include Breakout Mode and Late Entry Mode Features.
MT5 Version does not include RSI and MFI filter. **Please contact us after your purchase and we will send you the complimentary indicators to complete the system.**
This indicator does not send any signal without a reason...You can observe and analyze the indicator and the signals it sends Cycle Sni

MultiPairs MT5 is a fully automated Expert Advisor. This expert advisor is based on Multi-currency strategy . This system analyzes the market volatility to find trading signals based on trend reversal strategies and is used to evaluate oversold and overbought market conditions. Swing trading is a short-medium speculation based on the buying-selling force in the trading market with an advantage and low risk with a trend reversal pattern. The Expert Advisor does not use martingale, grids, hedg

这个指标采用经典的MACD和Zigzag结合用于检测价格和指标的背离,并采用先进的人工智能技术检测背离的有效性。MACD是指标之王,Zigzag也是非常有用的指标,这个指标把两个指标结合起来,发挥两个指标的优势。检测背离存在概率的问题,通常背离了又背离,所有我们试图通过先进的人工智能技术判断背离的有效性,过滤掉无效的背离,然后通过多种方式提醒用户。 促销价:59$ 功能 1.MACD形式的Zigzag指标 2.检测价格和MACD指标背离 3.通过AI技术检测背离的有效性 4.背离信号预警提醒 5.背离信号手机提醒 6.背离信号邮件提醒 7.使用于多个周期 8.使用 强大的ONNX( Open Neural Network Exchange )模型格式
使用 底背离: 单MACD在下面交叉时,指标会检测出是否底背离,画出向上的箭头,并提醒
顶背离: 单MACD在上面交叉时,指标会检测出是否顶背离,画出向下的箭头,并提醒
输入参数 Fast EMA period = 12; Slow EMA period = 26;

A personal implementation of a famous trend principle known as higher high, higher close, lower low, lower close (HHHC - HHHL). It uses price action alone to determine trend direction, trend changes and pullback zones. [ Installation Guide | Update Guide | Troubleshooting | FAQ | All Products ] Customizable breakout period Customizable colors and sizes It is non-repainting and non-backpainting It implements alerts of all kinds The indicator defines three price zones: Buy zones are blue Sell zon
FREE

Market Structure Shift with FVG Indicator for MT5 This MT5 indicator from the apexfintech.net suite identifies market structure shifts and fair value gaps (FVGs) to provide traders with potential trading opportunities. It alerts users on these events via mobile notifications, enabling them to react quickly to changing market conditions. Key Features: Market Structure Shift Detection: Identifies bullish and bearish market structure shifts based on swing high/low breaks and significant candl
FREE

Description This is a Utility tool for MT5 which will make our chart analysis task quite more efficient and save large amount of time. As for chart analysis, some are watching out several symbol simultaneously with single timeframe and others are trading only one single pair with multi timeframe analysis. For both, a common troublesome issue is “scroll chart to look back” or “draw chart objects” in multi charts at the same time. Especially for those who are trading with multi timeframe soluti

该工具直接在图表上显示经济新闻。它会显示即将发生的事件、事件发生时间、事件的重要性,并发送通知。
适用对象:
关注经济新闻的交易者
根据新闻进行交易的交易者
希望及时接收提醒的交易者
需要在图表上直接使用简洁直观日历的用户
主要功能
新闻面板 - 在图表上显示最近的经济事件
货币筛选器 - 仅显示您交易品种的货币新闻
提醒 - 在新闻发布前指定时间发出通知
推送通知 - 向您的 MetaTrader 移动设备发送通知
声音提醒 - 可自定义声音提醒
颜色指示器 - 以视觉方式指示重要性和紧急程度
设置 提醒时间 - 事件发生前多少分钟发送提醒
最低重要性 - 提醒的最低新闻重要性
按货币筛选 - 按当前交易品种的货币筛选新闻
启用声音提醒 - 启用声音提醒通知
启用推送提醒 - 启用推送通知到您的手机
启用额外 1 分钟提醒 - 在事件发生前 1 分钟发送额外提醒
使用方法使用方法
在图表上安装该实用程序
在属性窗口中配置设置
面板将显示在左上角
事件发生前指定时间将发送警报
FREE

My Money Manager like a risk controller, which places your trades with the exact volume that meets your desired stop loss risk percentage. It can also help you to preview your EP/SL/TP levels before placing an order by dragging these levels directly on a chart, and keep reporting about them during the position opening. With this tool, you will feel more comfortable when deciding to open orders, as well as forecasting your profit/loss with your orders. Placing orders is a very precise and profess
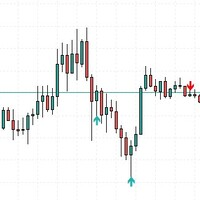
This indicator was creating a perfect structure to not re-paint or recalculate, all signals are accurate. I can create a robotic version of this indicator but I need more precision in the signals. So appreciate this work.
Tips to use when trading, do not buy at the top or sell at the bottom, always buy at the bottom and sell at the top. Risk 1 to 3.
In the settings you can adjust the size of the shadow or trail of the candle, you can change the colors and sizes of the arrows.
FREE

2025 Spike Killer Dashboard - Advanced Trading Signals & Market Analytics Transform Your Trading with Intelligent Market Insights! The 2025 Spike Killer Dashboard is a powerful MQL5 indicator that combines cutting-edge signal generation with an intuitive crystal dashboard for real-time market analysis. Designed for traders who demand precision and clarity, this all-in-one tool delivers actionable signals and comprehensive market metrics at a glance. Key Features: Dual Signal System Shved S

Visit our all-new Stein Investments Welcome Page to get the latest information, updates and trading strategies. Do you want to become a constantly profitable 5-star forex trader? Then get our Stein Investments trading tools and send us a screenshot to get your personal invitation to our exclusive trading chat with 500+ members.
Crosshair is a fantastic tool that simplifies our chart analysis by bringing the price candles perfectly in line with the indicator values in the subwindows.
Yo

描述 :
我们很高兴推出基于外汇市场 (PSAR) 中专业和流行指标之一的新免费指标 该指标是对原始抛物线 SAR 指标的新修改,在专业 SAR 指标中,您可以看到点和价格图表之间的交叉,这交叉不是信号,而是谈论运动结束的可能性,您可以从新的蓝点开始买入,并在第一个蓝点之前设置止损,最后您可以在点交叉价格图表时退出。
如何打开买入或卖出信号? 通过第一个蓝点打开买入交易并通过第一个红点打开卖出交易
正确的止损在哪里? 安全止损可以在第一个点上,(在第一个蓝点的买入情况下和在第一个红点的卖出情况下)
正确的止盈在哪里? 止盈可以根据止损距离和RR进行调整,所以我的建议是2 RR,是止损的2倍
如果我们盈利但仍未达到 tp,那么退出点在哪里? 第一个退出警报可以在点和价格图表之间交叉。
该指标何时释放警报? 一旦新的点出现在新的方向,指标就会释放警报
我们如何根据这个指标构建 EA 以及它的成本是多少?
我们已准备好通过一些强大的完整功能基于此免费指标构建指标,例如基于点的追踪止损和基于权益百分比的资金管理,您可以通过填写下表来订购
https://www.mql
FREE

EA描述: USDJPY & EURUSD Trading Buddy EA MT5 BOT 版本: 1.03 交易品种: USDJPY, EURUSD 平台: MetaTrader 5 (MT5) EA类型: 趋势跟随,移动平均线交叉系统 概述 USDJPY & EURUSD Trading Buddy EA MT5 BOT 是一个全自动的智能交易顾问,专为在 MetaTrader 5 平台上交易 USDJPY 和 EURUSD 货币对而设计。该EA采用三重移动平均线交叉策略来识别趋势方向并执行交易。它内置风险管理功能,包括止损、移动止损、交易冷却时间,以及详细的图表面板,帮助用户实时了解交易情况。 入场逻辑 EA基于三条简单移动平均线 (SMA): 短期均线(快)– 默认周期: 5 中期均线(中)– 默认周期: 10 长期均线(慢)– 默认周期: 50 买入条件 当满足以下条件时触发买入: 短期均线 > 中期均线 中期均线 > 长期均线 上一笔交易不是买单 卖出条件 当满足以下条件时触发卖出: 短期均线 < 中期均线 中期均线 < 长期均线 上一笔交易不是卖单 EA仅在没有持仓并且

The "Visa + Doji Strategy EA" is a concept in automated trading that combines the principles of Visa and Doji candlestick patterns in its algorithm. Here's a detailed description: Visa Component**: This part of the strategy utilizes an analogy to the Visa payment system, symbolizing fast, reliable, and global transactions. In trading terms, it represents swift entry and exit points in the market, identifying opportunities with high potential and minimal delay. The Visa component may use indicat
FREE

Mahdad Candle Timer 是一款轻量级且精确的 MetaTrader 5 指标,它会在最新一根K线旁边显示当前K线的剩余时间。该工具专为依赖精准时机的交易者设计——无论是剥头皮、日内交易,还是等待K线确认的波段交易。 主要功能 精准倒计时 – 以 HH:MM:SS 显示剩余时间(可选毫秒) 动态定位 – 始终与最新K线对齐,不受图表缩放或比例影响 智能颜色适配 – 文本颜色会根据背景和K线方向(看涨/看跌)自动调整 自定义提醒 – 在K线收盘前X秒发出声音或弹窗提醒 完全可定制 – 字体、大小、颜色、刷新速度和提醒参数均可调整 轻量高效 – 占用极低CPU资源,不影响其他指标或EA运行 ️ 输入参数 ShowMilliseconds (true/false) Update Interval (ms) Bullish/Bearish Colors (Light/Dark) Font & Size Enable Alarm (true/false) Alert Seconds Before Close Alert Sound File 使用场景 剥头皮交易者
FREE

Santa Trend Indicator is an efficient way to forecast and detect the trend in any market. Advantages Generates instant buy and sell signals. Provides an alternate exit strategy to your existing trading system. Never repaints, never backpaints, never recalculates. Works in all symbols and all timeframes. Perfect trend filter for any strategy or expert advisor. Fully compatible with Expert Advisor (EA) development. Does not lag.
FREE

Support Resistance Indicator The "Support Resistance" indicator is a versatile tool designed to help traders identify key support and resistance levels based on an underlying algorithm. These levels indicate price points where an asset historically experiences buying (support) or selling (resistance) pressure. The indicator allows traders to visualize these levels on their charts, making it easier to make informed decisions. All Products | Contact PARAMETERS: Timeframe :
Users can select the
FREE

欢迎使用 KMeans Price Zones Detector,这是一款创新的 MetaTrader 指标,利用机器学习的强大功能来识别关键的价格区间。该工具使用 KMeans 聚类算法动态检测价格数据中的中心点,突出显示价格更可能遇到支撑、阻力或整合的区域。 创新的 KMeans 算法 KMeans Price Zones Detector 之所以出众,是因为它先进地使用了 KMeans 聚类算法,这是一种在模式识别中以其效率和准确性而著称的机器学习技术。通过分析历史价格数据,指标识别代表显著价格水平的集群或中心点。然后利用这些中心点计算支撑和阻力区,为交易者提供关于潜在价格反转、突破和整合的重要信息。 主要特点 动态区域检测: 指标根据最新的市场数据不断更新价格区域,确保交易者始终掌握最相关的信息。 适用于所有时间框架: 无论您是在 1 分钟图表上进行短线交易还是在日线图表上进行长期投资,KMeans Price Zones Detector 都能无缝适应,提供准确的区域检测。 兼容所有外汇对: 该指标设计用于任何外汇对,为交易多种货币的交易者提供了灵活性和多功能性。 全面的 A
FREE

交易面板 版本:1.00 该交易面板是一款基于图表的手动交易界面,旨在为交易者提供快速、精准的交易执行和持仓管理功能。无需使用 MetaTrader 的标准下单窗口,即可实现一键交易和灵活的风险控制。 交易执行 BUY 按钮
使用当前选择的手数在当前交易品种上立即开立买入(多头)订单。
止损和(可选)止盈将根据面板当前设置自动应用。 SELL 按钮
使用当前选择的手数在当前交易品种上立即开立卖出(空头)订单,并应用止损和(可选)止盈。 CLOSE 按钮
立即关闭当前交易品种的所有未平仓订单。 止损管理 SL + / SL −
增加或减少止损点数。 止损显示
当前止损点数实时显示在面板上。 APPLY 功能
将当前止损设置应用到该交易品种的所有未平仓订单。 止盈管理 TP + / TP −
调整止盈点数。 TP ON / TP OFF 开关
启用或禁用止盈功能: 启用时,止盈将应用于新订单及订单修改 禁用时,订单将不设置止盈 止盈显示
当前止盈点数实时显示在面板上。 追踪止损(Trailing Stop) TRAIL ON / TRAIL OFF
启用或关闭追踪止损功
FREE

AutoGrid Assistant - 自动网格订单放置工具 网格交易策略交易者的免费助手! 功能说明: AutoGrid Assistant 一次执行即可自动放置挂单网格(Buy Stop/Sell Stop 或 Buy Limit/Sell Limit)。无需手动点击! 主要特点: 一键自动网格放置 支持止损单和限价单 灵活的网格设置(初始距离、订单间距) 每个订单的独立止盈和止损 方向选择:双向、仅买入或仅卖出 智能经纪商验证(检查最小距离、手数大小、保证金) 即时执行 适用于: 网格交易策略 对冲策略 平均成本策略 快速手动网格设置 设置参数: Number of orders per direction: 每个方向的订单数量(1-100) Lot Size: 每个订单的交易量 First order distance: 第一个订单的距离(点数) Step between orders (points): 后续订单之间的距离(点数) Use Stop Orders: true = 止损单,false = 限价单 Take Profit: 止盈点数(0 = 无止盈) Stop
FREE

UT Bot Alerts is a technical indicator for MetaTrader 5 that highlights potential directional changes based on momentum conditions.
The indicator marks signal points directly on the chart and can generate optional notifications for convenience. The signal generation logic can operate in two modes: Closed-bar mode: signals are confirmed only after the bar closes. Live-bar mode: signals are displayed during the formation of the current bar. Both modes are available depending on the user's preferr

"介绍NakaTrend:您在MetaTrader 5中的终极趋势检测器!
准备彻底改变您的交易体验了吗?来看看NakaTrend,您在精确和轻松识别趋势变化方面的首选指标。
有了NakaTrend,您将不会错过任何利用市场变化的机会。当出现看涨趋势时,NakaTrend会用绿色美元符号来表示,提示您进入买单。当趋势转为看跌时,会出现红色美元符号,表明这是放空的完美时机。
但这还不是全部- NakaTrend赋予您掌控交易的能力,允许手动下单。您的直觉与NakaTrend的见解相结合,将带领您取得有利的结果。
那些依赖猜测或过时指标的日子已经一去不复返了。NakaTrend利用先进的算法为您提供清晰、可操作的信号,您可以信任。
由于NakaTrend直接在MetaTrader 5中运行,将其集成到您的交易例程中是顺畅且无需麻烦的。只需安装NakaTrend,您将立即获得其强大的功能和功能。
但请记住,成功的交易不仅仅是进入交易-还包括知道何时退出。NakaTrend将这一决定留给您,让您可以根据自己的风险偏好和市场情况管理交易。
为了充分利用NakaTrend,请确保您
FREE
VWAP Indicator, the short form of Volume Weighted Average Price, is similar to a moving average but takes into consideration the tick volume of the candles. The indicator calculates the moving average multiplying the price of each candle for the tick volume in the candle. Said calculation weighs with more significance price where more transactions were made.
Features: Visual styling customizable Period customizable Ease of use
FREE

Ea交易基于超买区域随机指标的信号-我们卖出,在超卖区域-我们买入。 Mt4版本 https://www.mql5.com/ru/market/product/62952 监测顾问的工作 МТ4 https://www.mql5.com/ru/signals/1178019 МТ5 https://www.mql5.com/ru/signals/1178043 如果智能交易系统在VPS上的5/24模式下使用,我建议在保守模式下使用此智能交易系统,使用参数限制网格中的订单数量 " Count_Orders_Max_Grid " . 添加好友,发送你有趣的策略。 也许在讨论了所有的细微差别之后,我会免费写一个顾问 . "_Cof_Profit " - 这是这个Ea交易中一个非常重要的参数。 它设置了在网格中乘以多少获利,而不是经典的平均。 对于每个值,您需要选择自己的!!!!
Ea交易参数: 主要 : "_Slippage" - 滑点; "_ Magic" - 订单编号;
FREE

AutoClose MT5 - Your 24/7 Automatic Capital Guardian Stop the bleeding. Lock in profits. Trade with peace of mind. LIMITED LAUNCH OFFER - PRICE INCREASING NOW! Launch Pricing Strategy (Price updates daily in this description) First 5 Buyers: FREE - 100% OFF! Next 10 Buyers (Sales 6-15): $30 USD - 66% OFF final price! Next 10 Buyers (Sales 16-25): $50 USD - 44% OFF final price! Next 10 Buyers (Sales 26-35): $70 USD - 22% OFF final price! Final Price (Sales 36+): $89 USD ️ Price
FREE

MSX AI Scalper Pro Smart • Adaptive • Autonomous Trading Engine Overview MSX AI Scalper Pro is an advanced automated trading system built for BTCUSD on M5 timeframe .
Unlike many robots that depend on strict time filters, news blocks or manual control, this system is designed to trade continuously 24/7 , adapting to market volatility in real time — without external filters or manual babysitting. Working Principle (Short Theory) The EA combines: Smoothed HMA trend direction – to detect cle

An automated trading system with smart entry/exit algorithms that uses grid and martingale techniques to maximize profits. You can search for current signals on this page, or write me a personal message: https://www.mql5.com/en/signals/author/test-standart The default settings ( M1 timeframe ) are suitable for currency pairs, especially for pairs with GBP. All new sets appear here: https://www.mql5.com/en/blogs/post/747929 A description of the Expert's parameters can be found in the comment th

Hello algo traders. The Expert Advisor trades on gold (XAUUSD), any timeframe (the same on any TF), the initial account balance is from $100.
The following presets are available "GS SL dynamic 001for100" . Each position has several closing logics, including a hidden StopLoss, which is calculated individually for each position, based on the volatility of the last hours. (If you have special stop requirements, then you can set your SL and TP in points via the parameters: "TakeProfit_Safety" and
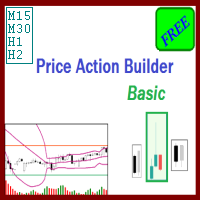
The Price Action Builder Basic expert advisor was created with the primary goal of providing a free, configurable, easy to use, decently profitable automated trading strategy. At the same time, an equally important goal is ensuring a low drawdown and avoiding exposure to high risks through:
usage of automatically placed stop loss orders for all launched trades; allowing maximum 1 managed open trade at a given time, avoiding pressure on margin/deposit load; minimization of positions holding tim
FREE

News Scalper EA is an Expert Advisor for trading EURUSD - GBPUSD - XAUUSD pairs, positioning your positions during the news. Developed by an experienced trader with over 17 years of trading experience. News Scalper EA uses a news calendar from MQL5 and trades according to them. With sophisticated strategy and risk management, the EA protects your positions from larger losses! News Scalper EA lets you close the SL after the set time (1 minute, planned) when the position is in minus, which proves
FREE
该新闻助手旨在从主要发布源获取交易者所需的经济事件,这些发布源基于终端的市场观察,通过各种简单的过滤器实时发布新闻。
外汇交易者利用宏观经济指标就买卖货币做出明智的决定。例如,如果交易者认为美国经济增长速度将超过日本经济,他们可能会买入美元并卖出日元。
本产品特点: 根据经纪商的市场观察显示项目 数值一经发布 从活动发布者的主要来源接收信息 发布事件值时发出警告 轻松过滤的可能性 显示最近的事件 在事件值发布前 X 分钟发出警报 有用的事件描述 显示事件的当前值和预测以及重要性 简单易用的图形用户界面 明暗主题 能够最小化和移动面板 简易安装 您可以使用这一基本工具结合专业的信号指标来分析趋势。 再赠送一件 产品。
根据经纪商的市场观察显示项目: 该软件根据您经纪商的市场观察终端时间显示过滤后的事件,因此 您无需 转换或计算事件的 时间间隔 ,并且可以轻松计算它们的发布时间。 发布事件的主要来源发布新闻后立即显示值: TW Calendar 使用事件发布者的 主要来源 来接收事件,因此该产品能够显示一些其他信誉良好的外汇日历提供商网站上未显示的事件。 数值一发布就报警并显示:
FREE

Name: Trailing Stop EA Version: 1.1 Author: D. Petru Description: This Expert Advisor (EA) for MetaTrader 5 implements a trailing stop functionality. The EA monitors all open positions and, if the price moves in favor of the position by more than the set TrailingStop value, then the EA will move the stop loss to a distance of TrailingStop from the current price. Key Features: Trailing Stop : The user can set the trailing stop distance in points. When the price moves in favor of the
FREE

This is a simple RSI indicator, but unlike the original one, it sends alerts when volume falls below the upper level or rises above the lower level, so you never miss a trading opportunity. Combined with support and resistance levels, it can provide strong entry opportunities into the market. I recommend keeping the levels as they are, i.e. 75 above and 25 below Check out my signal " PipStorm Invest ", save it to your favorites and come back from time to time to check it again :)
FREE

TimeBar TimeBar 是一個簡單的資訊指示器,顯示柱關閉之前的剩餘時間,以及柱打開以來經過的時間和當前時間。 為了便於感知,增加了兩種顯示方式:以圖形左上角註釋的形式,或以圖形物件的形式。
優點 字體選擇 字體大小。 您可以設定任何一項。 評論的時候太小了 您可以移動物體。 雙擊滑鼠可以選擇任何時間並移動到圖表上的任何位置,它將照常繼續更新 視覺警報。 您可以設定指定的秒數,直到目前柱關閉,達到該時間後,時間將變成設定中指定的警告顏色 設定 選擇顯示的時間 每次的顏色(對於圖形物件) 一則警報,通知您酒吧即將關閉 使用 TimeBar 指標作為您交易系統的補充
使用連結嘗試我在市場上的其他產品 https://www.mql5.com/ru/users/capitalplus/seller
FREE

CRYSTAL AI PRO v7.21 — MT5 智能交易系统(EA) 概述
适用于 XAUUSD(黄金) 与主要外汇品种的自动交易系统;管理入场、SL/TP、跟踪止损与回撤控制,遵循规则执行。不承诺盈利;请阅读风险提示。 运行要求 平台:MetaTrader 5 账户类型:ECN/RAW 推荐 连接:24/7 运行(建议 VPS) 周期:M1–H4 初始设置 启用 Algo Trading 。 将 EA 挂到图表(每个品种单独图表)。 在 Inputs 中设置 AI_Access_Mode = ON ,然后重新加载 EA。 根据资金/杠杆/经纪商条件调整风险参数。 建议条件 充足保证金与稳定执行(低点差/低延迟)。 黄金建议起始资金 $5,000+ (1:500);多品种交易时降低风险。 先在模拟或 cent 账户验证。 核心功能 规则化入场与 SL/TP 、 保本 、 跟踪止损 。 回撤控制 :在劣势阶段降低交易频率。 多品种支持(每品种一张图表)。 适配不同波动与交易时段。 在模拟/cent 账户可完整评估逻辑。 Inputs(要点) AI_Access_Mode 开启完
TW Volume Signal Pro MT5 利用先进的人工智能技术和专有智能算法,让您在黄金市场中交易更有信心,带来独特且无与伦比的交易体验。
您是否正在寻找高精度和卓越的黄金市场交易信号?
通过 TW Volume Signal Pro MT5,您可以成为专业交易者,并在黄金市场取得巨大成功。立即免费试用!
TW Volume Signal Pro MT5 的主要特点: 精准信号,固定止盈和止损 快速识别市场趋势变化 实时进出场提醒 三重利润目标的风险管理 安全区域自动止损 完全可调和自定义 在图表旁显示信号历史 在黄金和外汇市场表现出色 适合剥头皮交易者(M5 和 M15) 可在策略测试器中测试
为何选择此产品?
高准确性:精确且固定的信号 易用性:简洁友好的界面 灵活性:可自定义设置,兼容您的个人策略 可测试性:可以回测并精确计算盈利 购买此产品可获得价值 $37 的赠品。 要了解如何设置该产品,请阅读此文章。
https://www.mql5.com/en/blogs/post/759779 我们的客服团队随时为您解答!
The Absorption & Exhaustion Detector Professional indicator is a sophisticated volume analysis tool designed to identify critical market turning points by analyzing the relationship between price movement and cumulative volume delta (CVD). This indicator helps traders spot when price movements lack volume confirmation, indicating potential absorption or exhaustion zones. KEY FEATURES Real-time Cumulative Volume Delta (CVD) calculation and normalization Price-volume divergence gap measurement dis

Shadow Mark Scanner Your Edge in Candle Range Theory – Automate Advanced Price Action Setups Introduction - Make sure you know those strategies and backtested them before using this scanner - Use at your own risk Shadow Mark Scanner is a cutting-edge MetaTrader 5 indicator that automatically identifies advanced price action setups using candle range theory . This powerful scanner detects high-probability patterns like Previous Candle Range (PCR) breakouts and Engulfing Sweeping Candles (also kn
FREE

It's no secret. One of the best edges in trading is the mean-reversion strategy on US indices. Don't believe me? Do just a little research. Hence, having an EA that does this is very much a must-have in any portfolio. I made this for myself, but I am also offering it to anyone who needs it as well at a fair price. The process of making it was using RSI and using a point for buying and closing. I then used machine learning to test 100,000s of variables to get to this configuration. How does it
FREE
您知道为什么MetaTrader市场是出售交易策略和技术指标的最佳场所吗?不需要广告或软件保护,没有支付的麻烦。一切都在MetaTrader市场提供。
您错过了交易机会:
- 免费交易应用程序
- 8,000+信号可供复制
- 探索金融市场的经济新闻
注册
登录