适用于MetaTrader 5的EA交易和指标 - 11
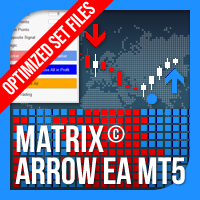
Matrix Arrow EA MT5 是一款独特的智能交易系统,可以通过图表上的交易面板手动或 100% 自动交易 Matrix Arrow Indicator 的 MT5 信号。 Matrix Arrow Indicator MT5 将在其早期阶段确定当前趋势,从多达 10 个标准指标中收集信息和数据,它们是:平均定向运动指数 (ADX) , 商品渠道指数 (CCI) , 经典 Heiken Ashi 蜡烛 , 移动平均线 , 移动平均收敛散度 (MACD) , 相对活力指数 (RVI) , 相对强弱指数 (RSI) , 抛物线SAR , 随机振荡器 , 威廉姆斯的百分比范围 。 当所有指标给出有效的买入或卖出信号时,相应的箭头将打印在图表上,在下一个蜡烛/柱线的开盘时表示强劲的上升趋势/下降趋势。用户可以选择使用哪些指标,并可以单独调整每个指标的参数。使用 Matrix Arrow EA MT5 ,您可以直接从图表上的交易面板手动交易 Matrix Arrow Indicator MT5 信号,或使用 100% 算法交易选项 100% 自动交
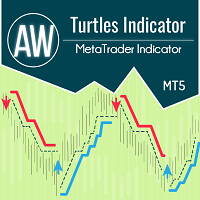
该指标根据海龟系统工作,通常假设时间间隔为 20 到 55 根蜡烛。在给定时间间隔内监视趋势。在突破支撑位或阻力位时进场。退出信号是价格突破同一时间区间趋势的相反方向。 优点:
工具:货币对、股票、商品、指数、加密货币 时间范围:经典 D1,也适用于任何时间范围 交易时间:全天候 资金管理策略:每笔交易风险不超过1% 使用追加订单时,每增加一个仓位的风险为0.25% MT4 indicator version -> HERE / AW Turtles EA MT5 -> HERE / More products -> HERE 参赛规则: 1)较短的条目: 入场条件是突破 20 日高点或低点。
如果先前的信号成功,则跳过交易。
笔记!如果之前的交易以盈利结束,我们会跳过入场。如果突然发现突破有利可图,那么稍后突破55日通道后我们就进场。 当价格突破该通道时,我们进入交易。 2)长期进场(如果由于上述原因错过了20日突破): 价格突破唐奇安通道的 55 天高点或低点。 笔记!在方法 2 中,不使用前一笔交易的过滤器,我们总是输入。 退出策略: 止损 1) 在经典版本中有
FREE

Custom Alerts AIO:多市场智能监控,一键启动,无需设置 概述
Custom Alerts AIO 是一款“开箱即用”的高级市场扫描工具,无需额外安装任何其他指标或进行复杂设置。它内置了 Stein Investments 的所有核心指标(FX Power、FX Volume、FX Dynamic、FX Levels 和 IX Power),可帮助您轻松监控所有主要资产类别,如外汇、黄金、指数和加密货币。如果您的经纪商支持股票,您也可以手动添加个股进行监控。 1. 为什么选择 Custom Alerts AIO? 无需额外购买任何指标
• 所有关键指标均已内置,开箱即用。
• 专注于实时预警,不包含任何图形元素,性能高效,界面简洁。 全面覆盖所有主要市场
• 支持监控外汇、金属、加密货币和指数市场。
• 无需手动输入任何交易品种,只需在设置中勾选资产类别即可启用。
• 股票并不属于默认类别,如有需要可手动通过参数输入添加。 高效、专业、便捷
• 无需图表模板和手动加载,适合自动化或远程交易环境。
• 非常适合 VPS 上长期运行,或作为后台市场预警工具使用。 2
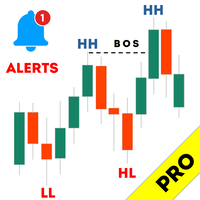
Haven Market Structure PRO - 您的专业市场分析师 隆重推出 Haven Market Structure PRO – 这不仅仅是一个指标,而是一个基于价格行为 (Price Action) 和智能资金 (Smart Money) 核心概念,用于自动化价格走势分析的完整系统。此 PRO 版本专为希望最大化控制图表并洞悉市场全貌的交易者而设计。 其他产品 -> 点击这里 理解市场结构是盈利交易的基石。该指标能自动识别最重要的结构元素,从而解放您的时间,让您能专注于做出深思熟虑的交易决策。 指标核心信号 BOS (Break of Structure / 结构突破) – 当价格突破前一个高点(在上升趋势中)或低点(在下降趋势中)时出现。这是 对当前趋势强度的确认 。 CHoCH (Change of Character / 特征改变) – 当价格朝相反方向突破结构时发生(例如,在上升趋势中突破最后一个低点)。这是 潜在趋势反转的第一个也是最重要的迹象 。 PRO 版本有哪些新增和独特之处? PRO 版本包含了将指标转变为综合交易系统的高级功能: 动

LIVE SIGNAL - https://www.mql5.com/en/signals/2339751
CrazyGOLD-M1 是一款专为 XAU/USD (黄金/美元)在 M1(1分钟)周期 上优化的专业智能交易顾问(Expert Advisor, EA)。 它的核心架构基于 ICT(Inner Circle Trader)交易理念,专注于流动性区域和摆动阻力,从而识别高概率的进场机会。 近年来黄金市场波动异常剧烈,许多交易者在人工操作时难以把握。CrazyGOLD-M1 提供了一套可靠的解决方案,通过系统化分析来捕捉聪明资金的动向,并精准确定进场点。 该 EA 并非每天都会开仓,它只在发现明确机会时执行交易,通常每 2–3 天 会进场一次,并可能在此期间开立多笔订单。 其算法为每笔交易应用固定的 止损(SL) 与 止盈(TP) 水平,确保风险管理的一致性。通过小止损与合理止盈的搭配,平均 风险回报比为 1:2 ,整体胜率超过 60% 。 更重要的是,CrazyGOLD-M1 不使用马丁格尔(Martingale)、网格(Grid)或对冲策略 ,让交易者能够始终安全可控
King Binary Profit System
1 minute candle
3-4 minute expire
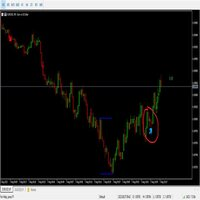
Alright. This indicator works on MT5 and is very easy to use. When you receive a signal from it, you wait for that candle with the signal to close and you enter your trade at the beginning of the next new candle. A red arrow means sell and a green arrow means buy. All arrows comes with a long dotted like for easy identification of trade signal. Are you okay with that?

THIS EA IS A SEMI-AUTO EA, IT NEEDS USER INPUT. Manual & Test Version Please DON'T BUY this product before TESTING and watching my video about it. The price of the ManHedger will increase to 250$ after 20 copies sold. Contact me for user support or bug reports or if you want the MT4 version! MT4 Version I do not guarantee any profits or financial success using this EA.
With this Expert Advisor, you can: Implement your own Zone Recovery strategy to capitalize on trending markets. Create Grid

Gold Sentry 具有风险上限网格的智能黄金交易 Gold Sentry 是专为 XAUUSD (黄金) 开发的全自动交易机器人。它利用专门设计的网格结构,无需人工干预即可运行。 策略概述 每日入场:EA 针对特定的市场窗口,识别高概率的突破机会。 网格管理:如果市场走势不利于初始交易,EA 将根据实时市场状况激活自适应网格系统来管理头寸。 风险控制:每一组交易都受硬止损 (Hard Stop Loss) 保护。这确保了每个序列的风险是确定的,避免了传统网格系统通常相关的无限回撤风险。 主要特点 硬止损:核心逻辑中内置了净值保护。 每日活跃:旨在每个交易日扫描入场机会。 黄金优化:入场逻辑和网格间距针对 XAUUSD 的波动性进行了调整。 建议 交易品种:XAUUSD (黄金) 时间周期:任意 (EA 使用内部逻辑) 建议余额:$850 (1:200 杠杆) 或 $1700 (1:100 杠杆)。 美分账户:最低 $10。 设置 设置配置文件:从内置配置文件中选择。 请运行回测以查看哪种配置文件最适合您的经纪商。 交易环境:调整 MagicNumber, Slippage 和 M

人工智慧量子交易——演算法交易的革命。新一代日圓交易顧問
1 次購買 = 2 個版本!
在 MT5 購買 AI Quantum Trading - 並免費獲得 MT4 版本! 隨心所欲地交易:兩個平台、一個顧問、零多付款。 購買後請透過 PM 寫信給我並領取您的禮物!
在當今的金融科技世界中,自動交易已成為市場成功不可或缺的一部分。 AI Quantum Trading 是一種創新的交易顧問,它使用人工智慧和機器學習來動態適應市場條件。這項強大的工具專為尋求最高效率和穩定資本成長的專業交易員和投資者而設計。
多功能性和適應性 在數位金融時代,自動化交易正在成為成功的關鍵因素。 AI Quantum Trading 是一家高科技交易顧問,利用人工智慧和機器學習來適應當前的市場狀況。它專門設計用於與 USDJPY、EURJPY 和 GBPJPY 貨幣對配合使用 - 這些是外匯市場上最不穩定和最受歡迎的工具。
針對日元交叉盤進行了最佳化 由於採用了專門的演算法,考慮到了這些工具的波動性特徵和行為模式,AI Quantum Trading 在日圓貨幣對上表現出了最佳結果。
卓越的

Killzone Liquidity Sweep EA Pro
by EV Trading Labs
This Expert Advisor is based on institutional concepts (Smart Money / ICT methodology) and focuses on identifying and executing high-probability setups during the London and New York killzones. The system combines directional bias, liquidity sweep confirmation, and precision stop entries aligned with institutional trading logic. The algorithm operates on the M15 timeframe and trades only when the market shows a clean directional structure con
FREE

EURO Binder EA is a fully automatic trading advisor which contains several trading systems mainly based on Stochastic, Moving Averages, Standard Deviation, Momentum, Envelopes, Bollinger Bands, Awesome Oscillator, Accelerator Oscillator, CCI, ATR, ADX, OSMA, MACD, RSI, WPR, Bulls Power, Bears Power, Support Resistance, and Candlestick Formations. Each trading system has it own entry with fixed stop loss and take profit. This forex robot can be used for all pairs and all time frames, but

Go Long EA实现了基于系统性日间交易原则的高级日内交易策略,具有多重技术确认。虽然许多交易者寻求复杂的算法,但该EA将简单而有效的概念与复杂的风险管理和多重技术过滤器相结合。
该EA每天在特定时间开仓,但仅在市场条件符合多个技术指标时才会执行。这种系统性方法有助于捕捉日内行情,同时避免过夜持仓成本侵蚀利润。EA会在预设时间自动平仓,这对想要避免过夜风险的交易者来说是理想之选。
该EA的特别之处在于其自适应风险管理系统。持仓规模根据多个因素自动调整: - 基础资金和风险百分比设置 - 技术指标条件(均线、RSI、MACD等) - 在条件特别有利时增加持仓规模的特殊乘数
该EA包含多个可启用/禁用的技术过滤器: - 移动平均线(MA)过滤器,带价格关系检查 - RSI超卖条件和乘数 - MACD趋势确认 - ATR波动率过滤器 - 布林带位置验证 - ADX趋势强度确认 - 动量确认 - 随机指标超卖条件 - 一目均衡表云图位置验证 - 摆动模式识别
<资金管理设置> 基础资金:风险计算的基础资金 风险百分比:每笔交易基础资金的风险百分比 获利百分比:止盈距离(0 = 禁
FREE

这里是西班牙语文本的中文翻译: 介绍 Blitz Gold Trader :这是一个执行黄金交易的前沿解决方案,具有无与伦比的速度和精度。由一支经验丰富的交易员和开发人员团队打造,这款高级交易机器人利用了一个强大的算法,结合了价格行动分析、趋势跟踪,并且可以通过多种指标进行自定义。它专为优化快速M5时间框架的交易而设计,能够抓住盈利机会,同时将风险降至最低。 Blitz Gold Trader 采用明确的、风险规避的策略:不使用网格交易、不使用马丁格尔策略,也不进行对冲。机器人严格只开设一个头寸,确保交易控制良好、专注。与依赖新闻过滤器的版本不同,此版本根据不同的点差进行调整,即使在市场波动期间也能连续交易。 开始使用 Blitz Gold Trader 非常简单。通过直观的设置,你只需调整手数,并选择机器人是否应全天24小时运行,或仅在特定日期和时间运行。该机器人兼容MetaTrader 5,适用于任何外汇经纪商或资金管理交易公司。 低DD – 当前版本的EA适用于一些资金管理公司的挑战,如Axi Select和Darwinex Zero。 如何开始
截图来源于使用RoboFore

PrecisionGold PRO:XAUUSD 算法交易的机构级方案 欢迎查阅 PrecisionGold PRO 文档,这是一款专为解决黄金市场固有波动问题而设计的交易系统。这不是一个“快速致富”的工具;它是为严肃的资本增长而设计的纪律执行算法。 零妥协的安全: 无网格 (No Grid)。无马丁格尔 (No Martingale)。无套利。 核心理念: “基于市场结构的狙击手入场”。 第 1 部分:“狙击手”逻辑解码 大多数黄金 EA 之所以失败,是因为它们试图猜测市场方向或通过加倍下注来挽回损失。PrecisionGold PRO 与众不同。它依赖于源代码中严格编写的**“三因素融合模型”**。 1. 宏观趋势过滤器 (H4 时间框架) 在寻找交易之前,EA 使用双指数移动平均线系统 (EMA 50 & EMA 200) 扫描更高的时间框架 (H4)。 看涨情景: 如果 价格 > EMA 50 > EMA 200,EA 进入“仅买入模式”。 看跌情景: 如果 价格 < EMA 50 < EMA 200,EA 进入“仅卖出模式”。 优势: 这防止了 EA 在顶部买

避免過度交易、FOMO和強迫性行為,通過使用EmoGuardian對你的交易帳戶施加高級風險限制。 自動為倉位添加 止損 , 管理 EA 損失 , 自動載入 / 卸載 EA 。 限制 每個頭寸、每筆交易、每個時間範圍、每天的風險。 風險管理選項旨在專門解決導致交易者爆倉的強迫行為。 注意 : 這是一個實用程式 , 因此它不適用於策略測試器。EmoGuardian 不適用於凈額結算帳戶 (大多數交易帳戶都是對沖帳戶) 完整、詳細的手冊,請訪問以下連結: https://www.mql5.com/en/blogs/post/753194 獨特功能: 自動將止損添加到賬戶餘額的百分比或點數的頭寸中 當達到風險限制時終止 EA,並在第二天自動重新載入它們 創建緊急信號以管理 在 VPS 伺服器上運行的 EA 每日限額 以帳戶貨幣設置最低/最高凈值水準 以貨幣價值或百分比設置每天的最大損失/最大收益 自訂一天的開始時間 持倉限額 限制每個倉位的最大開倉量 限制每日最大交易量 限制每天的交易數量 施加最大連續失敗者數 對每筆交易或每個交易品種施加最大未平倉風險 每個時間範圍的限制 最多可定義 3
Magic Grid MT5 is a non-indicator Expert Advisor using a grid strategy (on a hedging account). The strategy is based on automatic reopening of grid pending orders, after closing their market positions (by Take-Profit, Stop-Loss or manually). Pending orders are placed with a specified step from the initial prices, which can be entered manually or generated automatically (once at the beginning of the trade). The robot can trade on any timeframe, on any currency pair, on several currency pairs,

Momentum Chase is an intelligent trend continuation EA that waits for a strong candle close beyond EMA and then confirms momentum with price action relative to the previous bar. Equipped with reliable trailing stop mechanism and classic SL/TP protection. Clean, robust logic — perfect for swing and position trading.
EA Settings: Symbol: XAUUSD Time frame: H12 and above Settings: Default settings Brokers: Any Minimum deposit: $100/0.01 lot Features: - No martini, no net - Order is always protecte

Description (For MQL5 Website/Market)
Title: Subho SMC Concept & Trend Signals
Subtitle: All-in-one Smart Money Concepts (SMC) Dashboard with High Accuracy SUBHO Signals.
Description: The Subho SMC Concept & Trend Signals is a comprehensive professional trading system designed for MetaTrader 5. It automates advanced Smart Money Concepts (SMC) and combines them with the proprietary "SUBHO Signal System" to find high-probability trade setups. This indicator helps you identify the true market d

Dark Absolute Trend is an Indicator for intraday trading. This Indicator is based on Trend Following strategy but use also candlestick patterns and Volatility. We can enter in good price with this Indicator, in order to follow the main trend on the current instrument. It is advised to use low spread ECN brokers. This Indicator does Not repaint and N ot lag . Recommended timeframes are M5, M15 and H1. Recommended working pairs: All. I nstallation and Update Guide - Troubleshooting
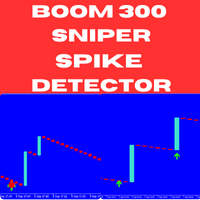
Introducing the Boom 300 Sniper Spike Detector – a powerful, non-repainting indicator specifically engineered to help you master spike trading in the Boom 300 market. Whether you're a seasoned trader or new to the game, this tool offers precise and timely signals, allowing you to catch spikes with confidence and improve your overall trading performance. Key Features: Non-Repainting Signals : Ensures consistent and accurate signals that do not repaint, providing you with reliable data to make con

GoldenTron X 是一款先进的人工智能波段交易机器人,能够追踪 XAUUSD(黄金)的趋势,并采用两种不同的交易策略来提升性能。多年的专注开发,造就了强大的交易算法。
我使用了一个高质量的数据集,时间跨度从2000年至今。人工智能系统在服务器上使用最新的机器学习技术进行训练,随后进行了强化学习。这个过程耗时数周,但结果令人印象深刻。训练周期涵盖2000年至2020年。2020年至今的数据为样本外数据。能够保持多年样本外数据的卓越性能实属罕见。这证明人工智能层能够毫无问题地适应新的市场环境,这一点至关重要。许多智能交易系统只是硬编码的、经过优化的定时炸弹,迟早会失效,而GoldenTron X能够适应新的市场环境。
GoldenTron X 始终使用预设的止损和止盈水平,并使用买入/卖出止损订单进行高回报率交易。只允许一个买入仓位和一个卖出仓位,以确保严格的风险管理。不使用追踪止损,从而减少滑点,提高利润和稳定性。避免使用危险的网格或马丁格尔策略。重要的是,我没有过度优化指标参数——许多设置都表现良好,这增强了我对其稳定性的信心。 如有任何疑问,请随时通过私信、电子邮件或 Mi

Grid-Trading Buy and Sell Options: You can set the system to place buy orders below the market price and sell orders above it. This ensures profits during price movements in either direction.
Adjustable Parameter: Maximum and Minimum Price Levels: Define the range within which the grid operates. Grid Distance: Set the spacing between each buy and sell order, allowing you to control the frequency of trades. Volume (Lot Sizes): Adjust the trading volume for each order to manage risk and potential
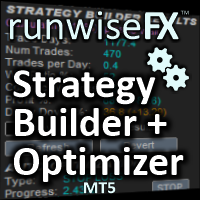
Strategy Builder offers an incredible amount of functionality. It combines a trade panel with configurable automation (covert indicators into an EA), real-time statistics (profit & draw down) plus automatic optimization of SL, TP/exit, trading hours, indicator inputs. Multiple indicators can be combined into an single alert/trade signal and can include custom indicators, even if just have ex4 file or purchased from Market. The system is easily configured via a CONFIG button and associated pop-u

Pips Chaser 指标的开发是为了补充你的手动交易。该指标可用于短线剥头皮和长线波段交易 // MT4 版本
特点 无重绘指标 当新数据到来时,该指标不会改变其数值 交易货币对 任何货币对 时间框架 H1是最好的,但你可以将其适应于任何时间框架 交易时间 全天候 Buffers Buy Buffer: 0 / Sell Buffer: 1
要求
使用一个ECN经纪商,并为一些头寸提供严格的点差是必须的。 不要在中等影响和高影响的新闻发布时间进行交易。
如何安装
将该指标附加到首选的交易对上(推荐H1)。
配置
指标设置 。 在这里你可以修改指标的参数以采用最适合你的策略。 附加设置 。 在这里你可以改变指标不同部分的颜色。你还可以改变警报的配置。
如何使用它
当你在图表中看到箱体突破的箭头时,你就必须进行买入或卖出交易。 当蜡烛触及趋势线时,你必须关闭交易。 当趋势线和狙击线在同一水平上相互接触时,这将是一个理想的利润水平。 当交易线远离对方时,在这种情况下,该交易将给你带来更多利润。而当交易线小于对方时,在这种情况下,该交易将给你带来较少的利润。 你必须在突破框
FREE

Sangkakala Merbabu is a very accurate expert advisor for AUDCAD. This EA is designed with many momentum indicator for entry points.
Signal Features : MFI Force Index De Marker WPR CCI RSI Stochastic Bollinger Bands
Additional Signal : Moving average PSAR MACD ADX
Recommendations:
Currency pair: AUDCAD Timeframe: M5 Minimum deposit currencies : $500 Account type: Standart, Raw or zero spread accounts IMPORTANT: It is very important to use LOW SPREAD accounts for best results !
This EA u

Dominion Levels: The "Market Structure" Architect
Perfect for XAUUSD (Gold)
The definitive tool for identifying "Hard" Support and Resistance levels that actually hold. Most traders draw support and resistance lines based on feelings or vague zones. The result? Messy charts, subjective decisions, and getting stopped out by "noise." Dominion Levels solves this by removing the subjectivity. It is not just another line drawer; it is a Stepped Structure Engine. It identifies significant pric

FXLAND Smart Reversal Indicator (MT5)
FXLAND Smart Reversal Indicator is a professional technical analysis tool designed to help traders identify potential price reversal zones and key market turning points with clarity and precision.
The best reversal indicator and price return by choosing only one ceiling or floor in each time frame
A masterpiece of combining mathematics and Gann, fractal matrix, Fibonacci, movement angle and time. Completely intelligent
Key Features
Detects potenti

Are you ready to dominate the volatile world of synthetic indices trading? The Golden Boom and Crash Spike Indicator is the revolutionary MT5 indicator designed exclusively for high-stakes traders targeting explosive spikes in Boom 300 and Crash 300 . Optimized for the M1 (one-minute) timeframe , this advanced tool leverages proprietary AI-driven spike detection and precise price action analysis to generate non-repainting buy/sell arrows with unparalleled accuracy. Whether you're s

Vineski HFT Gold Scalper MT5 主要特点 超高速市场分析
机器人具备强大的算法引擎,能够迅速分析和解读市场数据,实现实时交易决策,并快速响应市场变化。 自动执行交易
机器人可以根据预设策略和标准自动执行交易,减少人为情绪干扰,提高订单执行的准确性。 低延迟与高吞吐量
高频交易需要尽可能减少延迟(建议使用VPS),并确保快速的数据访问和订单执行。机器人针对低延迟和高吞吐量进行了优化。 高级风险管理
机器人能够自动调整交易手数,并根据预设参数设置止损,有效控制风险。 多任务并行处理
机器人可同时运行多个交易策略和工具,适应不同市场环境,提高交易灵活性。 实时监控与反馈
用户可以实时监控机器人的表现,并分析交易结果。反馈机制和统计数据有助于优化策略和算法。 兼容多种市场和交易工具
机器人适用于多个金融市场,并支持不同交易工具,提高交易适应性。 使用 Vineski HFT Gold Scalper MT5 可帮助交易者自动化交易操作,降低风险,并在高速市场环境中提高交易效率。 安全稳定,低回撤,持续盈利
机器人具备高度安全性,资金回撤低,长期表现稳

Crypto Ticks for MetaTrader 5 – 实时加密货币行情与订单簿集成 概述
Crypto Ticks 可将主要加密货币交易所的实时逐笔数据和订单簿深度直接传输至 MetaTrader 5。专为需要精准行情的高频交易者与算法策略开发者设计。 支持的交易所 Binance:现货(图表窗口订单簿深度)和期货(支持多品种订单簿) KuCoin:现货和期货(支持图表订单簿) Bybit:期货和反向期货 XT.com:现货和期货 主要功能 WebSocket 实时逐笔数据流 支持 Binance 数据流:@trade、@ticker、@bookTicker、@aggTrade 使用交易所 API 获取完整 OHLCV 历史数据 订单簿深度可视化(买一/卖一+深度) 自动重连机制确保稳定数据流 定时替换数据提高K线准确性 MT5 重启时自动补全历史数据 与 Strategy Tester 兼容(基于逐笔数据) 完全兼容 VPS,无需外部 DLL 附加信息
适合需要高精度数据的高频与算法交易者
适合策略开发与逐笔回测 重要提示
MT5 的 Strategy Tester

The indicator very accurately determines the levels of the possible end of the trend and profit fixing. The method of determining levels is based on the ideas of W.D.Gann, using an algorithm developed by his follower Kirill Borovsky. Extremely high reliability of reaching levels (according to K. Borovsky - 80-90%) Indispensable for any trading strategy – every trader needs to determine the exit point from the market! Precisely determines targets on any timeframes and any instruments (forex, met

这是我著名的剥头皮机Goldfinch EA的最新版本,它是十年前首次发布。它以短期内突然出现的波动性扩张为市场提供了头条:它假设并试图在突然的价格加速后利用价格变动的惯性。这个新版本已经过简化,使交易者可以轻松使用测试仪的优化功能来找到最佳交易参数。 [ 安装指南 | 更新指南 | 故障排除 | 常见问题 | 所有产品 ] 简单的输入参数可简化优化 可定制的贸易管理设置 交易时段选择
工作日选择 金钱管理
谨防... ick牛黄牛是危险的,因为许多因素都会破坏收益。可变的点差和滑点降低了交易的数学期望,经纪人的低报价密度可能导致幻像交易,止损位破坏了您获取利润的能力,并且网络滞后意味着重新报价。建议注意。
回溯测试 EA交易仅使用报价数据。请以“每笔交易”模式回测。 它根本不使用HLOC(高-低-开-关)数据 交易时间无关紧要 为了获得更好的性能,请为您希望在每个刻度线模式下交易的每个交易品种运行云优化。稍后分享!
输入参数
触发点:触发点差所需的价格变动。 (预设= 10)
最小时间窗口:价格波动发生的最短时间。 (默认= 3)
最长时间窗口:价格波动发生的最长时间。
FREE

The Best SMC for All indicator is designed for MetaTrader 5 (MT5) to implement Smart Money Concepts (SMC) for analyzing market structure and identifying key trading zones based on price action. It visualizes supply and demand zones, Break of Structure (BOS) levels, Points of Interest (POI), and optional ZigZag patterns to assist traders in making informed decisions. Below is a detailed description of its features:
---
Features
1. Swing High/Low Detection:
- Functionality: Automatically iden
FREE

Range Auto TP SL is for you, 100% free for now, download it and give me a good review and you are free to use it for lifetime !!!!
Range Auto TP SL is a EA to set Stop Loss and Take Profit level based on range using Average True Range (ATR). It works on both manually opened positions via PC MT5 Teriminals or MT5 Mobiles and EA/robots opened position. You can specify magic number for it to work on or it can work on all the positions. Many EA does not good Stop Loss and Take Profit function and
FREE

[ 我的频道 ] , [ 我的产品 ]
该指标显示在总体趋势向上或向下移动时,由于瞬时压力导致K线趋势发生变化的点。 当上一根K线满足某些条件时,指标会绘制箭头。 在制定策略时,您可以将连续出现的3-4个箭头解读为潜在的突破信号。 例如,当您看到第4个箭头时,可以考虑开仓交易。 这是一个可靠的工具,可以帮助您预测重要的市场走势并优化交易决策。 简而言之,该指标基于K线形态生成信号: K线为看跌,但上影线超过前一根K线。 K线为看涨,但下影线低于前一根K线。 强信号,
您可以识别信号是否强烈。 在进场交易之前在“Data Window”中检查这一点将提高您的胜率。 当您将此指标与 VolumeHedger EA 一起使用时,您可能会获得非常好的结果,甚至可以使用胜率高达100%的set文件。
FREE

Gold Codex EA is an automated trading robot that uses complex algorithm mainly based on various default indicators, Support Resistance, and Candlestick Formations. This expert advisor works on all timeframes and all pairs, but it is recommended to use on GOLD H1 timeframe.
Setting Parameters: Expert Name - Expert Advisor name and trades comment. Magic Number - EA identification number. Trade Direction - Buy, Sell or Both. Aggressive Mode - If true, EA trades more often. Multipl

Sling Shot FX Pro – Precision. Protection. Performance.
This is an introductory offer at a heavily reduced price. The price will increase soon, as the product achieves its early adoption goals. Secure your license now to benefit from the lowest price and all future updates! Step into the world of professional algorithmic trading with Sling Shot FX Pro – an advanced Expert Advisor built for traders who demand consistency, control, and cutting-edge automation. This system is powered by a propriet

XAUUD Gold Scalper AI — Vision v2.01 Professional SMC Automation for XAUUSD (Gold) | M5 Command Center Precision Engineering. Institutional Logic. Multi-Timeframe Execution. XAUUD Gold Scalper AI is a precision-engineered trading engine built specifically for the Gold (XAUUSD) market. It utilizes a sophisticated Multi-Timeframe Vision Engine that anchors its analysis on the 5-Minute (M5) chart while executing with 1-Minute (M1) precision. By combining Smart Money Concepts (SMC) with rigorous

About Ephra Bot Ephra Bot is a next-generation MQL5 Expert Advisor engineered to provide a smarter, more adaptive, and consistent approach to automated trading.
Developed through years of research and algorithmic refinement, it combines precision trade execution with dynamic risk management to deliver steady, dependable results across changing market conditions. For Live Signals: CLICK HERE?
Core Logic Ephra Bot employs a multi-position management system , intelligently dividing each ma

MetaTrader 5自定义指标的全球交易顾问。
战略的建设者 MetaTrader4 的 版本 : MetaTrader 4终端 的xCustomEA 版本 通用交易顾问的功能xCustomEA完全复制了我们的顾问 The X 所有参数,除了一个: xCustomEA 适用于自定义指标,能够为MT5终端编制自己的交易策略。 xCustomEA 具有指向可从Internet或mql5市场下载的自定义指标的链接。 我们的新顾问 xCustomEA 基于顾问 The X-Universal EA 您可以 编写 自定义指标 ,我们的顾问 xCustomEA 将打开信号位置。 通过购买我们的Universal Trade Adviser xCustomEA ,您可以每天为指标编程顾问! 关于指标PIPFINITE TREND PRO的专家顾问的示例 关于指标的顾问和编程策略的完整说明 Description on English 基本设置:
您可以为以下各项指示和信号编程: 打开 , 关闭 , 过滤器 , 止损 , 获

The Keltner Grid Scalper MT5 EA is an automated trading system for MetaTrader 5 platforms. It uses the Keltner Channel indicator for entry signals in a grid-based strategy. This EA generates trades based on Keltner Channel crossovers and manages them through baskets. We designed it for forex pairs on timeframes from M5 to H1 but you can test and optimize on any other. The system organizes trades into baskets, with options for lot sizing, breakeven adjustments, and trailing stops. It includes da
FREE

Short Description:
An advanced reversal trading system that detects market turning points using Liquidity Momentum combined with Price Action confirmation. Overview:
The Accurate Liquidity Pivot Signals indicator is designed to identify high-probability Buy and Sell setups. Instead of relying on lagging moving averages, this tool analyzes the internal Liquidity Flow of the market to find hidden support (Demand) and resistance (Supply) zones. It uses a unique Pivot detection algorit

RSI divergence indicator finds divergences between price chart and RSI indicator and informs you with alerts (popup, mobile notification or email). Its main use is to find trend reversals in the chart. Always use the divergence indicators with other technical assets like support resistance zones, candlestick patterns and price action to have a higher possibility to find trend reversals. Three confirmation type for RSI divergences: RSI line cross 50 level Price returns to previous H/L C
FREE

The "Power of Three" (PO3) is a concept developed by the Inner Circle Trader (ICT) to illustrate a three-stage approach used by smart money in the markets: Accumulation, Manipulation, and Distribution . ICT traders view this as a foundational pattern that can explain the formation of any candle on a price chart. In simple terms, this concept is effective for any time frame, as long as there's a defined start, highest point, lowest point, and end. MT4 - https://www.mql5.com/en/market/product/1
FREE

Welcome to TradeX Chart Trading Netting and Hedge accounts. Functionalities SHIFT to buy; CTRL to sell; Breakeven; Visual flag of pending orders on the chart; Blocking the BUY/EJECT/SELL buttons to prevent accidental sending of orders; Spread visualization when clicking on the asset being traded; Candlestick countdown; List of open positions; Percentage balance of all transactions for the current day. Warning It does not work in Strategy Tester. Updates and improvements coming soon!
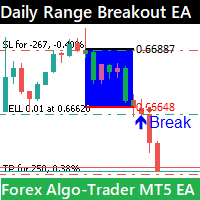
The Daily Range Breakout MT5 EA is a fully automated trading solution designed to identify and trade breakouts from the daily price range. It simplifies breakout trading with precise detection, customizable settings, and effective risk management options. Ideal for traders looking to capture market momentum, this EA helps identify high-probability breakout opportunities with minimal effort.
How It Works Each day, the EA identifies the high and low price range based on a user-defined time windo
FREE

自动设置、止损、止盈、追踪止损、盈亏平衡水平,实现 虚拟 止损和止盈。
经验助理 将帮助您组织职位维护。 该程序(EA 交易)旨在自动设置 真实或虚拟 交易时您的仓位的 止损和止盈 水平。 您可以从图表上的控制面板轻松管理 EA 交易的所有操作。 如果您在为未平仓头寸设置止损、止盈、 追踪止损 或 盈亏平衡 时遇到任何困难 ,或者如果您更喜欢手动交易,您可以使用助手。 它将自动执行必要的操作,例如为您的交易设置止损和获利、打开追踪止损以及在需要时将止损移至盈亏平衡。 该助手还具有基于 抛物线 Sar 指标的追踪止损功能。 MT4 版本
详细描述 +DEMO +PDF 如何购买
如何安装
如何获取日志文件 如何测试和优化 Expforex 的所有产品 我们的助手的9个主要功能:
打开买入卖出; 止损/止盈集; 设置追踪止损; 一套收支平衡; 抛物线追踪止损; 虚拟止损和止盈; 虚拟栏杆止损和盈亏平衡; 显示当前柱的结束时间; 显示有关帐户的有用信息; 对于实时图表上的一键交易,您可以下载实用程序 VirtualTradePad for MetaTrade
FREE

SwiftCap Breakout EA 采用经典的突破模型,该模型基于每日最高价和最低价区间构建。当价格突破这些区间时,EA 会精准执行交易。这种方法在不断变化的市场波动周期中均表现出稳定的表现。它针对黄金 (XAUUSD)、美元/日元 (USDJPY) 和美国钛白粉 (USTEC) 进行了校准,这些货币对均以强劲的单边扩张而闻名。 Download Set Files and Back Test Results 实时信号: 突破投资组合 (黄金、美元/日元、美国TEC套装文件) 实时信号: 突破和大师级EA组合 道具公司兼容。道具文件可通过上方链接获取。 交易规范
支持的交易品种: XAUUSD、USDJPY、USTEC 时间范围: 适用于任何时间范围 推荐经纪商: 任何点差低、执行可靠的经纪商。 账户类型: 对冲要求 点差类型: 建议使用低点差的标准账户 最低存款额: 100 美元(金额不限) EA 设置: 默认输入针对黄金进行了优化。另有适用于 USDJPY 和 USTEC 的额外设置文件。 VPS: 强烈推荐用于 24/5 全天候稳定运行 核心功能 多资产交

Advanced Hedging EA
Sophisticated risk controls, adaptive hedging methods and optimised performance for highly volatile instruments such as BTCUSD and XAUUSD.
This EA has been designed for high‑leverage accounts and is not recommended for low‑leverage setups. Please note that my time is limited and I do not offer support on this EA. Not recommended for small accounts (< 500$) Users are encouraged to share set files that have performed well in the comments section.
Key Features: Robust Risk M
FREE
BLZ 蜡烛计时器:释放交易的未来
BLZ Candle Timer 是一款先进的条形计时器倒计时工具,可显示当前条形结束和新条形出现前的剩余时间,让您步入最前沿的交易世界。
该指标可显示图表上最后一个柱形图的剩余时间,确保您领先于市场节奏,体验精确的力量。在新条形图到来时,及时发出通知,保持警惕,为您的交易策略增添动态优势。
多功能是关键: - 从 *M1 时间框架*的快速节奏到 *MN 时间框架*的广阔视野,在每个时间框架上都能无缝运行。 - 可定制参数,让您根据自己的喜好来选择*颜色*、*文字大小*和*可视性*,定制您的交易体验。
*这不仅仅是一款工具,它还是适合所有交易风格*的多功能伴侣,可满足剥头皮者和日内交易者的需求。*BLZ Candle Timer* 的计算速度快如闪电,让您与市场心跳同步,确保您不会错过任何一个节拍。
最棒的是什么?BLZ Candle Timer 适用于 *MT4* 和 *MT5*,可无缝集成到您首选的交易平台。以精确性、适应性和速度提升您的交易水平--*BLZ Candle Timer* 是您开启交易技巧新境界的钥匙。
FREE

Stochastic Gold Scalper — 精确剥头皮的自动化顾问 Stochastic Gold Scalper 是一款专业的 MetaTrader 5 自动化顾问,结合了蜡烛图模式分析和通过随机振荡器(Stochastic)过滤信号的功能。该方法能够找到最准确的入场点,最大限度地降低风险并避免错误信号。顾问非常适合在短时间框架(如 M5)上进行交易,可用于黄金、货币对和指数等多种工具。 主要优势 蜡烛图分析与随机振荡器过滤的结合
顾问能够识别关键的蜡烛图模式,例如 Bullish Engulfing(看涨吞没)、Bearish Engulfing(看跌吞没)、Hammer(锤子形态)、Doji(十字星)等。所有信号都会通过随机振荡器进行额外验证,从而过滤掉错误信号,专注于高质量交易。 灵活的风险管理
用户可以选择固定交易量或根据账户余额百分比自动计算手数。顾问还提供设置最大回撤和限制同时开仓数量的功能。 高效的交易管理
跟踪止损和盈亏平衡功能有助于最小化损失并最大化利润。用户可以根据需求自定义这些功能的参数。 简单易用
顾问具有简洁的界面和图表上的可视化元素,入场点

OVERVIEW : Trendlock_EA — The Next Level Automated Trading Powered by AI is a next-generation Expert Advisor (EA) developed using Artificial Intelligence It is designed to produce consistent, disciplined, and measurable trading decisions across various financial instruments such as FOREX | GOLD | BITCOIN | US_INDICES . The Trendlock_EA algorithm focuses on long-term stability without using high-risk strategies that can damage an account. Live Signal :
Live Signal #1: [Trendlock EA –

Ralix
Limited-Time Offer: Copies left at 80 USD: ( 1 /5) , Next price: 109. 额外奖励: 购买后给我们发消息,以获取我们私人Telegram频道的访问权限。 设置说明: 提供完整的博客指南,以确保顺利安装和配置。 https://www.mql5.com/en/blogs/post/762214 MQL5频道: 点击这里获取更新 Contact me for a demo-ready evaluation version.
Ralix 是一个强大而精炼的MT4和MT5专家顾问,专为希望将自动化与精确结合的交易者设计。此EA并非无风险,但它是市场上 最平衡 和智能设计的系统之一。 Ralix 以灵活性、控制力和透明性为核心,让您掌控局面,同时处理繁重的工作。 该策略专注于在会话高点和低点附近识别流动性陷阱。它利用智能资金概念,在零售交易者被止损时及时布局交易,以最大化潜在反转。
主要功能和自定义: 符号灵活性: 您可以轻松定义使用的交易对,无论是 XAUUSD 、EURUSD,还是您喜欢

全自动高级交易机器人。它适用于经典鳄鱼指标的信号。要退出头寸,它使用智能跟踪系统或使用挂单进行平均。 优点: 全自动系统, 可定制的指标参数, 内置自动手数计算, 直观的设置, 乘数设置, 简单的面板界面。 问题解决 -> HERE / MT4 版本 -> 这里 指标的本质: 鳄鱼指标由三个移动平均线组成。下颌长滑动(蓝色),牙齿中等滑动(红色),嘴唇快速滑动(绿色)。该指标有助于确定趋势的存在及其方向。 当绿色在上面,红色在下面,然后是蓝色时,趋势是向上的。当蓝色在顶部时,然后是红色,下方的绿色是下降趋势。当指标线相互交织时,没有明显的趋势,市场处于平盘状态。 战略: 当指标显示趋势已经开始并得到确认时,EA 将打开一个延续当前方向的订单。 也就是说,顾问与趋势交易。在一个趋势中,顾问只能打开第一个订单一次。即在一个订单或一个网格关闭后,在趋势改变方向之前,顾问不会打开新订单。 改变趋势方向后,EA 将打开相反方向的订单。 从某个位置退出 顾问打开订单后: 1 - 如果头寸向盈利方向发展,则激活追踪止损。该头寸将使用智能跟踪系统关闭。 2 - 如果头寸亏损,则使用

它是专为日内操作而开发的,允许市场操作员创建非常规的烛台图,以逃避OHLC的传统点(开盘,最高价,最低价和收盘价)。
该EA交易在任何时间范围内以秒为单位组装定制蜡烛。您可以生成标准Metatrader 5时段中不可用的图表,例如:生成27秒非常规时间范围的图表,或者,如果要生成7分钟时间范围,只需键入“ 420秒”,输入11分钟“ 660秒”等等。
一些重要的准则
[1] 始终使用M1时间范围插入EA;
[2] CANDLE BY SECONDS将创建一个离线图表,根据M1时间范围的当前柱线开始您的柱线序列;
[3] 复制从图表中插入日期起最近5天的历史记录;
[4] 如果您想在EA创建第一个图表后打开同一时间段的更多图表,只需在Metatrader 5上单击“创建新图表”按钮,选择“自定义”选项,然后选择“时间图表” 。 您将看到创建的时间范围,因此只需选择一个新窗口即可。 对每个新副本重复此步骤。 设定
[ Candle Custom ] Seconds = 以秒为单位设置任意数字以形成条形图的时间范围
[ Candle Custom ]
FREE

Auto Fibonacci Retracement Indicator — Flexible and Reliable This isn’t just another Auto Fibonacci Retracement indicator. It’s one of the most flexible and dependable tools available . If you find it useful, please consider leaving a review or comment — your feedback means a lot! Check out my other helpful tools below: Smart Alert Manager - Set up advanced alerts and send them to Mobile, Telegram, Discord, Webhook...
Timeframes Trend Scanner - Scan the trend of assets in difference timefr
FREE

介绍 Maedinas Gold Scalper - 一款专为XAUUSD/黄金交易而设计的专家顾问。该工具提供一系列功能和可自定义的设置,以帮助改善您的交易体验。 资金管理和风险控制: 启用资金管理,根据您的账户余额自动调整手数。 通过多种选项控制仓位大小,包括手动手数参数。 利用额外选项在不同市场条件下提供更多控制。 获利和止损: 定义您的获利水平和止损策略,可根据您的交易策略进行自定义。 移动止损和资产保护: 激活移动止损以保障利润。 利用资产保护功能根据特定阈值关闭交易。 灵活的交易时间表: 为每周的每一天定制交易时间,以便与偏好的市场交易时段对齐。 多个引擎和入市逻辑: 享受三个独立的交易引擎,每个引擎根据您的风险容忍度和偏好提供不同选项。 趋势过滤和新闻管理: 实施趋势过滤器,在特定市场条件下暂停交易。 利用内置的新闻过滤器避免在特定新闻事件期间交易。 经纪人强制平仓水平和点差要求: 确保与特定经纪人的要求兼容,以实现最佳性能。 推荐杠杆比例为1:500。 仅适用于MT5对冲账户类型。 最低资本要求: 需要最低资本要求为5,000。 放心交易: 进行全面的回测以确保可靠性。

Volume Weighted Average Price (VWAP) The volume weighted average price (VWAP) is a trading benchmark used by traders that gives the average price a security has traded at throughout the day, based on both volume and price. It is important because it provides traders with insight into both the trend and value of a security. This indicator VWAP V2 is free and is the manual version of the extended Easy VWAP indicator (30 Euro), where the date and time properties are automatically entered. With
FREE

"Haven Key Levels PDH PDL" 指标可帮助交易者在图表上将关键水平可视化。它会自动标记以下水平: DO (Daily Open) — 每日开盘价。 NYM (New York Midnight) — 纽约午夜价。 PDH (Previous Day High) — 前一日最高价。 PDL (Previous Day Low) — 前一日最低价。 WO (Weekly Open) — 每周开盘价。 MO (Monthly Open) — 每月开盘价。 PWH (Previous Week High) — 前一周最高价。 PWL (Previous Week Low) — 前一周最低价。 CMH (Current Month High) — 当月最高价。 CML (Current Month Low) — 当月最低价。 PMH (Previous Month High) — 上一月最高价。 PML (Previous Month Low) — 上一月最低价。 其他产品 -> 点击这里 。 自定义功能: 选择线条颜
FREE

OpenAI 的人工智能驱动技术 Martini AI EA 是一款专为澳元/美元、欧元/美元、英镑/美元、新西兰元/美元和美元/瑞郎设计的高级交易专家顾问。它专注于安全性、持续收益和可扩展的盈利能力。Martini AI EA 集成了严谨的剥头皮策略,并基于最新的 ChatGPT 技术构建了神经网络、机器学习和人工智能分析功能。这确保了其自适应决策、精准交易和卓越的交易体验。 加入我们拥有超过 7000 名成员的 MQL5 社区 ,与其他交易者建立联系。随时了解最新产品发布、交易技巧和独家见解。 MT4版本 Martini AI EA 设置指南和功能 特征 夜间安静的外汇交易时段是交易最佳时机 专为在 5 分钟图表上快速剥头皮而设计 使用挂单进行精确进场和出场 人工智能通过智能学习适应市场变化 即使在睡觉时也能自动获得利润 使用真实数据进行测试,确保性能可靠 内置人工智能风险管理,实现更安全的交易 避开新闻发布时间以降低波动风险 释放夜间外汇交易的力量 促销价:599 美元(购买 5 次为止)| 下次价格:799 美元 | 最终价格:2999 美元 用户还将获得免费的补充 EA,以

移动平均收敛发散(MACD)交易策略是一种流行的技术分析工具,用于识别动量和趋势方向的变化。MACD的计算方法是将26期指数移动平均线(EMA)减去12期EMA。然后在MACD上方绘制一个9期EMA,称为“信号线”,以充当买入和卖出信号的触发器。 当MACD线在信号线上方时,MACD被认为处于看涨区域,在下方时处于看跌区域。交易者经常使用这些信息来确定潜在的买入和卖出机会。 MACD是一种多功能指标,可以用多种方式使用,其中一些常见的用法包括: 交叉:当MACD线穿过信号线时,出现看涨交叉;当MACD线穿过信号线下方时,出现看跌交叉。 发散:当MACD正在创造新高时,而基础证券没有创造新高时,出现看涨发散;当MACD正在创造新低时,而基础证券没有创造新低时,出现看跌发散。 趋势跟踪:当MACD在零线上方时,出现看涨趋势;当MACD在零线下方时,出现看跌趋势。 需要注意的是,MACD是一种滞后指标,应与其他技术指标和分析结合使用才能做出交易决策。
FREE

交易助手 : 交易助手-MT4(点击下载) 交易助手-MT5(点击下载)
操作说明文档,请仔细阅读
基本使用设置 基本: 支持语言的选择切换(目前支持中文和英文) 自动识别语言 支持 热键开平仓 绑定, 使用快捷键进行快速开平仓...... 快捷键平仓.支持最大30多种热键 解锁支持大部分功能 复盘 操作,可以在 测试环境下使用 开仓平仓区域: 一键开仓( 包含止盈止损的便捷设置,手数自动计算等便捷功能) 一键平仓 (锁仓),极简的风格设计,可以自由选择平仓品种,平仓类型(多单,空单,或者挂单),是否平仓盈利大于0的订单,是否平仓亏损订单,平仓比例的设置(0~100%),且是否平仓反向,以及锁仓功能,均在选项中可以直接实现操作. 多键平仓 划线开单控件 计算出多单或者空单的 平均持仓价格 并划线 止盈止损等自动 设置 多品种,多,空,分类平仓 .. 挂单区: 批量间隔挂单 功能。
批量挂单删除 功能 自动化功能区: 止损保护功能 移动止损功能 账户风控 利润保护 批量图表打开 商品信息显示区: 显示商品重要信息 全品种信息显示 商品信息显示区: 显示商品重要信息 全品
FREE

Gold Impulse – An Effective Trading Robot for XAU/USD Features of Gold Impulse Versatility and Adaptability Versatility : Gold Impulse supports a variety of trading approaches and concepts. Automation : Frees users from constant market monitoring. Customizability : Can be adapted to specific tasks and market conditions. Market Analysis Technical Indicators : Uses moving averages, Bollinger Bands and price channels for analysis. Fluctuation Filtering : Effectively filters out random price fluctu
This is the RSI GridMaster Mini — the freely available, compact version of the popular RSI GridMaster system.
The EA operates based on the Relative Strength Index (RSI) indicator combined with a grid strategy, enabling continuous trading as the market moves. The Mini version uses a fixed lot size of 0.01 and trades exclusively on the H1 timeframe.
All settings have been simplified to make the system easy to use, reliable, and beginner-friendly. Looking for More Power and Flexibility? Check
FREE

GOLD EP 交易机器人说明 GOLD EP 是一款专为在 M15 时间周期交易黄金 (XAUUSD) 而设计的智能交易系统(Expert Advisor)。它通过分析价格走势,使用预设的止损和止盈水平来自动开仓、管理和平仓。 该机器人核心思路是捕捉 15 分钟黄金图表上的短期价格波动。当出现交易信号时,GOLD EP 根据指定的风险控制参数(止损水平)和盈利目标(止盈)下单。为了更灵活地管理交易,它还可以使用额外的过滤条件和时间限制,以降低市场不确定性。 GOLD EP 主要面向黄金的高波动性交易,能够根据不断变化的市场动态自动加仓或减仓。这有助于交易者系统化交易流程并尽量减少情绪干扰。 使用 GOLD EP 的好处包括: 自动化交易 :机器人会根据预设规则独立开仓和平仓。 风险控制 :内置的止损和止盈机制以及灵活的设置可帮助保护账户资金。 便捷性 :仅在 15 分钟图表上进行交易,简化了分析和监控。 灵活的参数 :您可以对进场和出场逻辑以及机器人的时间限制进行精细调整。 因此,GOLD EP 非常适合寻求在 M15 时间周期高效交易黄金的初学者和经验丰富的交易者。
FREE

PRADO PRO 是一个专业的交易顾问,其结果可以持续超过 1 年! 这里没有网格或马丁格尔——只有来自各个层面的清晰的系统工作,以及真正的资本保护。 其特别之处: — 使用挂单进行交易。当订单位于经纪商的服务器上时,可以确保订单的最佳执行。 — 立即设置止损和止盈 — 无需即兴发挥,保护资本并实现最大目标。 — 多功能追踪止损和获利功能——确保交易获得最大利润。 — USDJPY 的默认设置,自 2010 年起进行优化。 — 可以设置为中期交易并捕捉强劲走势。 如果您是交易新手,只需在 USDJPY 图表上运行顾问并评估多年来的工作成果! 建议最低存款额 > 500 美元,账户类型: 对冲 ,杠杆 10-1000。 专业交易员将在这里找到许多工具的有效策略! 此处使用默认设置监控 PRADO PRO 的运行。 设置描述请参见评论,第 1 页,帖子 #1。
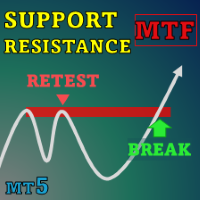
Special offer : ALL TOOLS , just $35 each! New tools will be $30 for the first week or the first 3 purchases ! Trading Tools Channel on MQL5 : Join my MQL5 channel to update the latest news from me 在瞬息万变的金融交易领域,准确识别和分析支撑与阻力位对于做出明智的投资决策至关重要。 SnR Retest and Break Multi-Timeframe 是一个支撑与阻力指标,旨在增强您的交易分析。利用创新的 Timeframe Selector 功能,该工具提供了多个时间框架下的市场动态全面视图,帮助您做出精确的交易选择。 查看更多 MT4 版本请访问: SnR Retest and Break MT4 Multi Timeframe 查看更多产品请访问: All P roducts 主要功能 SnR Retest and Break Multi-Time

尽早行动: 此EA的价格为 120 ,直到 10 份被售出。之后,价格 将增加 到 149 。在这个价格下 9 份已售出。
-------- 如果您想在 演示 账户上 免费测试 几天,请联系我。 ----------
我在市场上待得足够长,知道什么有效,什么只是一种理论。我建立了 Echo Vale ,以反映我交易时的同样心态: 结构、精确和对风险的全面控制。 作为一个交易员和程序员,我没有外包这个。我设计了这个系统的每一个部分,目标只有一个:创建一个高度 自适应 的EA,具有可扩展性、一致性和 智能性 ——尤其是在压力下。它适合严肃的账户和严肃的公司目标。 重要(1): 要获得真实的回测表现,请消息我获取说明和 设置文件 。 重要(2): 一旦购买,请联系我以获取免费的专家顾问。 (购买一个,获得两个EA) 由交易员而非仅仅是开发者构建。 我使用自己的系统。没有租用的策略。没有市场营销的把戏。您在这里获得的是数千小时的真实市场经验和技术测试的结果。 核心功能 账户感知风险引擎: 根据余额和最大回撤限制动态调整手数。 零废话: 没有“AI”的胡说。仅仅是在压力下表现的工程化逻辑

Click and Go Trade Manager: The Ultimate MT5 Execution Suite Precision Execution. Professional Performance Tracking. Total Control. In the world of Smart Money Concepts (SMC) , ICT, and high-frequency scalping, precision is your only edge. Most traders lose not because their analysis is wrong, but because their execution is slow and their psychology is undisciplined. The Hard Truth: If you are still manually calculating lot sizes or dragging lines while the price moves against you, you

Daily Range Breakout Scalper EA The Daily Range Breakout Scalper EA is designed for traders who prefer a pure breakout strategy—No AI, No Grid, No Martingale, No Averaging. It identifies daily price ranges and places Buy Stop and Sell Stop orders at strategic levels. The EA executes trades once per day, ensuring a disciplined and structured approach. See signal for Default Set File (Short Trailing Stop): https://www.mql5.com/en/signals/2295678
Pricing Rules
Next Price (January 1, 2025 – Januar
您知道为什么MetaTrader市场是出售交易策略和技术指标的最佳场所吗?不需要广告或软件保护,没有支付的麻烦。一切都在MetaTrader市场提供。
您错过了交易机会:
- 免费交易应用程序
- 8,000+信号可供复制
- 探索金融市场的经济新闻
注册
登录