 MetaTrader 5
 Experts
 Indicateurs
 Bibliothèque
 Utilitaires
 Widgets
 Règles
Regardez les tutoriels vidéo de Market sur YouTube
Comment acheter un robot de trading ou un indicateur
Exécutez votre EA sur
hébergement virtuel
hébergement virtuel
Test un indicateur/robot de trading avant d'acheter
Vous voulez gagner de l'argent sur Market ?
Comment présenter un produit pour qu'il se vende bien
Indicateurs techniques gratuits pour MetaTrader 5 - 42
 Les signaux provenant des indicateurs techniques jouent un rôle crucial dans l'ouverture et la clôture des transactions sur les marchés boursiers et les marchés forex. L'essence des indicateurs est une transformation mathématique du prix d'un symbole financier visant à prévoir les changements de prix futurs. Testez les indicateurs techniques pour mieux prédire le comportement du marché et en tirer profit.
The Alert Arrows RVI indicator is an advanced version of the Relative Vigor Index (RVI), augmented with alert arrow functionality. It can identify potential support and resistance levels, providing traders with valuable insights into market dynamics. Key Features: Alert Arrows: Integrated alert arrows offer visual cues for potential trading opportunities. Additional Filters: Two extra filters are implemented to improve the indicator's readings, increasing the accuracy and reliability of signals
FREE
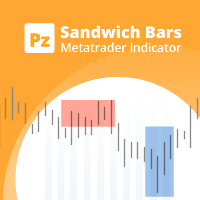
Spot high-probability trades: sandwich bar breakouts at your fingertips This indicator detects Sandwich Bars of several ranges, an extremely reliable breakout pattern. A sandwich setup consists on a single bar that engulfs several past bars, breaking and rejecting the complete price range. [ Installation Guide | Update Guide | Troubleshooting | FAQ | All Products ] Easy and effective usage Customizable bar ranges Customizable color selections The indicator implements visual/mail/push/sound ale
FREE

Take a Break Indicator gives any chart its own protection rules: pause before news, stop after a daily loss, trade only during your hours, or pause when your own indicator condition is true. News filter, drawdown protection, time filter and custom indicator rules per chart. It is the free companion of the Take a Break EA, which does the pausing for the whole account. Rules you can set per chart Custom indicator rules (MetaTrader 5): put any indicator on the chart and write a condition. RSI>70 ,
FREE

Cobalt MACD Multi-Timeframe (MTF) Panel Maîtrisez tous les niveaux du marché d'un seul coup d'œil. Le Cobalt MACD MTF est un panneau d'analyse stratégique avancé conçu pour les traders professionnels. Cet indicateur scanne en temps réel 21 unités de temps différentes (de M1 à Mensuel) et transforme les données complexes de momentum en un tableau de bord élégant, intuitif et interactif directement sur votre graphique. Oubliez la nécessité de changer constamment d'unité de temps pour comprendre la
FREE
This indicator combines TRIX (Triple Exponential Moving Average) with a Moving Average, which can be simple, exponential, smoothed or weighted.
This combination is very useful to identify the main trend and when it is changing to a new direction.
The indicator also has signals on the chart that indicates the TRIX crossing with the Moving Average, as well as pop-up alerts and push (in the MT5 app).
Enjoy it!
FREE

# CAM Ultimate — Gold Trading System
## Short Description
CAM Ultimate is a complete gold (XAUUSD) trading toolkit built around a Hull Moving Average trend-stack combined with an RSI extreme filter, layered with fibonacci trend lines, key price zones, and a 300-pip grid. It's available as matching indicator + auto-trading pairs for both MetaTrader 5 and cTrader, plus the original TradingView script — so you can watch the signal build for free before ever risking an order.
---
## In-Depth De
FREE

LZ Multi-Timeframe Candle Timer displays the remaining time before the current bar closes for multiple timeframes simultaneously on a single dashboard. Monitor up to 9 timeframes (M1, M5, M15, M30, H1, H4, D1, W1, MN1) without switching charts. The indicator uses server time, updates every second, and is optimized for smooth display with minimal CPU use.
Feature highlights
- Multi-timeframe display: select which timeframes to show (M1 through MN1) via boolean inputs. Display only the interval
FREE

GIVE A LOOK TO MY OTHER PRODUCTS ! 100 % PER MONTH PROFIT----CONTACT ME FOR MORE INFO ! Smoothed MA cross alert,is a cool indicator that notificate you directly on your telephone or email when 2 Smoothed Moving average ( you choose the parameters ) crosses. This is very important when you want to know a change of trend and you can't stay in front of your pc! The indicator give you the alert just when the next bar opens ,so give you a more accurate entry. Please ask me for more info... You find
FREE

Rate of Change en pourcentage affiché sous forme d'histogramme coloré selon la force : en hausse au-dessus de zéro, en baisse au-dessus de zéro, en baisse sous zéro et en hausse sous zéro. Caractéristiques principales Calculé sur les barres clôturées, les valeurs ne se redessinent pas Fonctionne sur tous les symboles et toutes les unités de temps Toutes les périodes, tous les niveaux et toutes les couleurs peuvent être modifiés dans les paramètres Léger en ressources grâce à un réglage du nombre
FREE

Smart MCD (Hot Money) is a MetaTrader 5 indicator that visualizes three market-participant groups as color-coded histograms in a separate window, all normalized to a 0-20 scale. It uses a sensitivity-weighted, offset-adjusted RSI engine to suggest when large capital is entering or leaving the market. Features Three participant views: Retailer (a fixed ceiling reference at 20), Hot Money (short-term institutional flow) and Banker (longer-term smart-money flow). Normalized scale: all groups read o
FREE

ParabolicMove Free ️ IMPORTANT : Cette version gratuite est limitée exclusivement à la paire USDJPY et à l'unité de temps H1 . Le trading ne consiste pas à prédire l'avenir ; il s'agit d'identifier des schémas à haute probabilité où la « Smart Money » laisse des empreintes. ParabolicMove est un outil d'analyse technique professionnel conçu pour détecter les mouvements impulsifs forts (Parabolic Runs) et les entrées de haute qualité qui surviennent lors de la phase de retracement. Contrairement
FREE

INSIDE BAR ZONE - Interactive Price Action Mapper for MetaTrader 5 Automatically detects every inside bar on your chart and draws a transparent, draggable price zone from its High to its Low. Complete with High, Mid, and Low price labels rendered directly on the zone. WHY TRADERS USE IT - Zero-maintenance detection. Every inside bar across up to 500 bars back is mapped the moment you attach the indicator. No manual zone drawing. - Persistent zones. A built-in watchdog recreates any box you a
FREE

Trading in global markets (such as Forex, Indices, and Commodities) demands maximum attention to time. However, MetaTrader 5 natively displays only your broker’s server time, forcing the trader to constantly make mental calculations to know the exact time on their own computer.
Pinpoint Local Time solves this problem elegantly and in an integrated way. It adds a secondary, ultra-compact time scale (ruler) at the bottom of your chart, which runs synchronously with market history, displaying the
FREE

RBM Nasdaq Liquidity Hunter
Institutional Liquidity Indicator for Nasdaq
RBM Nasdaq Liquidity Hunter is an advanced liquidity analysis tool developed for Nasdaq traders who want to identify institutional liquidity events with greater precision.
Instead of highlighting every breakout, the indicator filters market noise and identifies only liquidity sweeps confirmed by volume, trend, and multiple institutional confluence factors. Every detected event is evaluated through a proprietary scoring
FREE
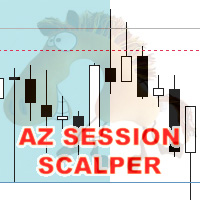
AZ session scalper
A small but useful session indicator, designed primarily for scalping. Enable the session you plan to trade, watch the reaction of the M5/M15 candlesticks to the level of the previous trading session, and enter. We always look at the reaction of the current session to the previous one. For example, if you trade the Americas, enable the European session, and watch how one session takes away liquidity from another. Important: adjust the time to your broker's time zone in the i
FREE

by installing this indicator you can create a horizontal line with the click of a button press Q = to create a horizontal line at the location of mouse pointer press W = to delete all existing horizontal lines press E = to delete the horizontal line nearest to your mouse pointer WANT SIMILAR INDICATOR for PRICE ALERT ?? CHECK OUT MY OTHER PRODUCTS https://www.mql5.com/en/market/product/165765
by default the line is blue with dashes and price highlighted on the line, but its fully customizable
FREE

Volatility Dragon Align Alert is a multi-timeframe SuperTrend indicator.
It shows H1, H4 and D1 SuperTrend on one panel.
ALIGNED = all three timeframes match.
MISALIGNED = they do not match.
When aligned it draws:
- StopLoss line (H1 ATR)
- TakeProfit line (H1 ATR)
Alerts:
- Aligned
- Misaligned
- H1 flip
- Price testing the stop line
- StopLoss hit
- TakeProfit hit
The panel also shows floating profit of open positions on the same symbol.
Designed for Deriv Volatility indices (V10, V25, V2
FREE

HCS SessionPulse is a free, read-only global trading session monitor for MetaTrader 5.
A compact on-chart panel shows the current status of the Sydney, Tokyo, London, and New York trading sessions and continuously counts down to upcoming session transitions.
SessionPulse displays:
• Sydney session OPEN/CLOSED status • Tokyo session OPEN/CLOSED status • London session OPEN/CLOSED status • New York session OPEN/CLOSED status • Time remaining until each session's next open or close • Currently
FREE

Distance entre la clôture et une moyenne mobile mesurée en unités d'ATR, un moyen simple de voir quand le prix est en extension excessive. Caractéristiques principales Calculé sur les barres clôturées, les valeurs ne se redessinent pas Fonctionne sur tous les symboles et toutes les unités de temps Toutes les périodes, tous les niveaux et toutes les couleurs peuvent être modifiés dans les paramètres Léger en ressources grâce à un réglage du nombre maximal de barres Buffers disponibles pour vos pr
FREE
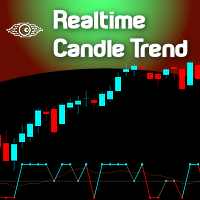
Seeing and interpreting a sequence of Candlesticks is easy to spot when you are a human... Higher Highs, Higher Lows, are the panorama of a Buying trend, at least in a short period of time... Seeing a current candlestick higher high and a lower candlestick low, as a human, you can immediately spot a "divergence", an "alert", a "starting range", but in the end and based on other analysis a human trader can understand and behave accordingly to this kind of candlestick data... But what about EAs (r
FREE

Wizard Poverty Sanitizer is a moving average based indicator, using three EMA'S being 2OO EMA which is the slow EMA, the 21 EMA which is the median and the 10 EMA which is the fast. When the median and the fast EMA cross a signal is given, when the fast EMA goes above the Median EMA a buying signal is given and when the fast cross below the median a selling is given. Note that you can change the moving averages to you own choices of moving averages, allowing you to set your own MA strategy. an
FREE

Coral trend is a trend-following indicator that is widely popular among FOREX traders . It is usually used as a confluence with other indicators. It uses combinations of moving averages with complex smoothing formulas! It has two configurable parameters: Coefficient - smoothing ratio (*)
Applied price Calculation: Coral = (-0.064) * B6 + 0.672 * B5 - 2.352 * B4 + 2.744 * B3
FREE

Dual Scale Candles superpose les vraies bougies d'un second symbole directement sur votre graphique, avec sa propre échelle de prix indépendante sur l'axe gauche.
Comparez l'or à une devise, le pétrole à un indice, ou deux instruments quelconques sur un même graphique - chacun conserve ses prix réels. Les deux séries sont alignées au point de votre choix : la première barre du jour actuel affichée sur le graphique, la première barre de la semaine actuelle ou la plus ancienne barre affichée - su
FREE

XAU Macro Risk Filter affiche les événements macroéconomiques américains sur le graphique XAUUSD avec des zones de risque colorées, des lignes verticales et un panneau d'information avec compte à rebours. Utilise l'API native du calendrier MT5 sans services externes. Trois niveaux de risque avec fenêtres de temps configurables individuellement. Intégration EA via GlobalVariables.
Cet indicateur lit le calendrier économique intégré de MT5 et affiche les événements macroéconomiques américains sur
FREE

DONCHIAN CHANNEL DC Il s'agit d'un indicateur de tendance développé par “Richard Donchian”, composé de 3 couches, le canal supérieur, le canal inférieur et le canal intermédiaire. Il est créé sur le canal Donchian en traçant les prix les plus élevés et les plus bas atteints au cours de la période précédente sur le graphique des prix. Il est également utilisé pour mesurer la volatilité du marché, car il s'agit d'un canal d'expansion/contraction en fonction de l'augmentation/diminution de la volat
FREE

Renko Flow Are you a trader who loves using Renko charts?
Unfortunately, MetaTrader does not provide an easy built-in way to display Renko charts directly. That’s why Renko Flow was created — to give traders a simple and practical way to use Renko-style visualization without needing complicated external tools or offline charts.
Renko Flow can visualize Renko charts directly inside a separate window, allowing you to analyze Renko movement while still keeping your original price chart clean and
FREE
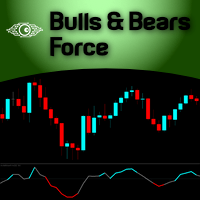
Welcome to the Minions Labs' reinterpretation of the Classic Bulls & Bears Power , developed by Alexander Elder a long ago. Since the 2 indicators: Bull Power and Bear Power were histogram-based indicators and having 2 indicators in the same chart and occupy too much screen, we decided to mix them into ONE Line and Color-based indicator, which give us all the information we need. The Bull & Bear Power indicators help you determine the strength of BUYERS (Bulls) vs. SELLERS (Bears). Basically, it
FREE

Profil de marché HiperCube ! Code de réduction de 20% sur Darwinex Zero : DWZ2328770MGM_20 Un profil de marché est une représentation graphique qui combine les informations de prix et de temps sous la forme d'une distribution. Il affiche les informations de prix sur l'échelle verticale (axe des Y) et les informations de volume sur l'échelle horizontale (axe des X). Ce type de graphique fournit des informations sur l'activité du marché, permettant aux traders de visualiser et d'évaluer la juste
FREE

Indicator Description 4 Hull MA Color + Envelopes is a powerful trend-following indicator for MetaTrader 5 that combines four Hull Moving Averages (HMA) with Moving Average Envelopes to clearly identify market direction, trend strength, and potential reversal or pullback zones. This indicator is designed to reduce noise, react quickly to price movement, and provide a clean visual structure for professional trading. Key Features 4 Hull Moving Averages (20, 50, 100, 200) Automatic color change
FREE

iK Trendz Trading: The Ultimate Multi-Asset Trend Intelligence iK Trendz Trading is a professional-grade trend following indicator designed to provide traders with a crystal-clear view of market direction across multiple symbols and timeframes simultaneously. By combining advanced volatility-based logic with an intuitive Multi-Timeframe (MTF) dashboard, it eliminates the noise and identifies high-probability trading zones. Whether you are a scalper, day trader, or swing trader, this tool is desi
FREE
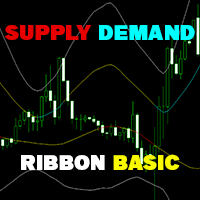
Supply Demand Ribbon is an indicator with moving supply and demand lines that help you identify price zones more easily. The indicator helps you determine flexible entry, stop loss, and take profit areas. There are also strategies for algorithmically changing ribbon colors. From there you can come up with many trading strategies for yourself! You can explore many feature in Advanced version here !
MT4 Version: Click here! You can combine it with our indicators below to make your trading
FREE
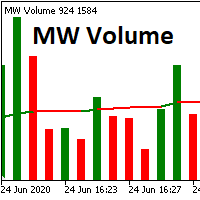
The Martinware Volume indicator plots a colored moving average over volume bars. The coloring uses three colors and can be done in different ways choosable by the user and is applied both to the average as to the volume bars.
Three types of coloring are possible: None: no coloring is done Increasing or decreasing: changes the color depending on the current value being bigger or lesser than the previous one Volume relative to average: colors vary if the current volume is bigger or lesser then
FREE

Fractal3K Pro – High-Precision Top/Bottom Reversal Indicator Short Description:
Fractal3K Pro is a professional trading indicator based on a three-bar fractal structure, automatically identifying top and bottom reversal points, providing clear visual buy and sell signals, suitable for both short-term and mid-to-long-term trading. Full Description:
Fractal3K Pro is a high-precision top and bottom reversal indicator designed to capture key market turning points. Based on a three-bar fractal stru
FREE
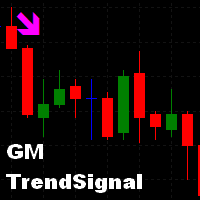
We often need to know the sudden change in trend that happens on the graph and this can be confirmed through indicators.
This indicator shows the moments of trend reversal and how in which trend the price is shifting.
Custom background, no need to configure the colors in the chart, just drag the indicator!
Indication with arrows.
- Blue arrow: Upward trend.
- Pink Arrow: Downward Trend.
NOTE: Free indicator, support may take a while to respond.
FREE

Session boxes with automatic GMT offset & DST, a global world-clock panel, and a personal Trading Window that alerts you the second a trade slips outside your plan. Set it once — never adjust for daylight saving again.
TrendSync Sessions — Trade the Right Hours, on Any Broker Every session indicator dies twice a year: daylight saving changes, the boxes shift, and you are left re-entering GMT offsets by hand. TrendSync Sessions was built to end that. Sessions are defined in each exchange's LOCA
FREE

Aurum Xau Vector is a professional trading indicator designed specifically for Gold / XAUUSD.
The indicator combines price geometry, Fibonacci-style target alignment, ATR-based risk zones, MACD confirmation, candle confirmation, session filtering, and alert notifications in one clean tool.
It is built for traders who want fewer but more selective Gold signals. Instead of printing many random arrows, Aurum Xau Vector focuses on quality filtering and can be configured to allow only one signal p
FREE

Le Chande Momentum Oscillator compare la somme des mouvements haussiers à la somme des mouvements baissiers, de -100 à +100, avec une ligne de signal. Caractéristiques principales Calculé sur les barres clôturées, les valeurs ne se redessinent pas Fonctionne sur tous les symboles et toutes les unités de temps Toutes les périodes, tous les niveaux et toutes les couleurs peuvent être modifiés dans les paramètres Léger en ressources grâce à un réglage du nombre maximal de barres Buffers disponibles
FREE

Trading Dashboard FULL - Real-Time Performance & Analytics Calendar Trading Dashboard FULL is an advanced, interactive visual analytics tool for (MT5). Designed for serious traders, prop firm challenge takers, and portfolio managers, this indicator converts your raw trading history into a clear, comprehensive monthly calendar and real-time statistics dashboard right on your main chart window. No more switching between account tabs or downloading report files to analyze your trading performance.
FREE

Bienvenue sur HiperCube DonChian
Cet indicateur vous fournit des informations très utiles sur les prix, vous indiquant si le prix va probablement monter ou descendre. Code de réduction de 20% sur Darwinex Zero : DWZ2328770MGM_20 Caractéristiques : Indicateur dans la fenêtre principale Personnalisez les couleurs de vos bougies Période personnalisée de l'indicateur Définir les paramètres
Comment interpréter : Tendance à la hausse : si certaines bougies montent au-dessus de la bande supérieure,
FREE

Short Description Yesterday H/L, Today H/L and ADR% on any chart. Color-coded gradient signals overextension at a glance. Full Description Mattrix Day Levels is a clean, lightweight indicator that displays the four key reference levels every day trader needs: Yesterday High and Low (YH, YL) Today High and Low (TH, TL) Average Daily Range percentage (ADR%) Drawn directly on the chart, the indicator marks the current trading day's progression against its historical range. The today range is shown
FREE
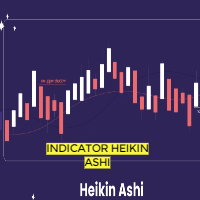
In this indicator, Heiken Ashi candles are calculated with the most optimal method. You can also customize the results by adjusting the amount of period and method input. But the most important advantage of this indicator is the adjustment of the time frame value. You can use this to calculate the Heiken Ashi chandels to See in time frames with lottery in the lower time chart. In this case, you get the best signal to buy or sell using two or more Heiken Ashi indicators with different timeframes
FREE
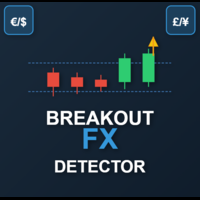
This is a powerful, session-aware breakout indicator designed for serious traders who thrive on volatility and structure. Engineered for precision, it identifies high-probability breakout zones during the London and New York trading sessions—where the market moves with intent. Key Features: Session Range Detection
Automatically detects and highlights the key price range of London and New York sessions. Breakout Confirmation
Identifies breakout candles after the session range, with clear bullis
FREE

TSD-47 RSI Matrix TSD47 RSI Matrix is a tactical multi-timeframe momentum dashboard designed to provide instant RSI and trend-strength awareness across multiple market structures. The indicator combines: 1 Minute RSI 5 Minute RSI 15 Minute RSI ADX Trend Strength Analysis inside a compact tactical dashboard interface built for modern traders. The goal of the dashboard is to simplify momentum analysis and help traders quickly identify: bullish pressure, bearish pressure, momentum alignment, and o
FREE

GDS Renko Pip ST Chart - Pip-Based Renko Chart Indicator for MetaTrader 5 GDS Renko Pip ST Chart is a pip-based Renko chart indicator for MetaTrader 5. It helps traders build and study cleaner Renko price movement using a practical fixed pip or point-based brick structure. This tool is designed as a Renko chart foundation for manual analysis. It does not predict the market, does not generate buy or sell signals and does not decide whether a trade should be opened. Renko EDGE EA
Golden Delta | A
FREE
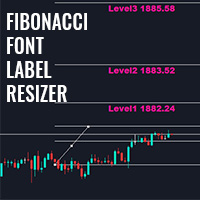
Cet indicateur vous permet d'afficher les étiquettes des niveaux de Fibonacci avec une grande taille de police
. Il prend en charge jusqu'à 25 niveaux de Fibonacci
- Dès que vous dessinez Fibonacci, il affiche les niveaux que vous avez ajoutés comme paramètre d'entrée avec une grande taille de police avec la couleur et la police que vous choisissez.
Options personnalisables :
1. Police de texte Fibo
2. Taille du texte Fibo
3. Couleur du texte Fibo
3. Ajoutez une description à chaque nivea
FREE

L’indicateur Descent Blade est un système de signaux de retournement de tendance sans redessin pour MetaTrader 5. Il combine un Parabolic SAR de Wilder avec une variante décalée d’une barre pour la détection des entrées, ainsi qu’une couche de fractales de Bill Williams pour les signaux de prise de profit (TP) et de ré‑entrée (RE). Chaque signal est calculé uniquement sur la clôture confirmée d’une barre — une fois tracés, les signaux historiques ne se déplacent pas, ne changent pas et ne dispar
FREE

Indicateur Elegant Oscillator (EO) avec support multi-unités de temps, signaux visuels personnalisables et système d'alertes configurable.
Les services de programmation freelance, les mises à jour et autres produits TrueTL sont disponibles sur mon profil MQL5 .
Les retours et avis sont très appréciés !
Qu'est-ce que l'EO ? L'Elegant Oscillator (EO) est un indicateur de momentum normalisé qui combine une Transformation de Fisher (tangente hyperbolique inverse) avec un filtre passe-bas de Butte
FREE

SurfBot Radar is a free breakout and trend indicator for MetaTrader 5. It plots a Donchian channel (the highest high and lowest low of the last N bars), marks the first bar that breaks the channel, and confirms each breakout with flow — the net of directional volume over a recent window. Breakout + matching flow shows a clear BUY or SELL signal; a breakout without flow is flagged as "no confirmation".
A graphical on-chart panel (placeable in any corner) shows the current state, the flow, the c
FREE

Trend Multi-Timeframe Dashboard vous indique si le marche monte ou descend sur quatre unites de temps a la fois, a l'aide d'une moyenne mobile exponentielle rapide et d'une lente sur chaque unite. Au lieu de deviner la direction ou de changer de graphique, vous voyez l'ensemble dans un seul panneau. Par defaut il lit les unites M15, H1, H4 et D1, et les reglages sont entierement configurables. Chaque unite apparait en vert quand la tendance est haussiere, en rouge quand elle est baissiere et en
FREE
Classic ZigZag formula. But no lags and repaints. You can see on screenshots that it shows values between peaks and it is useful to test strategies based on indicator. Because sometimes people find a good idea about it but don't understand that repainting indicators have some things to keep in mind. The parameters are the same as original ZigZag indicator: Depth, Deviation and Backstep. Useful for visual analyze of the chart and cut strategies based on repainting peaks.
FREE

Aurum Premium Chart Themes - make MetaTrader 5 look premium in one click.
Combine it with our other FREE PRoducts/Tools
Five hand-tuned colour themes with a soft glow, a clean layout and a subtle symbol watermark. Drop it on any chart and it looks finished instantly. Remove it and your original colours come back automatically.
THEMES - Noir Gold: deep black with gold candles. The signature Aurum look. - Midnight Glass: dark navy with teal and rose. - Carbon: minimal black and white. - Ivor
FREE

FiboTrend Continuation Zones draws recent impulse moves and Fibonacci pullback zones for discretionary trend-continuation analysis.
FiboTrend Continuation Zones is a visual MT5 indicator for traders who study pullbacks after strong directional moves.
The indicator identifies a recent qualifying impulse move, draws Fibonacci-style pullback levels, and highlights the 50.0%-61.8% pullback area for discretionary continuation analysis. It can also display optional reference levels for split entrie
FREE

DailyHiLo Indicator
Master the daily range like a pro. This indicator automatically plots the previous day’s high and low levels —a core element in the (Beat The Market Maker) trading approach—directly on your chart. These levels act as natural boundaries for intraday price action, helping traders identify potential reversal zones, breakout points, and liquidity targets. Key Features Accurate plotting of yesterday’s high and low for any symbol and timeframe. Works seamlessly with BTMM-inspired
FREE

Affiche les valeurs de Stop Loss, Take Profit et le profit/perte en temps réel des positions ouvertes dans un seul panneau. Convivial, déplaçable et multilingue pour une gestion des risques simplifiée.
gestion des risques, stop loss, take profit, profit perte, analyse de portefeuille, indicateur MT5, panneau de trading, support multilingue Description générale Cet indicateur affiche sur la plateforme MetaTrader 5 les valeurs de Stop Loss, Take Profit et le profit/perte en temps réel de vos posi
FREE

MA Valuation Fluctuations measures how far the current price stands from its moving average. The deviation is expressed in units of dispersion and then compressed by a hyperbolic tangent into a fixed range from -1.0 to +1.0. The indicator is drawn in a separate window and can be used as a context filter next to a trend following or a mean reversion approach. What the indicator shows For every bar the indicator compares the selected price with a moving average in logarithmic terms. Because the r
FREE

ACTION CHAIN Multi-Engine Confluence & Order Flow Indicator Action Chain is a quantitative signal indicator for MetaTrader 5 built on market structure, volumetric calculations, and order flow mechanics. Rather than relying on a single lagging indicator, Action Chain integrates 6 independent analytical modules into a weighted mathematical confluence matrix. A signal is plotted only when the cumulative weight of active modules meets or exceeds the user-defined threshold. Key Technical Specificatio
FREE

Magic Number Stats shows how each Expert Advisor on your account is really doing. If you run several EAs on one account, the account history mixes all of their trades together. This indicator separates them by magic number and shows one row per EA, so you can see at a glance which EA is earning and which one is losing. For every magic number (manual trades are shown as "Manual") the table shows: Trades: number of closed positions Win%: share of positions that closed with a profit after commissio
FREE
Introduction to GARCH Indicator GARCH is the short initial for Generalized Autoregressive Conditional Heteroskedasticity and it is the volatility prediction model commonly used in financial industry. GARCH model was first appeared in the work by Danish Economist, Tim Peter Bollerslev in 1986. The 2003 Nobel Prize winner, Robert F Engle also added much contribution for the refinement of GARCH model with Tim’s work. Our GARCH INM predictor took the original method of Nelder Mead for GARCH model bu
FREE

WickAndBody Volume Flow v5.2 Order Flow Analysis through Candle Segmentation The WickAndBody Volume Flow is an advanced diagnostic tool for MetaTrader that allows traders to "see" inside every Japanese candlestick. Unlike conventional volume indicators, this algorithm utilizes Multi-Timeframe (MTF) technology to break down real volume and determine exactly how much capital was traded in the wicks versus the candle body . Key Features Volume Detection: Uses lower timeframe data (M1/M5) to reconst
FREE

Fractal Adaptive Channel Fractal Structure • Linear Regression • Fibonacci Levels • Volume Order Blocks Fractal Adaptive Channel is a dynamic MT5 market-structure indicator designed to identify potential price reaction, continuation, support and resistance areas using a combination of hourly fractal structure, linear regression smoothing and Fibonacci-based internal and external levels . The channel is rebuilt each trading day using the previous day's hourly fractal high and low structure and is
FREE

VProfile Rebounce Scanner Pro Institutional Volume Profile Entries — Automated Across Your Entire Market Watch Stop guessing where price will react. Let the market's own volume tell you. Every session, the market builds a footprint — where the heaviest trading actually happened, not just where price wandered. That footprint is the Value Area and its center, the Point of Control (POC). Institutions build positions around these levels. Retail traders usually can't see them at all, let alone act o
FREE

Smart Volatility Squeeze MT5 Smart Volatility Squeeze MT5 is a volatility compression and momentum expansion indicator for MetaTrader 5. It builds on John Carter's Volatility Squeeze framework and extends the usual single-tier squeeze into three compression tiers, so you can see not only whether the market is compressed but how tightly it is compressed before it expands. The indicator opens in a separate window and draws two elements: a linear regression momentum histogram and a row of coloured
FREE

BullBear Strength Meter The BullBear Strength Meter is a dynamic market sentiment and momentum indicator that quantifies the real balance of power between buyers and sellers. Instead of relying on a single formula, it fuses multiple proven analytical engines into one comprehensive strength model — giving traders an accurate visual readout of bullish and bearish dominance in real time. This tool measures, compares, and displays the intensity of market forces using advanced statistical and trend-b
FREE

。。。。。。。。。。。。。。。。。。。。。。。。。。。。。。。。。。。。。。。。。。。 This indicator is based on Bollinger Bands indicator. It helps user clearly know the Band is expand or contract.
The method of use is the same as the traditional Brin channel index. Users can use different color areas to distribute forest channel indicators in expansion or contraction stage. -------------------------------------------------------------------------------------------
FREE

Quantum Signal Flow is a professional-grade trend-following indicator for MetaTrader 5 that synchronizes volatility, momentum, and oscillatory filters into a single, high-precision signal engine. By combining the legendary SuperTrend with refined RSI and Stochastic layers, it eliminates "market noise" and identifies high-probability entry points with surgical accuracy. Key Features: Intelligent Trend Core : Based on a robust SuperTrend algorithm that adapts to market volatility using ATR. Dual
FREE

SuperSmooth MTF EMA est la version gratuite de l’indicateur de tendance SuperSmooth EMA pour MetaTrader 5. Il permet aux traders de découvrir l’algorithme SuperSmooth EMA et d’analyser la direction du marché à l’aide d’une moyenne mobile particulièrement fluide et stable. Contrairement aux moyennes mobiles traditionnelles, la SuperSmooth EMA utilise une méthode de lissage spéciale où le calcul EMA est appliqué plusieurs fois. Cette approche réduit efficacement le bruit du marché tout en restant
FREE

Live MTF Trend Panel for MT5 Professional Multi-Timeframe Trend Dashboard with Live Candlestick Analysis Live MTF Trend Panel adalah indikator profesional MetaTrader 5 yang menampilkan kondisi trend secara real-time pada 9 timeframe sekaligus , mulai dari M1 hingga Monthly , menggunakan analisis murni berdasarkan candlestick tanpa indikator teknikal apa pun. Panel ini dirancang untuk trader yang membutuhkan gambaran cepat mengenai arah pasar dari berbagai timeframe dalam satu tampilan yang ringk
FREE

The FVG Toolkit is a lightweight Smart Money Concepts (SMC) indicator that automatically identifies and draws Fair Value Gaps (FVG) on your chart . It scans for the classic 3-candle imbalance patterns (BISI & SIBI) to highlight high-probability liquidity zones for your entries . Key Features Dynamic Zones: The FVG boxes extend to the right and automatically freeze when the gap is fully filled by the price . Auto-Cleanup: Option to automatically delete boxes once they are fully mitigated to keep
FREE

AE-VWAP with Rejection Bands for Daily/ Weekly / Monthly AE-VWAP is a professional custom indicator that helps you evaluate the fair price of an instrument based on trading volume. The calculation is based on VWAP (Volume Weighted Average Price), a volume—weighted average price that is widely used in intraday and medium-term analysis.
Unlike regular moving averages, VWAP takes into account not only the price, but also the volume, giving more weight to those levels where the main trading activi
FREE

Squeeze Momentum Force is an advanced technical analysis indicator designed for MetaTrader 5. It combines volatility squeeze detection with momentum analysis to identify high-probability trading opportunities. Based on John Carter's original concept, this enhanced version incorporates: Multi-Timeframe (MTF) analysis. Divergence detection. Volume weighting. Modern user interface for quick market interpretation. The indicator identifies periods of low volatility (squeeze) that typically precede si
FREE
Le MetaTrader Market est le meilleur endroit pour vendre des robots de trading et des indicateurs techniques.
Il vous suffit de développer une application pour la plateforme MetaTrader avec un design attrayant et une bonne description. Nous vous expliquerons comment publier votre produit sur Market pour le proposer à des millions d'utilisateurs de MetaTrader.

Vous manquez des opportunités de trading :
- Applications de trading gratuites
- Plus de 8 000 signaux à copier
- Actualités économiques pour explorer les marchés financiers
Inscription
Se connecter
Vous acceptez la politique du site Web et les conditions d'utilisation
Si vous n'avez pas de compte, veuillez vous inscrire