 MetaTrader 5
 Experts
 Indicateurs
 Bibliothèque
 Utilitaires
 Widgets
 Règles
Regardez les tutoriels vidéo de Market sur YouTube
Comment acheter un robot de trading ou un indicateur
Exécutez votre EA sur
hébergement virtuel
hébergement virtuel
Test un indicateur/robot de trading avant d'acheter
Vous voulez gagner de l'argent sur Market ?
Comment présenter un produit pour qu'il se vende bien
Indicateurs techniques gratuits pour MetaTrader 5 - 37
 Les signaux provenant des indicateurs techniques jouent un rôle crucial dans l'ouverture et la clôture des transactions sur les marchés boursiers et les marchés forex. L'essence des indicateurs est une transformation mathématique du prix d'un symbole financier visant à prévoir les changements de prix futurs. Testez les indicateurs techniques pour mieux prédire le comportement du marché et en tirer profit.
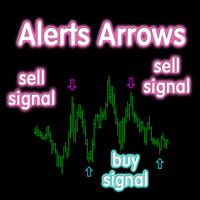
Мой самый популярный и востребованный продукт здесь https://www.mql5.com/ru/market/product/41605?source=Site+Market+Product+From+Author#
Индикатор стрелочник идеален для торговли в боковике, очень точно показывает моменты перекупленности и перепроданности инструмента, с дополнительными фильтрами также можно использовать для торговли по тренду. На экран выводятся стрелки сигнализирующие о развороте тренда, направление стрелки показывает дальнейшее направление торговли, также имеется звуковое о
FREE
Simple Spread Indicator (SSI) is a simple and lightweight indicator that displays the current spread value directly on the main chart window.
It helps traders instantly recognize market liquidity conditions and trading costs without opening additional panels or tools. Features Real-time spread display on the main chart Customizable position and font size Minimal system load and no data buffering Useful for scalping and low-spread strategy monitoring How it works The indicator calculates the diff
FREE

Stabilité de trading garantie grâce aux mathématiques pures
TPR Dashboard Signals PRO est un tableau de bord de signaux quotidiens multi-paires avancé pour MetaTrader 5. Basé sur la régression polynomiale, la modélisation statistique des probabilités et un système de classification des régimes de marché à trois niveaux, cet indicateur élimine les conjectures et l'interprétation subjective des graphiques.
Qu'est-ce qui différencie la version PRO ?
Alors que la version gratuite offre une analy
FREE

Regime Matrix est un indicateur multi-timeframe d’état de marché conçu pour classifier les conditions actuelles du marché sur les timeframes sélectionnés. Il affiche un panneau analytique compact directement sur le graphique et fournit des buffers pour les Expert Advisors via iCustom() . L’indicateur aide les traders à évaluer si le marché est en tendance, en range, en compression, en expansion ou en surextension. Chaque timeframe est calculé indépendamment, ce qui permet de comparer les conditi
FREE

Hammer & Shooting Star — Precise Pattern Detector Detects hammer and shooting star patterns with full control over body size, wicks, ratios, candle color, Bollinger Band filter, and N-candle confirmation. All symbols and timeframes. Full Description Hammer & Shooting Star is a professional candlestick pattern indicator for MetaTrader 5. It detects bullish hammers and shooting stars using a multi-layer filter system that provides precise control over every structural component of the candle — far
FREE
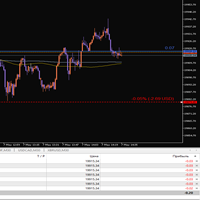
This indicator is designed for visual risk management and monitoring of open positions on the chart. It automatically calculates and displays: The average entry price for all open positions of the current instrument. The total volume of positions. A horizontal Stop Loss line, which can be moved manually. The potential loss if SL is triggered – both as a percentage of the account balance and in the account currency.
FREE
This simple indicator paints with a darker color on the volume bar when the quantity traded is above the average of select number of periods of the volume itself, highlighting the moments when there was a large volume of deals above the average. It is also possible to use a configuration of four colors where the color tone shows a candle volume strength. The indicator defaults to the simple average of 20 periods, but it is possible to change to other types of averages and periods. If you like t
FREE

Anchored VWAP is a lightweight, interactive volume-weighted average price indicator designed for traders who need precision without clutter.
Unlike standard VWAP that resets every session, this tool lets you drop up to five custom anchors directly on any candle. Each anchor calculates VWAP from that exact point forward, complete with standard deviation bands to highlight where price may find support or resistance relative to volume.
Key Features: • Up to 5 simultaneous anchors — compare multi
FREE

*** IMPORTANT NOTE: The indicator dynamically adapts to your chart background. Try switching between Light and Dark themes for the best visual experience. ***
LZ Session Boxes Indicator is a streamlined, automated session time indicator designed to simplify your daily market analysis. It accurately draws the three major trading sessions (London, New York, and Asia) directly on your chart for the current trading day.
Powered by an intelligent Auto-DST (Daylight Saving Time) detection engine, t
FREE

Liquidity Labs Candle Power is a real-time market-analysis indicator for MetaTrader 5 designed to show the strength, direction and condition of the current price move in one compact dashboard.
Instead of requiring several separate indicators and windows, Candle Power brings candle behavior, directional pressure, trend context, momentum, volatility and pattern information together directly on the main chart.
The indicator is designed as a decision-support tool for discretionary traders. It doe
FREE

The "Session Time Vertical Lines" indicator displays vertical lines on the chart that mark the beginning and end of major global trading sessions: Sydney, Tokyo, London, and New York . It is designed to help traders visually identify active market hours, overlaps, and potential high-volume periods directly on the price chart. This tool is especially useful for intraday traders who rely on market session timing to plan entries and exits. Inputs / Settings Parameter Name Description DaysToDraw Num
FREE
Indicateur Momentum avec support multi-timeframe, signaux visuels personnalisables et système d'alertes configurable.
Services de programmation freelance, mises à jour et autres produits TrueTL sont disponibles sur mon profil MQL5 .
Les retours et avis sont très appréciés !
Qu'est-ce que le Momentum ? L'indicateur Momentum mesure la vitesse du changement de prix en comparant le prix actuel au prix d'il y a n périodes. Les valeurs supérieures à 100 indiquent un momentum haussier (prix actuel p
FREE

Market Strike SignalBox Market Strike SignalBox is a clean visual indicator that draws structured trade zones directly on the chart: Entry , Stop Loss , TP1 , and TP2 .
It is designed for traders who want a fast, “at-a-glance” view of potential setups without complicated dashboards. This product is NOT an Expert Advisor and does not open/close trades . It provides visual signals only . What You Get on the Chart When a valid signal is detected, the indicator will display: Entry level Stop Loss (S
FREE

GANN TRIANGLE PRO v4.0 - OPTIMIZATION ANALYSIS REPORT CURRENT VERSION ASSESSMENT (v3.8) Strengths Feature Evaluation Swing Point Detection Clear logic using Left/Right bars Fibonacci/Gann Ratios Properly applied 61.8%, 100%, 161.8% Dashboard Real-time updates with visual indicators Code Structure Clean, maintainable architecture Critical Limitations Issue Impact Win Rate Effect No Trend Filter Signals against major trend -20% to -30% Missing Volume Confirmation False breakouts not filt
FREE
The Multi Strategy Ranges Indicator MT5 is a powerful tool designed to detect and visualize price consolidation zones in the market. This indicator identifies ranges and draws them on the chart, providing clear signals for efficient trading. Key Features Our indicator incorporates three essential strategies for trading within consolidation ranges: Range Breakout Strategy: A classic range breakout strategy. When the price breaks the upper or lower boundary of the range, a buy or sell signal i
FREE

TANIN POLYLINE MT5 is the ultimate drawing assistant for Price Action traders. If you love the flexibility of the Polyline tool on TradingView, this indicator brings that exact experience to your MetaTrader 5 terminal.
Designed by Tanin Coder , this tool allows you to map out market structures, waves, and trends with speed and precision. A professional, fast, and convenient Polyline drawing tool inspired by TradingView. Supports Magnetic Snap, Straight Lines, and Auto Price Labels. RECOMMENDE
FREE
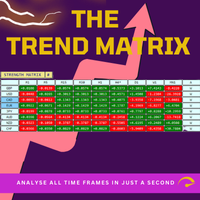
Trend Teller est un outil de tableau de bord puissant et intuitif conçu pour offrir une vue d’ensemble des tendances du marché sur toutes les paires de devises majeures et tous les horizons temporels — de M1 à MN1.
Créé par des traders pour des traders, cet outil élimine les incertitudes de l’analyse des tendances et vous aide à rester aligné avec la direction générale du marché. Beaucoup de débutants ont du mal à identifier la direction du marché — et même les traders expérimentés se trompent p
FREE

============================================================================== DIVERGENCE HUNTER PRO v2.01 Advanced Multi-Oscillator Divergence Detection System ==============================================================================
OVERVIEW
Divergence Hunter Pro is a professional-grade divergence detection indicator that automatically identifies high-probability trading oppor
FREE
The Candle Countdown Timer for MetaTrader 4 (also available for MT5) is a vital indicator designed to help you manage your trading time effectively. It keeps you updated about market open and close times by displaying the remaining time before the current candle closes and a new one forms. This powerful tool enables you to make well-informed trading decisions. Key Features: Asia Range: Comes with an option to extend the range. Broker Time, New York, London Time: Displays the current broker time
FREE

CandleForce Pro: The Ultimate Decision-Support Dashboard for Modern Traders Introduction: Overcoming the Chaos of Modern Markets
In today's hyper-connected financial markets, the modern trader faces a paradox of choice. We are inundated with an endless stream of data, indicators, news, and strategies, all promising to unlock the secrets of profitable trading. This constant influx often leads to "analysis paralysis"—a state of cognitive overload where conflicting signals create confusion, hesit
FREE

VWAP Historical Levels is a practical VWAP indicator for MetaTrader 5 that combines the current VWAP structure with important levels calculated from completed sessions or anchor periods. Its main advantage is the ability to preserve the previous period’s VWAP, Upper Band 1 and Lower Band 1 as horizontal historical levels. This makes it easier to see where price was previously considered balanced and how the current market reacts to those levels. HOW HISTORICAL LEVELS CAN BE USED At the end of ea
FREE

Il s'agit d'une version activement mise à jour, recompilée et enrichie pour les versions actuelles de MT5.
Il est facile de constater qu'un marché suit une tendance. Il est en revanche plus difficile de déterminer, à partir du seul cours, si cette tendance repose toujours sur une réelle conviction ou si elle s'essouffle.
Phoenix Trend Strength Meter combine la force de la tendance, mesurée par l’ADX, et la conviction directionnelle, mesurée par le RSI, en une seule ligne de régime sur votre g
FREE

Candle Timer displays a live countdown timer showing exactly how much time remains before the current candle closes. It updates every 500 milliseconds, giving you a near-real-time readout directly on your chart — no more guessing when the next bar will form. Key Features & Advantages Two flexible display modes Corner Overlay — pins the timer to any corner of your chart screen (top-left, top-right, bottom-left, bottom-right), staying fixed as you scroll or zoom. Ideal for keeping the timer always
FREE

Im Sorry Ai Signal v1.26 – Precision Gold Scalping for MT5 Elevate your trading with Im Sorry Ai Signal , the latest technical indicator from the WinWiFi Robot Series . Specifically engineered for Gold (XAUUSD) scalpers on the MetaTrader 5 platform, this tool simplifies complex market movements into clear, actionable visual signals. Designed with a focus on Price Action within the M5 (5-Minute) timeframe , this indicator helps traders identify high-probability entry points in the fast-paced gol
FREE

Swiss InsideOutsideBar Imortance of Inside- and Outside Bars Inside bars are completely engulfed by its previous bar. The pattern is also known as "harami" (pregnant). Outsidebars engulf the previous bar. Inside bars might mark situations before an outbreak. They are a condensed form of a symmetrical triangle. Symmetrical triangles represent a battle between bulls and bears. There can be an outbreak to either side, mostly the outbreak is in direction of the main trend. The combination of inside
FREE

This MQL5 indicator, often referred to as the Phoenix March or Freedom Orb, is a comprehensive intraday trading tool that combines Session Range analysis with Smart Money Concepts (SMC). It is designed to automate the detection of key institutional levels and trend shifts directly on the chart. Core Indicator Features Session & ORB Zones: Automatically identifies the "Open Range" based on a user-defined start time (e.g., 03:00) and duration (e.g., 15 minutes). It plots the highest and lowest pr
FREE

Standard RSI uses a fixed smoothing factor. Every bar gets the same weight whether the market is trending cleanly or chopping sideways. That is why most RSI signals fail during consolidation. Mystical RSI measures how chaotic price action is on every bar using the Fractal Dimension Index and dynamically adjusts its smoothing in real time. When the market trends, it reacts fast. When the market chops, it slows down and filters out noise. No manual adjustment needed. How It Works The indicator cal
FREE
Half-Life HoldTime Spectral Compact Heatmap The Half-Life HoldTime Spectral Compact Heatmap indicator for MetaTrader 5 provides advanced analysis of suggested hold times for trades using AR(1) half-life estimation, spectral cycle fusion, and a confidence heatmap. This tool helps traders optimize their position management by visualizing the most probable hold durations and market regimes. Key Features: AR(1) Half-Life Estimation: Calculates the suggested hold time for a position using autoregres
FREE

The Jackson Auto Candlestick Pattern . It a powerful price action tool which auto detect and alert a hided powerful candlestick patterns . It came with few different chart skins. You can use this indicator alone to make profit, but it powerful when you combine it with trendlines, You can download The Jackson Auto Trendlines for free Link : UCRW695l9Wgg2ucnnf5DL5Vw List of Candlestick Pattern it detect 1. Bullish & Bearish Engulfing's 2. Top and Bottom Tweezer 3. Bullish and Bearish Harams 4.
FREE

FVG Super Trend FVG Super Trend is an advanced Smart Money Concepts (SMC) indicator designed to identify high-probability Fair Value Gaps (FVGs) with trend confirmation and momentum filtering. The indicator combines: Fair Value Gap (FVG) detection MACD momentum confirmation EMA trend filtering ADX angle strength analysis Multi-Timeframe (HTF) candle confirmation Intelligent FVG classification system Real-time alerts and notifications Unlike ordinary FVG indicators, this tool filters weak market
FREE

PINBAR SCANNER PRO with TREND and RSI + CCI OSCILLATORS filter This indicator has been designed to automatically and constantly scan entire market to find high probability pinbar formations, so you can just wait for the perfect trading opportunity come to you automatically.
PINBAR is the strongest candle reversal pattern known in technical analysis. It shows excellent areas to determine potential entries and exits with opportunity to use excellent risk and reward ratios. It includes an RSI and
FREE

The TrendOscillator Indicator is an upgraded version of the traditional Stochastic Oscillator. It comprises two lines: %K and %D. The %K line represents the current market position. In contrast, the %D line is a moving average of the %K line used to generate signals and identify potential entry or exit points. The good thing is the indicator works on all timeframes like the traditional Stochastic. However, to avoid any false signals, applying the indicator on longer timeframes is better
FREE

Trend Multi-Timeframe Dashboard vous indique si le marche monte ou descend sur quatre unites de temps a la fois, a l'aide d'une moyenne mobile exponentielle rapide et d'une lente sur chaque unite. Au lieu de deviner la direction ou de changer de graphique, vous voyez l'ensemble dans un seul panneau. Par defaut il lit les unites M15, H1, H4 et D1, et les reglages sont entierement configurables. Chaque unite apparait en vert quand la tendance est haussiere, en rouge quand elle est baissiere et en
FREE
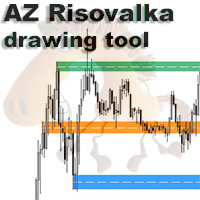
AZ Risovalka levels drawing tool An indicator for simplifying the drawing of levels. Select the indicator mode for the body, shadow, or the whole candle in the settings. Click the 'Draw' button on the drawing panel to create a level, then click on the body or shadow of the candle and select the level color in the color menu that appears. The 'Delete' button to delete level you select, 'Color' to select the color of an already created level. You can set your own colors in the indicator menu (6 co
FREE

Clock GMT Live a tout ce dont vous avez besoin pour en savoir plus sur notre courtier, plusieurs fois vous vous serez demandé sur quel gmt je suis ou sur quel gmt mon courtier travaille, eh bien avec cet outil vous pourrez savoir en temps réel à la fois le GMT décalage horaire du broker et de votre heure locale, vous connaîtrez également en permanence le ping du broker Juste en le plaçant à un moment de la journée, vous pouvez obtenir les informations
Le prix augmente pour chaque acquisition,
FREE

Quantora Liquidity Zones MT5 is a MetaTrader 5 indicator that displays selected historical price levels and detected Equal High or Equal Low areas on the chart. The indicator plots the previous day, week and month High and Low prices. It also analyzes confirmed price points to identify potential Equal High and Equal Low liquidity zones. Displayed Levels Previous Day High and Low Previous Week High and Low Previous Month High and Low Detected Equal High levels Detected Equal Low levels Optional s
FREE

ICT - FVG • iFVG • BPR Smart Zones - Tjmas is a multi-timeframe institutional PD Array engine for MetaTrader 5. It simultaneously tracks Fair Value Gaps (FVG), Inversion Fair Value Gaps (iFVG), and Balanced Price Ranges (BPR) across M1, M5, M15, M30, H1, H4, and D1 while keeping your candlesticks 100% clean and unobstructed. Key Features: 3-in-1 PD Array Detection: Automatically detects Bullish/Bearish Fair Value Gaps (FVG), Inversion FVGs (iFVG when price displaces through a prior FVG), and ove
FREE
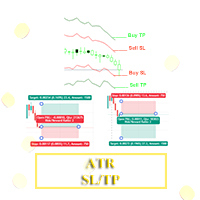
Bonjour à tous les traders ! J'ai développé un outil pour ceux qui utilisent l'indicateur Average True Range (ATR) pour déterminer leurs niveaux de Stop Loss et de Take Profit. Grâce à cet indicateur, vous pouvez facilement paramétrer le Take Profit et le Stop Loss avec le multiplicateur de votre choix.
Pour l'utiliser, veuillez ajuster la période de l'ATR à votre style de trading, puis les multiplicateurs de Stop Loss et de Take Profit en conséquence.
Bon trading !
Bonne chance et excellent
FREE

Ritz Trinity Scanner – Reversal & RSI Sentiment Ritz Trinity Scanner is a clean and focused reversal detection indicator powered by RSI sentiment analysis and short-term trend validation. The indicator scans price action to identify early bullish and bearish reversal points , filtering signals with RSI overbought/oversold zones and recent market sentiment. Visual arrows highlight potential reversals directly on the chart, while optional alerts, push notifications, and emails keep traders informe
FREE
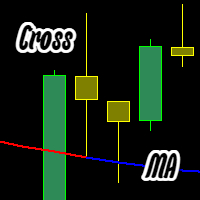
L’indicateur affiche une Moyenne Mobile (MA) bicolore : Bleu — le prix d’ouverture et de clôture de la bougie précédente est au-dessus de la ligne MA. Rouge — le prix d’ouverture et de clôture de la bougie précédente est en dessous de la ligne MA. Paramètres personnalisables : Type de MA (Simple, Exponentielle, Lissée, Linéaire); Période de la MA; Alerte lors du changement de couleur de la MA. Si quelque chose ne va pas, dites-le-nous pour corriger ! bar cross Moving cross candle cross Moving
FREE
NewTwst https://backoffice.aurum.foundation/u/DHXP1U
The indicator is based on indicators built-in standard indicators, the indicator take into account the current indicators 30 indicators and give a signal to buy or sell, the General trend of all trends of other indicators. In the input parameters, you can configure special parameters for each indicator. the indicator is executed in the form of an oscillator and shows the General trend and the preponderance of all indicators in one or the othe
FREE

The Strategies of the World's Most Successful Traders in a Single Indicator Professional Alpha Traders Strategies MT5 is an advanced indicator that compiles the most successful and proven trading methodologies from five legendary traders. This indicator represents decades of experience condensed into a professional tool for real-time opportunity detection. Each strategy has been meticulously programmed following the original rules established by their creators, respecting the trading philosophy
FREE

Cet indicateur est la version convertie pour MetaTrader 5 de l'indicateur TradingView "ATR Based Trendlines - JD" créé par Duyck. Fonctionnement :
L'indicateur trace automatiquement et continuellement des lignes de tendance basées non seulement sur le prix, mais aussi sur la volatilité mesurée par l'ATR. Ainsi, l'angle des lignes de tendance est déterminé par (un pourcentage de) l'ATR. L'angle des lignes suit les variations de prix, dictées par la valeur ATR au moment où le point pivot est détec
FREE

Session Highlighter and Killzones dessine des boites colorees et nettes pour les sessions de trading d'Asie, de Londres et de New York, ainsi que des fenetres de killzone de Londres et de New York en option. L'heure de la journee represente une grande partie du contexte sur le forex, et voir la plage de chaque session sur le graphique explique beaucoup de ce que fait le prix. Chaque boite de session marque le plus haut et le plus bas de cette session sur les derniers jours, et les boites se plac
FREE

This indicator automatically draws key weekly and monthly price levels on your chart. All lines end at Sunday 23:59 of the current week. Levels and Default Settings Level Color Style Width Start Point Friday High Red Solid 2 Exact high candle Friday Low Red Solid 2 Exact low candle Friday Close Green Solid 2 23:00 (adjustable) Opening Range High Blue Solid 2 Mon-Tue high candle Opening Range Low Blue Solid 2 Mon-Tue low candle Previous Week High Light Gray DashDotDot 1 Exact high candle Previou
FREE

L'outil KS Fibonacci est un indicateur personnalisé pour MetaTrader 5, conçu pour détecter automatiquement le segment de structure de marché actuel selon l'approche « Smart Money Concept » (SMC) et pour y tracer des niveaux de Fibonacci en temps réel.
Objectif principal
Il aide les traders à visualiser les niveaux de retracement et d'extension de Fibonacci basés sur le mouvement de prix significatif le plus récent (segment de structure), une approche courante dans les méthodologies de trading
FREE
Introducing the Aroon Indicator - Your Ultimate Trend Analysis Tool!
Are you looking to take your trading game to the next level? Want to identify lucrative entry and exit points in the financial markets with ease? Look no further! The Aroon Indicator is here to revolutionize your trading strategy and help you make informed decisions like never before.
Developed by the brilliant mind of Tushar Chande, the Aroon Indicator is a powerful technical analysis tool designed to measure the strength a
FREE

ACTION CHAIN Multi-Engine Confluence & Order Flow Indicator Action Chain is a quantitative signal indicator for MetaTrader 5 built on market structure, volumetric calculations, and order flow mechanics. Rather than relying on a single lagging indicator, Action Chain integrates 6 independent analytical modules into a weighted mathematical confluence matrix. A signal is plotted only when the cumulative weight of active modules meets or exceeds the user-defined threshold. Key Technical Specificatio
FREE

MacD Custom Indicator MTF Plus is a professional MetaTrader 5 port of the original " CM_MacD_Ult_MTF " indicator created by ChrisMoody for TradingView . This version was developed by code4trading for Free provide the MT5 community with high-quality, free access to this proven methodology. Original Concept: ChrisMoody (TradingView) MT5 Development: code4trading Version: 1.0 The Moving Average Convergence Divergence (MACD) is a cornerstone of technical analysis, functioning as a trend-following m
FREE
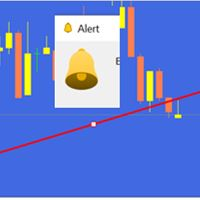
Get ALERTS for break of your TRENDLINES, SUPPORT LINES, RESISTANCE LINE, ANY LINE!!
1. Draw a line on the chart (Trend, support, resistance, whatever you like) and give it a name (e.g. MY EURUSD line) 2. Load the Indicator and input the Line Name the same name in Indicator INPUT so system knows the name of your line (= MY EURUSD line) 3. Get Alerts when Price breaks the line and closes Works on All Time frames and charts LEAVE A COMMENT AND IF THERE IS ENOUGH INTEREST I WILL WRITE AN EA WHICH W
FREE
A Renko Tick chart based on continuously adjusting percentage.
Live Renko bricks formed by tick data
Adjustable brick width expert for indicator attached Scalp with a Renko, get weird.
The settings can and will break the script if you turn them up too high. Turning off outline mode will not look as nice, but can potentially allow for a larger number of bricks.
FREE

Le Grand Avantage : Protégez votre compte en un clic. Plus besoin de calculer vos lots à la main ni de deviner combien vous risquez de perdre. Déplacez simplement les lignes sur votre graphique et le panneau vous indique le lot exact pour garder votre risque sous contrôle. (Déplacez la ligne Grise) Comment ça marche ? (En 3 étapes) : Configurez votre risque : Dans les paramètres, choisissez si vous souhaitez risquer un pourcentage de votre compte (ex : 1 %) ou un montant fixe (ex : 50 $). Gliss
FREE

ATS Daily Performance shows your profit and loss day by day for the last 30 days, as bars and numbers on a compact dashboard on your chart. Open it and see at a glance which days made money, which lost, and how your month is going.
WHAT YOU SEE - One bar per day: green for a winning day, red for a losing one - Net result of the last 30 days, today's result and the profit or loss of the trades still open - Win rate, winning days, profit factor, best day and worst day - The last 7 days listed wit
FREE
Analyse approfondie de l’indicateur « ICONIC TRENDLINE SIGNAL » Le code MQL5 fourni décrit un indicateur de suivi de tendance avancé et multifacette pour MetaTrader 5. Il va au-delà des simples croisements de lignes en intégrant force de tendance, volatilité, analyse multi-unités de temps et un système de score quantitatif au sein d’un outil complet d’aide à la décision. 1. Stratégie et logique centrales La stratégie de l’indicateur s’appuie sur un cadre logique robuste, à plusieurs couches, pou
FREE

How to Read EOS AI EOS AI is designed to make its current market assessment easy to understand from one compact dashboard. The panel gives you three main pieces of information:
BUY Probability – the neural model's current bullish assessment SELL Probability – the neural model's current bearish assessment Signal – BUY, SELL or WAIT after the required confirmation rules are applied
The probabilities provide context, while the final signal applies the additional confirmation logic. This means the
FREE

Le HiLo Ladder est une réinterprétation de l’indicateur classique HiLo , largement utilisé par les traders pour identifier les tendances et les points de retournement potentiels du marché. Contrairement à la version traditionnelle, le HiLo Ladder se présente sous un format en escalier — les populaires « marches » — rendant la lecture des mouvements de prix beaucoup plus claire et intuitive. Principaux avantages : Visualisation simplifiée des phases haussières (vert) et baissières (rouge). Ana
FREE

Full Description Read Gold’s Complete Picture in One Single Panel Stop switching between M5, M15, H1, H4, and D1 charts. XAU Confluence Matrix Free brings multi-timeframe analysis straight to your main chart in a clean, real-time table. Powered by the quantitative XAU_Engine , this indicator scans 5 timeframes simultaneously on closed candles to give you an accurate directional bias before entering any trade. What You See on Your Screen 5 Timeframes at a Glance: Automatically displays your curre
FREE
Linear Regression Channel (LRC) Indicator – Overview The Linear Regression Channel (LRC) indicator is a professional tool designed to display dynamic price channels around a regression trendline. It automatically adapts to market conditions, helping traders visualize price movement with clarity. Main Features : Regression-based central line with upper/lower channel boundaries. Fully customizable colors, styles, and levels. Optional labels and forward extensions for better chart visualizati
FREE
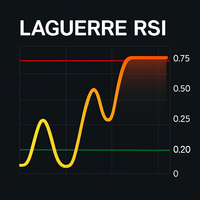
Le Laguerre RSI : Un Oscillateur Avancé pour l'Analyse de Marché Le Laguerre RSI est un oscillateur avancé basé sur des filtres numériques, développé par John Ehlers . Cet indicateur lisse les fluctuations de prix en utilisant une technique appelée filtre de Laguerre , ce qui permet de détecter avec plus de précision les zones de surachat et de survente , tout en réduisant le bruit du marché. Le Laguerre RSI oscille entre 0 et 1 , et ses niveaux standard sont : Surachat : au-dessus de 0.75 Surve
FREE

Indicator offers flexible fractal configuration, including the number of candles to the left and right, and the ability to filter based on sorted high/low values.
Key Features • Detects upward or downward fractals • Configurable number of candles on both sides • Optional sorting checks for high/low values • Arrow drawing on the chart
Parameters
1. Main (B) • Fractal Type (InpFractalType): Up / Down • Arrow Code (InpArrowCode): Unicode symbol for arrow • Arrow Color (InpArrowColor): Color for
FREE

Explosion Signal Indicator analyzes the market for sharp changes in volatility and volume that often precede significant price movements. The indicator uses the ratio of short-term and long-term ATR to assess current volatility relative to the average level. Simultaneously, it monitors current volume compared to the average over a specified period.
When the volatility or volume exceeds the defined thresholds, the indicator determines the direction of movement through momentum calculation — the
FREE

Market Sessionsync** is a cutting-edge trading session indicator designed to enhance your trading experience by visually breaking down the market's daily rhythm. With a compact window overlaid on your chart, this indicator provides a split-second understanding of the current trading session through: Basic setup: Set Difference between your local time and your broker time , set DST(Daylight Saving Time) ON or OFF , set timescale sync you want to use (Local, Broker, CET) - A vertical time marker
FREE

Candle color RSI (Relative Strength Index) indicators change candlestick colors on the price chart to visually show RSI conditions like overbought/oversold levels or bullish/bearish momentum, using colors like red for overbought/bearish and green for oversold/bullish, helping traders spot reversals or strength at a glance without looking at the separate RSI pane. These custom indicators often color candles red above 70 (overbought), green below 30 (oversold), and keep default colors in between
FREE

Bollinger Bands Stop Indicator holds significant importance for traders navigating the complex world of financial markets. Its relevance lies in several key aspects. Firstly, it aids in trend identification. By analyzing price movements relative to the Bollinger Bands, traders can discern whether the market is in an uptrend, downtrend, or ranging phase. Secondly, the indicator provides valuable insights into market volatility. Wider bands indicate higher volatility, while narrower bands suggest
FREE

An analogue of the Stochastic oscillator based on algorithms of singular spectrum analysis (SSA) SSA is an effective method to handle non-stationary time series with unknown internal structure. It is used for determining the main components (trend, seasonal and wave fluctuations), smoothing and noise reduction. The method allows finding previously unknown series periods and make forecasts on the basis of the detected periodic patterns. Indicator signals are identical to signals of the original i
FREE

SwingStrength Pro – Swing High & Low Strength Scoring for MT5 Not every swing high or low is equal. Some are formed by a sharp rejection on heavy volume and hold for weeks; others are minor pauses that break at the first retest. SwingStrength Pro finds every swing high and swing low that price has not yet closed through, scores each one from 0 to 100, and shows you the strongest resistance and support directly on your chart. How it works Finds swings. The indicator scans the chosen timeframe for
FREE

PositionMap Pro — Account Overview Panel for MT5 A real-time panel that groups all open positions by symbol and shows Buy lots, Sell lots and net profit/loss directly on your chart — the whole account at a glance. Instead of counting lots symbol by symbol in the Terminal tab, PositionMap Pro groups everything automatically. You instantly see how much exposure you have on each symbol, split by direction. Panel example Symbol Buy Lot Sell Lot Net P/L EURUSD 0.50 — +12.30 XAUUSD — 1.00 −45.00 GBPUS
FREE

Market Strike v.1 is a smart intraday trading indicator designed to help traders read price reaction zones with more clarity. It combines M1 and M5 confluence, side volume analysis, clear buy/sell labels, and intraday target guidance to improve trade timing and reduce late entries. This indicator is built for traders who want to identify fresh highs and lows, spot stronger reversal zones, and confirm whether a signal is regular or supported by higher intraday confluence. When M1 and M5 align at
FREE
Scalping Timer – Précision en Temps Réel pour les Scalpers Exigeants Le Scalping Timer est un indicateur visuel compact conçu spécifiquement pour les scalpers et les day traders qui dépendent d'un timing parfait et d'un coût de transaction minimal . Ce tableau de bord en temps réel affiche deux métriques essentielles pour le scalping : Le compte à rebours exact du temps restant avant la clôture de la bougie définie sur le graphique. La visualisation immédiate du spread actuel du symbole. Avec ce
FREE
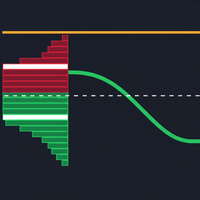
The "Volume Range Profile with Fair Value" (VRPFV) indicator is a powerful volume analysis tool designed to help traders better understand market structure and identify key price areas where significant institutional activity occurs. Instead of just looking at volume on individual candlesticks, VRPFV analyzes the distribution of volume by price level within a specific time range, providing deep insights into the "footprint" of smart money. VRPFV consists of the following core components: Upper &
FREE
Découvrez comment acheter un robot de trading sur le MetaTrader Market, le magasin d'applications de la plateforme MetaTrader.
e système de paiement de MQL5.community prend en charge les transactions via PayPal, les cartes bancaires et les systèmes de paiement populaires. Nous vous recommandons vivement de tester le robot de trading avant de l'acheter, pour une meilleure expérience client.

Vous manquez des opportunités de trading :
- Applications de trading gratuites
- Plus de 8 000 signaux à copier
- Actualités économiques pour explorer les marchés financiers
Inscription
Se connecter
Vous acceptez la politique du site Web et les conditions d'utilisation
Si vous n'avez pas de compte, veuillez vous inscrire