Triangle Pattern Indicator MT4
- 指标
-
Mihails Babuskins
 Senior developer for financial markets.
Contact me: Forex.terminology@outlook.com
🔵 Telegram group link: https://t.me/CommunityAndChat - 版本: 1.2
- 更新: 18 一月 2025
- 激活: 20
- Contact me after payment to send you the User-Manual PDF File.
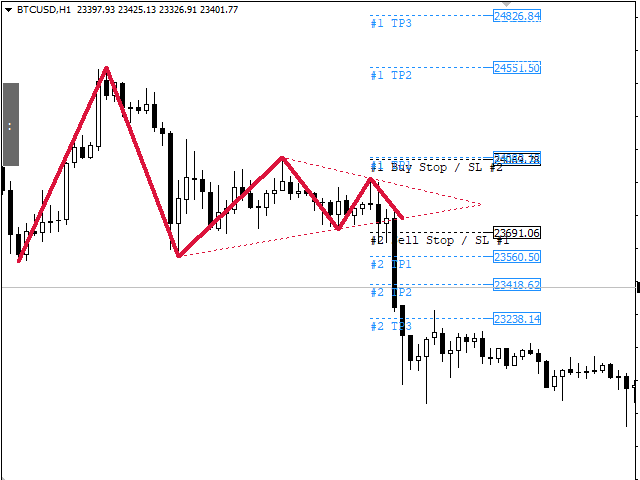
Triangle Pattern
Sometimes the price cannot make higher highs or lower lows and it moves in a converging price range and waves are shorter than before until the movement creates a geometric shape of a symmetrical triangle, which indicates It is maybe the end of the trend.
The triangle pattern is a well-known in forex and the trading plan and strategy of many traders is based on it.
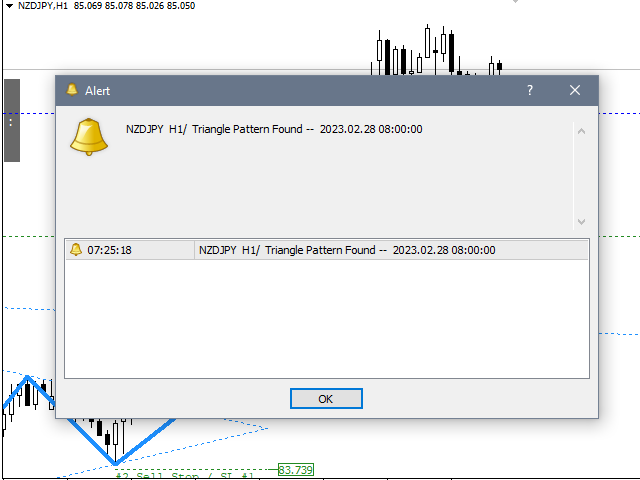
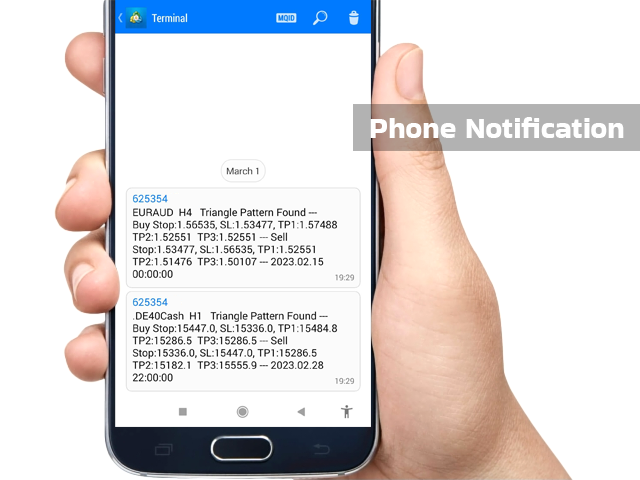
The Triangle Pattern Scanner Indicator
It is usually difficult for a trader to recognize classic patterns on a chart, as well as searching for dozens of charts and time frames will take time, and there is also a possibility of a trader's mistake in calculations. This indicator can automatically search all charts and time frames to find possible patterns in seconds. Searching, Fibonacci calculations, and pattern recognition are completely the responsibility of the indicator; All you have to do is "press the scan button".
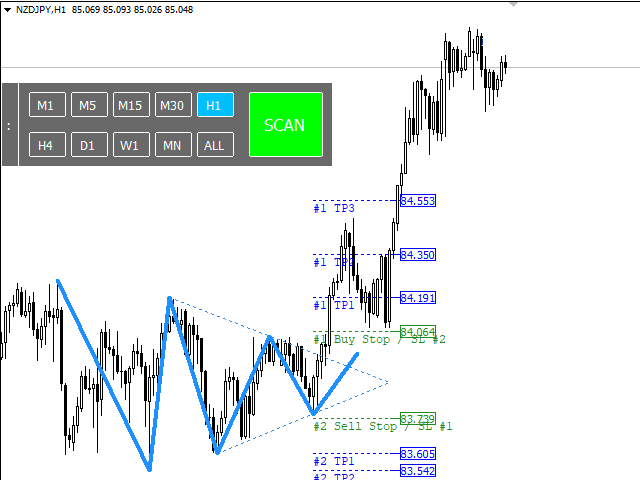
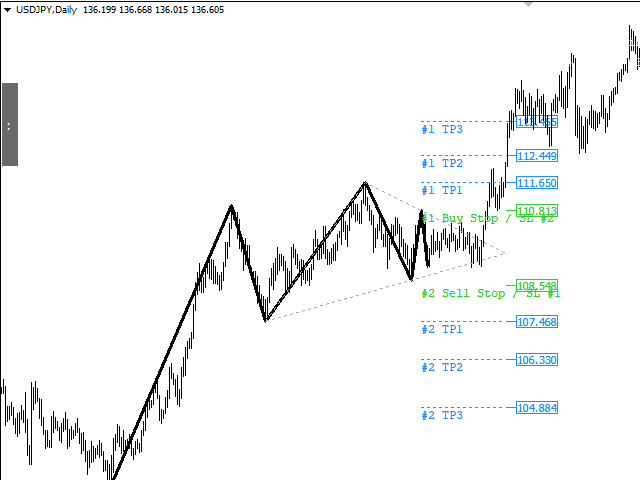
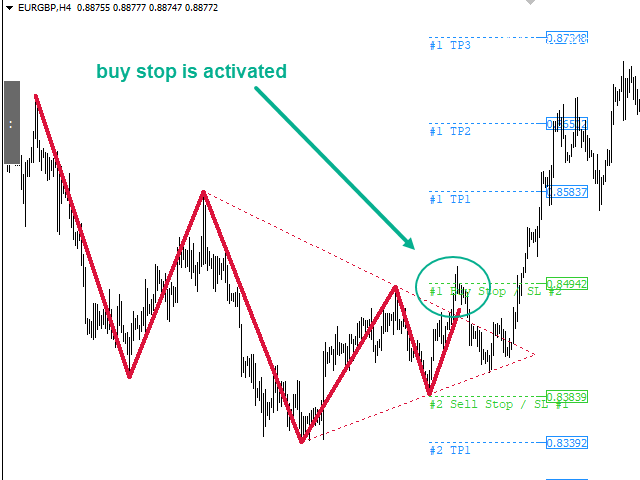
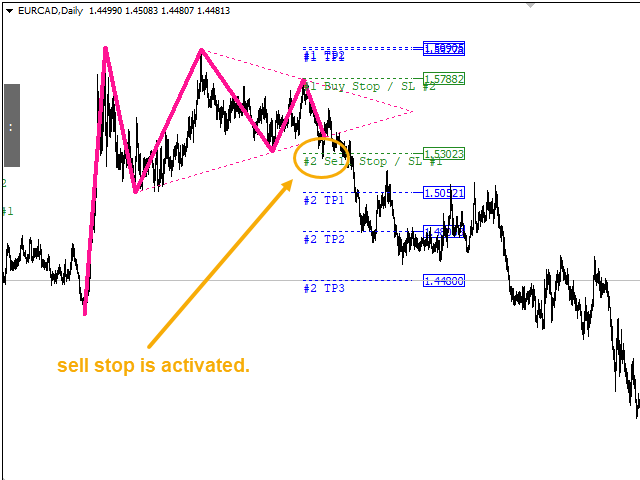
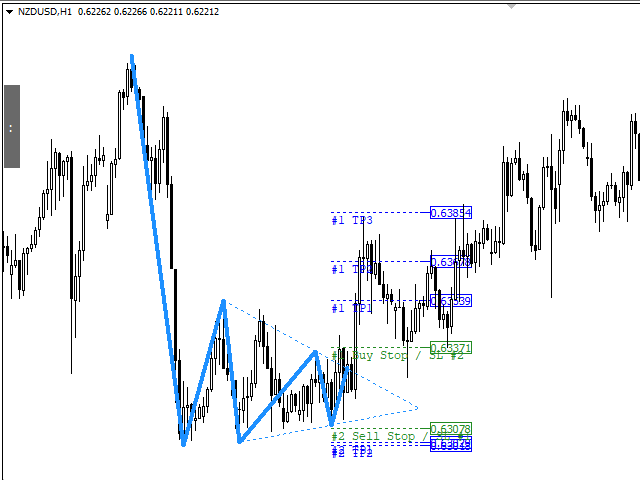
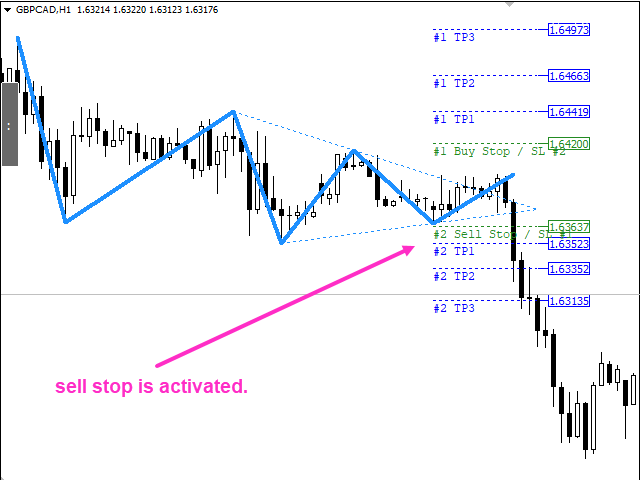
How To Trade?
All parameters necessary to enter the trade are calculated, such as entry point, stop-loss, and take-profit.
By observing the signal and deciding to trade, we enter the trade with the "set and forget" method.


Muy muy buen indicador. Funciona de maravilla con mi estrategia sin mecnioar lo importantes que son los riángulos en rupturas para desarrollo de ondas de Elliot