 MetaTrader 5
 专家
 指标
 程序库
 实用工具
 窗口小部件
 规则
适用于MetaTrader 4的免费EA交易和指标 - 6
 EA交易自动执行市场交易,而指标可使您更准确地分析报价并预测价格行为。
通过这些应用程序,您将能够更明智地在MetaTrader 4执行交易,抓住更多的交易机会。

The VWAP Level indicator is a technical analysis tool that calculates the weighted average price for the traded volumes of a specific asset. The VWAP provides traders and investors with the average price of an asset over a specific time frame.
It is commonly used by investors to compare data on "passive" trading operations, such as pension funds and mutual funds, but also by traders who want to check if an asset has been bought or sold at a good market price.
To calculate the VWAP level we us
FREE

Trend Pulse Trader is a simple trend-following Expert Advisor for MetaTrader 4.
It trades in the direction of the moving average trend, confirms entries with RSI, and manages every trade with volatility-based Stop Loss and Take Profit.
HOW IT WORKS
- Trend direction: Fast MA compared with Slow MA on the last closed bar
- Confirmation: RSI must be above (buy) or below (sell) a configurable level
- Stop Loss and Take Profit are calculated from ATR, so they adapt to market volatility
- Optional AT
FREE
通过 Nadaraya Watson Envelope MT4 解锁您的交易策略潜力,这是一种创新指标,旨在为交易者提供精确的趋势分析和动态支撑与阻力水平。非常适合 forex、商品和加密货币交易者,这个工具增强了决策能力和识别市场反转及趋势延续的准确性。 Nadaraya Watson Envelope MT4 的突出之处在于利用先进的高斯核平滑技术创建自适应包络带,以响应市场波动。这使得交易者能够自信地捕捉关键价格波动,无论是快速获利的剥头皮交易,还是长时间持有的仓位。 MQL 产品安装指南 | 在 MT4 上更新已购买的 MQL 产品 | 常见故障排除指南 | 指标设置 / 指南 主要特点 缓冲区集成:将指标值暴露为可访问的缓冲区,用于基于信号的自动交易,使 Expert Advisor 能够有效利用数据。 快速且可回测:基于 MetaTrader 的原生 OnCalculate() 引擎进行快速计算,确保与策略测试器兼容以进行历史分析。 弹出警报:在信号事件上触发 MetaTrader 警报弹出窗口,确保您不会错过任何交易机会。 推送通知:实时推送通知直接发送到您的 MetaT
FREE
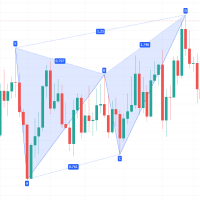
Description: This indicator draw ZigZag Line in multiple time frame also search for Harmonic patterns before completion of the pattern.
Features: Five instances of ZigZag indicators can be configured to any desired timeframe and inputs. Draw Harmonic pattern before pattern completion. Display Fibonacci retracement ratios. Configurable Fibonacci retracement ratios. Draw AB=CD based on Fibonacci retracement you define. You can define margin of error allowed in Harmonic or Fibonacci calculations
FREE

VEXOR — 适用于 MetaTrader 5 的高级交易面板与风险管理工具 使用 VEXOR 掌控每一笔交易,这是一款专为重视精准、速度和更佳交易体验的交易者设计的现代化 MetaTrader 5(MT5)交易面板。通过直观的图形界面下达市价和挂单、计算仓位大小、管理风险,并设置止损和止盈水平。 MT5 Version 与传统交易面板僵硬的布局和过时的界面不同,VEXOR 将时尚的深色设计、交互式控制、实时价格信息、动态风险计算和直接图表交互整合到一个精简的工作空间中。 VEXOR 在 MetaTrader 5 中是什么? VEXOR 是一款先进的 MT5 交易面板,旨在简化手动交易并使订单配置更加直观。直接从图表上的单一界面管理手数、订单类型、风险设置、入场价、止损和止盈。 通过交互式控制和可视化订单验证,VEXOR 帮助您更高效地准备交易,同时将关键交易信息保持在触手可及的范围内。 VEXOR MT5 交易面板的核心功能 1. 现代深色界面 VEXOR 采用精心设计的深色用户界面,为传统 MetaTrader 交易面板提供现代化替代方案。 现代深色主题图形界面。 带悬停效果的
FREE
New version 8.00 is available.
In this version, I tried to take into account the wishes of the user. Each of you can also take part in the improvement of this advisor. In the default settings, the adviser opens trades when the extremum point is broken standard indicator Zigzag. When the upper point of the zigzag extremum is broken, it opens a buy deal, and when the lower point of the zigzag extremum is broken, it opens a sell deal.
In addition to the standard ZigZag indicator, which
FREE

OVERVIEW
Liquidity Sweep Hunter identifies liquidity highs and lows across three different lookback periods and keeps them active until they are mitigated. This creates a persistent view of where resting liquidity has formed instead of only showing the latest swing points.
The indicator also displays a heatmap that highlights the relative strength of active liquidity levels and generates reversal signals after price sweeps multiple visible liquidity bands before reclaiming them. Optional tr
FREE

SWEEP PROTOCOL Essentials — 在市场触及前看见流动性
在寻找信号之前,你需要知道往哪里看。
SWEEP PROTOCOL Essentials 持续为你绘制机构瞄准的流动性水平,并在价格触及它们时立即通知你。
前一日高/低点、区间的 50%、午夜开盘价、亚洲 / 伦敦 / 纽约时段的完整区间:这些是市场不断重访的区域。Essentials 自动在你的图表上显示它们,并在恰当时刻通知你,无需你持续盯着屏幕。
核心功能
- 自动流动性水平:前一日/周/月的高低点、区间的 50%、午夜开盘价,自行绘制和更新。
- 时段区间:亚洲、伦敦、纽约持续显示,按时段颜色编码。
- 触碰警报:一旦达到关键水平即通知(弹窗和/或推送),你无需一直守在屏幕前。
- 迷你仪表盘:市场背景一目了然(活跃时段、当日水平)直接显示在图表上。
- 轻量且不干扰:对平台流畅性零影响,无任何数据外传。
- 通用性:所有品种、所有时间框架,指数、外汇、金属、加密货币 CFD。
工作原理
市场在结构上会回归到有限数量的水平:那些集中最多挂单的水平。SWEEP PROTOCOL Esse
FREE

FREE Heiken Ashi Smoothed indicator is fully adjustable, easy to use and comes with possibility to access the indicator via iCustom function so you can use it in your own trading software. Indicator can also pop up alerts when signal changes or send push notifications. For Metatrader 5 version click here: https://www.mql5.com/en/market/product/70825 For detailed information click: >>HERE<< Features
Easy to use Accessible via iCustom Fully adjustable Alerts and Push notifications Possib
FREE

Fair Value Gap Finder detects fair value gaps and generates a signal when price returns to one. Set the minimum and maximum fvg size, customize the colors, style, and length, then let the indicator highlight them for you.
Key Features: Automatic FVG highlights - The indicator detects all fair value gaps that fit your criteria and marks them on the chart.
Entry Signal - A signal is created whenever price retests a fair value gap.
Notification - Alerts notify you when a fair value gap
FREE

RelicusRoad Daily Pivots 是适用于 MetaTrader 4 和 MetaTrader 5 的日内枢轴价位指标,将前一日区间划分为斐波那契价位,并向上下两侧延伸,范围从负 100% 到正 200%。 指标不采用经典的地板枢轴公式,而是把前一个已完成的区间当作一把刻度尺,最低价为 0%,最高价为 100%。图表右侧以紧凑的彩色标记打印出十九个价位,因此今日行情的大小可以直接读作昨日区间的分数或倍数。 工作原理 指标取前一个已完成参考周期的最高价与最低价,并在该区间的每个比例处放置一个价位:价位 = 最低价 + 比例 x(最高价 − 最低价)。周末的 K 线会被跳过,因此周一的参考是上一个交易日。参考周期由图表周期决定。 Inside set, gray:0%、23.6%、38.2%、50.0%、61.8%、78.6% 与 100%。 Above set, green:+123.6%、+138.2%、+150.0%、+161.8%、+178.6% 与 +200%。 Below set, red:-23.6%、-38.2%、-50.0%、-61.8%、-78.6% 与
FREE

Aurum Trend Scout — Aurum Trend Engine 免费LITE版 Aurum Trend Scout 是 Aurum Trend Engine 智能交易系统的 免费版本 。在H1时间框架上交易黄金(XAUUSD),使用基于Parabolic SAR + 布林带宽度比率的趋势跟踪策略,以BUYSTOP订单在日最高价突破时入场。 此LITE版本包含完整的策略逻辑和基于ATR的止损。使用固定手数,不包含FULL版本中的动态资金管理。 验证性能(真实数据,XAUUSD H1,2014-2025) 点差 20 点: 盈利因子 1.32 | 胜率 63.65% | 最大回撤 2.22% | 净利润 $11,363 | 1,004 笔 点差 30 点: 盈利因子 1.25 | 胜率 62.60% | 最大回撤 2.40% | 净利润 $9,378 | 1,016 笔 LITE版功能 完整策略逻辑(与FULL版相同) 基于ATR的止损 仅做多 — 无马丁格尔,无网格 11年超过1,000笔交易 LITE版限制 仅固定手数(无动态资金管理) 无追踪止损 升级到 Aurum T
FREE
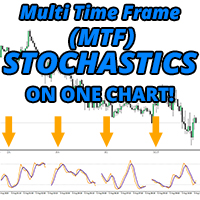
最后! MT4的随机指标,可在一张图表上显示多个时间范围!立即在4个不同的时间范围内查看主线和信号线的实际位置,以帮助您做出有根据的交易决策。
一个真正的MTF随机指标,适合需要在多个时间范围内直观地看到指标告诉他们的交易者,没有向上或向下的箭头或显示的数字。 在时间范围之间不再轻拂即可查看其他随机指标的位置!留在您最喜欢的时间范围内,并获得所有内容的概述!
不用再怀疑其他随机指标上的向上或向下箭头是主线还是信号线,或者它真正指向的角度是!
不再有看起来不正确的MTF随机指标,因为它们被拉长或不准确,占用了宝贵的图表空间!
从您的交易图表中查看是否在所有时间范围内都发生了交叉!
特征
从M1到每月选择您喜欢的时间范围(总共最多4个) 并排显示的每个随机变量的最新部分 根据MT4随附的库存指示器完全可自定义的颜色,级别和参数 设置警报会告诉您所选的所有时间范围都超买或超卖的时间 集成的弹出,推送和电子邮件警报 与图表成比例,因此每个随机占据屏幕上可用空间的1/4 选择显示2个,3个或4个随机数,然后手动设置每个占用的宽度。 放大和缩小主图表,以与您偏好的市场观点保持一致 为
FREE

一个会忽略区间中央所有交叉的振荡指标。Wave Trend Oscillator MTF只在交叉发生于市场确实到达过的区域内部时才发布该交叉,按该区域的深度为其评级,在快线上寻找背离并可以将其画在您实际交易的价格图表上,而且它可以在您观察自己所在周期的同时,在更高的周期上完成这一切计算。免费,没有试用,没有锁定的功能。 快线衡量的是典型价格相对于其近期平均偏差,偏离其自身平滑中心的程度,在它旁边绘制的是这条快线更慢的一条均线。发布的内容有三项:交叉、它发生所在区域的评级,以及在快线上发现的背离。 交叉、评级与背离 只有在慢线处于超卖水平之下时,买入交叉才计数;只有在慢线处于超买水平之上时,卖出交叉才计数。其余情况一律忽略。 信号发生在已激活区域时获得评级一,若慢线也到达了更深的水平则获得评级二。评级描述的是市场进入该区域的深度,而不是这笔交易成功的概率。 背离是通过比较快线上的枢轴点与价格上的枢轴点找到的。看涨和看跌的分歧会被标记并用一条线连接起来。为了让您在实际交易的地方看到它,同一背离也可以直接画在价格图表本身上,位于两个价格枢轴点之间。 两条线之间的动量柱状图会根据当前柱相对于前
FREE

产品简介 Pattern Recognition Master System 是一款专为 MT4 和 MT5 双平台设计的主图经典 K 线形态自动识别指标。它在主图上自动侦测并标注十一类经典反转与中继形态,涵盖双顶双底、头肩顶底、锤子吊颈、吞没、十字星以及晨星暮星,并为每类形态配备独立的冷却过滤周期,从源头抑制重复信号。该指标视觉紧凑、信号分层清晰,并支持按形态独立开关提醒,是构建形态交易系统的理想主图工具。 核心功能 形态自动识别与紧凑标注 系统在满足条件的 K 线附近自动绘制形态名称文字与方向箭头,看跌类形态(双顶、头肩顶、吊颈、看跌吞没、十字星、暮星)标注于 K 线上方,看涨类形态(双底、头肩底、锤子、看涨吞没、晨星)标注于 K 线下方,多形态同现时自动紧凑错位排布,避免文字重叠。双顶与头肩顶附带红色向下箭头,双底与头肩底附带绿色向上箭头,方向一目了然。 MT5 版本额外支持形态 K 线染色功能 ,将触发形态的关键 K 线按多空属性着色,让形态位置通过 K 线颜色直观呈现。 看跌形态信号 M Top (双顶):当当前 K 线为局部高点、且在近 10 至 25 根 K 线
FREE

This Indicator is a affordable trading tool because with the help of Popular Developers & Support of M Q L Platform I have programmed this strategy. I tried to combine logic of Moving Averages, Parabolic Stop And Reverse, Trend Strength, Oversold, Overbought . Furthermore, I have also care about Support Resistance that Trader can easily get in touch with market by selecting one indicator only. What is in for Trader?
Trading Modes: This selection is for activate whole strategy "Power A
FREE
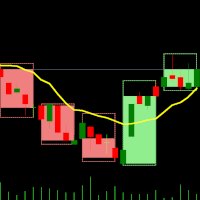
双时间框架指标 – MT4蜡烛嵌套 概述 蜡烛嵌套指标是一款专为MT4设计的多时间框架可视化工具。它将高时间框架的蜡烛叠加在低时间框架图表上,让您可以观察较小蜡烛在较大蜡烛内的表现。此方法改善了市场结构分析,增强了趋势识别,并使价格行为更加清晰——无需切换图表。 工作原理 选择低时间框架:
在MT4中打开您希望分析的时间框架图表(例如:M1、M5、M10)。 应用倍数:
选择一个倍数,动态生成高时间框架的蜡烛结构。 例如: 在M1图表上,倍数为5 → 显示M1蜡烛嵌套在M5蜡烛内。 在M10图表上,倍数为6 → 显示M10蜡烛嵌套在H1蜡烛内。 高时间框架蜡烛的叠加显示:
指标将高时间框架的OHLC(开、高、低、收)直接绘制在当前图表上,最新蜡烛会随着价格波动实时更新。 每根高时间框架蜡烛包含: 外框(高-低): 表示该周期内的最高价与最低价。 内框(开-收): 表示该周期的开盘价与收盘价。 实时更新: 当前活动蜡烛会在周期内动态更新。 如何在MT4上测试 将指标应用到图表:
打开M1(或其他低时间框架)图表,将双时间框架指标拖放到图表上。 选择周期倍数: 默认倍数为5,即在M
FREE

A Fibonacci indicator is best used with other indicators like Pivots, Support/Resistance etc. Price tends to use Fibo levels as Support or Resistance lines. So, this indicator is very useful to know when price might reverse or if a level is crossed, price might continue the trend. Also, to find the best Take Profit and StopLoss lines. Don't use Fibo Indicator alone for trading as it might not always be accurate. Use it to make your strategies better as a supporting indicator.
Settings:
Auto Fib
FREE

一个全自动交易系统,处理经典“超级趋势”趋势指标的信号。 Expert Advisor 使用经典的交易策略,不使用网格、mar 和剥头皮。 Expert Advisor 内置自动手数计算、多时间框架趋势过滤、止损。 如有必要,您可以连接一个鞅 伴随 使用尾随和盈亏平衡的订单。 信号监控 -> 这里 / 免费 AW 超级趋势指标 -> 这里 / MT5 版本 -> 这里 优点:
自动计算手数, 多时间框架趋势过滤, 可插入的鞅策略, 使用追踪和盈亏平衡功能跟踪订单, 经典止损策略, 可定制的指标参数。 笔记! 指标的图形元素不显示在 Expert Advisor 中! 输入变量:
主要设置 Size_of_the_first_order - 打开第一个订单的数量
启用_Autolot_calculation - 使用自动手数计算
Autolot_deposit_per_0.01_lots - 使用 autolot 时每 0.01 手的存款金额
信号 _Period_ - 基于先前蜡烛的周期,从低到高价格水平。在通道突破时,我们得到有关趋
FREE

This expert advisor trades using the famous super trend indicator: it is completely loyal to the original algorithm and implements many other useful features for the exigent trader, like customizable trading sessions, multi-timeframe filters and many others. [ Installation Guide | Update Guide | Troubleshooting | FAQ | All Products ] Easy to use and supervise Fully configurable indicator settings Customizable break-even, stop-loss, take-profit and trailing-stop settings Works for ECN/Non-ECN br
FREE

SuperTrend 指标是一种趋势跟随型技术工具,可以直观地显示市场趋势的反转。其线条的颜色和位置会根据价格变动自动切换,帮助交易者判断入场和离场时机。该指标结构简单,适用于手动交易和自动交易等多种交易风格。 主要特点 清晰显示趋势反转
上升趋势时,线条绘制在K线下方;下降趋势时,线条绘制在K线上方。这使得判断趋势方向和反转点变得直观易懂。 便于观察盘整到趋势的转变
有助于捕捉新趋势的初始阶段和突破区间行情的时机。 灵活的参数调整
通过调整ATR周期和乘数,可以优化不同货币对、CFD和周期上的使用效果。 多样化应用
适用于手动和自动交易,提供清晰的信号辅助交易决策。 计算逻辑 计算指定周期的平均真实波幅(ATR)。 上升趋势时显示下方线,下降趋势时显示上方线。 上升趋势线:(最高价 + 最低价) / 2 减去 ATR × 乘数。 下降趋势线:(最高价 + 最低价) / 2 加上 ATR × 乘数。 当收盘价突破这些线时,趋势方向切换,线条颜色也会随之变化。 主要用途 趋势启动时辅助进场 判断区间突破 作为止损或跟踪止损的参考 与其他指标或振荡器组合用作多重过滤 参数 参数名
FREE

Dark Inversion is an Indicator for intraday trading. This Indicator is based on Counter Trend strategy but use also Volatility. We can enter in good price with this Indicator, in order to follow the inversions on the current instrument. Hey, I made an Expert Advisor based on this indicator, if you are interested: Dark Titan
Key benefits
Easily visible Inversion Lines Intuitive directional arrows Automated adjustment for each timeframe and instrument Easy to use even for beginners Never repai
FREE

QCL Bollinger Trend Trail — MT4 Track trend direction with an adaptive trailing line directly on your MetaTrader 4 chart. QCL Bollinger Trend Trail combines trend detection with integrated volatility filtering to provide a clear visual reference alongside price action. Its two-color line advances as a trend develops and holds its position when conditions do not support further movement. Key Features Adaptive trailing line: Follows developing price movements. Directional colors: Distinguishes upw
FREE

Auto Fibo 是一个为加强你的手动交易而开发的指标。它将自动画出黄金比例,节省你的时间,促进你的交易。 将指标附在图表上,它就会自动画出准确的黄金比例,省去你寻找临界点的麻烦。 界面会根据你的电脑调整到波段的近似高点和低点。 这个指标会纠正大多数起点和终点的选择错误。 对于每个波段,都会显示准确的价格。 警告 我只在MQL5.com上出售我的EA。如果有人与您联系,向您出售我的EA,那么他们是骗子,只想要您的钱。
另外,如果您从外部网站购买我的EA,我向您保证,它们将是假的版本,不会和原来的一样工作。 .....................................................
FREE

Harvest FX USES THE TREND WAVE INDICATOR AND IT CAN IDENTIFY THE BEGINNING AND THE END OF A NEW WAVE TREND MOVEMENT.
AS AN OSCILLATOR, THE INDICATOR IDENTIFIES THE OVERBOUGHT AND OVERSOLD ZONES.
IT WORKS GREAT TO CATCH THE SHORT TERM PRICE REVERSALS AND USES A MARTINGALE STRATEGY TO CLOSE ALL TRADES IN PROFIT.
USE DEFAULT SETTINGS ON H1 OR HIGHER TIME FRAME ON ANY PAIR FOR MORE ACCURATE TRADES
WHY THIS EA :
Smart entries calculated by 3 great strategies The EA can be run on even a $30000 a
FREE

BoS and CHoCH Market Structure 直接在图表上标记市场结构:波段高点和低点、结构突破(BoS, Break of Structure)以及性质转变(CHoCH, Change of Character)。当某个波段点是其两侧所选数量K线中的最高点或最低点时,该波段被确认。当一根K线收盘突破最近的波段点时,指标会从该波段点到突破K线画一条线并加上标签:如果突破方向与当前趋势一致则为 BoS,与当前趋势相反则为 CHoCH。 功能 BoS(结构突破) - 收盘价沿当前趋势方向突破最近的波段点(趋势延续) CHoCH(性质转变) - 收盘价逆当前趋势方向突破最近的波段点(可能的方向转变) 以K线收盘价判断突破 - 仅用影线触及波段点不算突破 多空事件使用不同颜色 ;四种事件类型(看涨 BoS、看涨 CHoCH、看跌 BoS、看跌 CHoCH)均可单独开启或关闭 可调波段强度 - 每侧 2 到 50 根K线:数值越小事件越多,数值越大事件越少但更有意义 可选的突破K线上的 箭头 可选的波段上的 HH / HL / LH / LL 标记(每个波段与上一个同类波段比较)
FREE

FOLLOW THE LINE GET THE FULL VERSION HERE: https://www.mql5.com/en/market/product/36024 This indicator obeys the popular maxim that: "THE TREND IS YOUR FRIEND" It paints a GREEN line for BUY and also paints a RED line for SELL. It gives alarms and alerts of all kinds. IT DOES NOT REPAINT and can be used for all currency pairs and timeframes. Yes, as easy and simple as that. Even a newbie can use it to make great and reliable trades. NB: For best results, get my other premium indicators for more
FREE

TCL VWAP Super Bands is a Volume Weighted Average Price (VWAP) indicator for MetaTrader 4 with anchored mode, standard deviation bands, and a squeeze detector. It plots the daily-session VWAP by default and supports anchoring to any specific date. How It Works VWAP is a volume-weighted version of the average price over a chosen period. It is widely used as a reference level for fair value. The indicator computes VWAP from the current session start (daily mode) or from a user-specified date (anch
FREE

MA Ribbon Flow MA Ribbon Flow is a trend visualization indicator that combines 20 Moving Averages into a single ribbon-like structure.
The purpose of this indicator is to help traders validate whether a trend has truly changed direction or if the market is only experiencing temporary pullbacks or noise.
By observing the flow, alignment, and spacing between the MA ribbons, traders can identify: Trend strength Trend continuation Potential reversals Momentum expansion and weakening The indicator
FREE

The XU_H4_910440109_S_PS_CF_SQX is an algorithmic trading strategy for MetaTrader, tested on XAUUSD (Gold) using the H4 timeframe from April 1, 2004, to April 24, 2024. There is no need to set up parameters, all settings are already optimized and fine-tuned.
Recommended broker RoboForex because of EET timezone.
You can find the strategy source code for StrategyQuant at the link: https://quantmonitor.net/gold-bulls-power-trader/
Key details are:
Parameters
MagicNumber: 910440109
Main Ch
FREE

GoldmanScalper_V3 - Adaptive Scalping on XAUUSD Overview and Operational Strategy GoldmanScalper_V3 is an Expert Advisor (EA) specifically designed for trading XAUUSD (Gold vs. US Dollar) , an asset known for its high volatility and rapid movements. The EA is optimized to execute an adaptive scalping strategy , aiming to profit from short-term price fluctuations. Key Features: Target Asset: Exclusively XAUUSD . Strategy: Adaptive Scalping, specialized in high volatility environments. Time
FREE
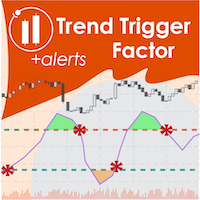
Detect strength for uptrends and downtrends by tracking Buy Power and Sell Power. Stay on the right side of the market by being able to determine whether the market is in a bull or bear trend and how strong the trend is.
Free download for a limited time! We hope you enjoy, with our very best wishes during this pandemic!
Trend Trigger Factor aims to ride out sideways movement, while positioning the trader in the correct side of the market to capture big trends when they occur. It was origin
FREE

RelicusRoad Multi Timeframe Levels 是适用于 MetaTrader 4 和 MetaTrader 5 的多周期支撑阻力指标,把 H1、H4、D1、W1 与 MN1 的最新摆动高点与低点,以水平线的形式绘制在你正在交易的图表上。 这五个周期各自贡献一条阻力线与一条支撑线,因此一张日内图表最多可以承载十条线。每条线都按其来源周期着色,因此无需切换图表即可持续看到更高周期的摆动。 工作原理 对固定集合中的每个周期,指标都会从最近的 K 线向前搜索最新的五根 K 线分形:某根 K 线的最高价未被其两侧各两根 K 线超越。该最高价即成为该周期的阻力线,对最低价进行同样的检验则得到支撑线。只有当某个周期等于或高于图表周期时才会被使用,因此你看到的组合取决于当前图表: M1, M5, M15 and M30 charts:全部五个来源周期,从 H1 到 MN1。 H1 chart:H1、H4、D1、W1 与 MN1,因为图表自身的周期也会包含在内。 H4 chart:H4、D1、W1 与 MN1,H1 的线会被隐藏。 D1 chart:D1、W1 与 MN1。 W1
FREE

Pivot Point Shift Supertrend 指标是用于 MetaTrader 4 的 无重绘 跟踪型 Supertrend 系统。与将带宽锚定在动态 hl2 中点的经典 SuperTrend 不同,本指标将带宽锚定在“已确认枢轴点”的加权平均价上。这样得到的一条跟踪线在正常波动中保持稳定,只在市场结构真正发生变化时才翻转。 该指标使用可配置的回溯周期(默认:左右各 2 根 K 线)检测枢轴高点和枢轴低点,按 2:1 加权公式更新一条平滑的中心线,然后在该中心线之上与之下放置 ATR 倍数通道,并应用标准 SuperTrend 跟踪规则生成一条具有方向性的 supertrend 线。趋势翻转时,会在图表上以文字标签形式给出 Buy / Sell 信号,同时通过弹窗、声音、推送通知或电子邮件发出提醒。 MT5 版本地址: Pivot Point Shift Supertrend MT5 更多产品请见: 所有产 品 如需查看真实账户示例和最新工具,请访问我的个人主页并发送好友请求,以免错过更新!
工作原理 枢轴识别。 当第 N 根 K 线的最高价高于其左右各 Pivot
FREE
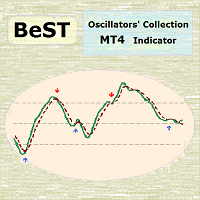
BeST Oscillators Collection is a Composite MT4 Indicator including the Chaikin,Chande and TRIX Oscillators which by default are contained in MT5 but not in MT4 platform. It also provides the option of displaying or not a Mov. Avg. as a Signal Line and the resulting Signals as Arrows in a Normal (all arrows) or in a Reverse Mode (without showing up any resulting successive and of same type arrows). Analytically for each one of the specific Oscillators: The Chaikin Oscillator ( CHO ) is
FREE
The indicator highlights the value in "over Sold" and "over Bought" zones. in addition, arrow indicates the return of the value from the extreme zone. Indicator can be easily customized by the user including change of colors, with, levels and arrows. Combination with other market signals and analysis is necessary and provides more stable results. Alert is also available for user.
FREE

实施一种稳健的策略通常被证明是一项具有挑战性的任务。我们理解您的时间宝贵,这就是为什么我们推出“ Diamond Hedge Pro ”的原因。这一革命性的解决方案提供了一种成功的策略,让您在享受成功的同时,无需花费数小时监控图表的负担。
重要!购买后请立即与我联系,我将为您提供我使用的参数!
它是如何工作的? 设置您的交易通道并选择所需的倍增器。当市场达到通道限制时,EA开始运行。无论运动方向如何,都会以预定义的止盈和止损水平开启交易。在市场保持在设定的通道内时,“ Diamond Hedge ”通过低买、高卖和累积利润运作。当市场趋势并离开通道时,EA会节制自己,在稳定恢复时重新开始操作,采用对冲机制以保持交易为正。 通过战略性过滤器优化性能 为了进一步提高EA的性能,我们已经加入了关键的战略过滤器。时间过滤器将EA的活动限制在一天中的特定时间,增加了利润潜力。这些过滤器共同精炼“ Diamond Hedge ”策略,确保它调整得以在市场中最大程度地把握机会。
为什么应该购买这个EA? 验证过的策略:该EA融合了一种经过开发和测试以利用市场波动的成功策略。在各种条件下获得的实
FREE
指示器显示垂直体积. 在设置中,有2个系数用于确定高和极值,1个用于确定低音量。 类似的算法也用于指示器 UDP1 Volume Pixel 。 当检测到指定的体积时,直方图以适当的颜色着色。 直方图的宽度会根据比例自动选择。 作为一项规则,价格反应的最大和最小体积。 但有必要使用确认信号。
输入参数 。
基本设置 。 Bars Count - 指标将显示在其上的蜡烛数 。 Calc Bars - 确定体积偏差的平均蜡烛数 。 Low Volume Factor - 我们定义低容量的系数 。 High Volume Factor - 我们定义大体积的系数 。 Extreme Volume Factor - 我们定义极值体积的系数 。
视觉设置 。 Histo Color - 根据蜡烛的体积和方向选择颜色来着色直方图 。 Width Histo (-1 auto) - 规则直方图的厚度 。 Width Color Histo (-1 auto) - 颜色直方图的厚度。 默认情况下,自动选择厚度。
电线杆 。 Draw Polus - 显示两极。 极点被定义为逆分形。 左右的音量
FREE

Order Block Breaker Block Zone MT4 by RWBTradeLab
A strict Order Block, and the Breaker Block that a failed one turns into. Most Order Block indicators mark any candle before a move. This one asks for five things, all mandatory, and shows you the evidence for each — with a full market structure engine built in, so the BOS or CHoCH that confirmed a block is drawn on the chart instead of having to be trusted. All from CLOSED candles only.
What Makes an Order Block Here
Five things have to happ
FREE
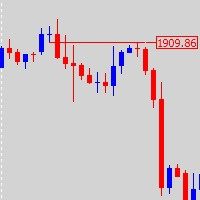
This is a combine that combines the ATR, Candle Timer, Watermark indicators and a tool for working with graphical objects, which allows you to reduce the time for marking charts. Functionality: Levels and proteins with price tags; drawing strictly horizontal levels; continuous zigzag manually; expansion / truncation of lines, wrinkles; quick change of colors and fonts and shapes; Filling/removing the filling of vessels, triangles, ellipses; dragging by 1 (first) point and auto alignment of the h
FREE

TCL Boom Crash is a signal indicator for MetaTrader 4 that combines a Relative Strength Index (RSI) layer, Stochastic oscillator confirmation, optional RSI divergence detection, and a multi-factor trend filter. Signal arrows are plotted on the chart when the configured filters agree. How It Works Each potential signal is built from three layers: RSI crossing its overbought or oversold level, Stochastic oscillator confirmation, and optional RSI divergence detection. A separate trend filter using
FREE
Candle_Timer_and_Spread 指标在一张图表上显示蜡烛结束之前的时间以及价格变化的百分比以及所选交易品种的点差。
默认情况下,当前时间范围内蜡烛结束之前的时间以及价格变化相对于当天开盘价的百分比的计时器位于图表的右上角。 该面板显示所选交易品种当前价格相对于当日开盘价的价差和百分比变化。该面板默认位于左上角。
输入设置: Candle_Time_Lable_Settings - 蜡烛结束前的计时器类型设置以及当前交易品种的价格变化。 Font_Size - 字体大小。 X_offset - 沿横坐标轴移动。 Y_offset - 沿纵坐标轴移动。 Text_color - 字体颜色。 Multi_Symbol_Settings - 多符号面板的设置。 Symbols_to_work - 手动输入面板将显示的符号,以逗号分隔。可以是任意数量的字符。仅显示添加到 Market_Watch 的交易品种。 Show_spread_tab - 是否显示传播列。 Show_daily_change_tab - 是否显示当前价格相对于当日开盘价的变化列。 Colorful_p
FREE

Astra BB RSI Arrows — 基于布林带与 RSI 的可视化交易信号指标 Astra BB RSI Arrows 专为需要清晰、简洁且高效工具的交易者而设计,用于寻找市场中的潜在入场点和离场点。该指标结合了两种经过长期验证的技术分析工具:布林带(Bollinger Bands)和相对强弱指数(RSI)。 您无需频繁切换窗口,也不必手动监控价格交叉、超买区域和超卖区域。指标会直接在图表上提供完整的可视化信号系统。 该指标不会用多余元素占满交易终端。它只显示真正重要的信息:布林带线、入场信号箭头、可视化离场标记以及帮助您及时发现重要交易机会的通知。 Astra BB RSI Arrows 的核心理念 当价格进入极端区域并开始返回正常区间时,市场往往会出现较好的交易机会。该指标正是用于识别这种市场情况。 布林带显示动态价格区间,帮助识别市场可能出现过度扩张的区域。RSI 则通过显示超买或超卖状态来补充分析。当这两种工具同时提供一致信号时,交易者可以获得更加清晰、结构化的分析依据。 Astra BB RSI Arrows 不只是绘制指标线,而是将市场情况转换为直观易懂的可视化信号
FREE
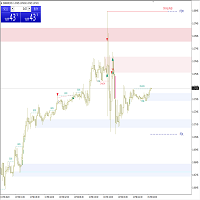
Trade History for MT4 This indicator is specially developed for that traders want to display his trades on the charts. Shows history and current deals on the chart. Trades show on the chart with a dotted line, and profit will show realtime. Buy trades are displayed in bull color, Sell trades in bear color.
Tip: The historical order displayed by the indicator is associated with the "Account History", so please set the historical order display in the "Account History" of MT software.
If you a
FREE
We provide indicators tailored to better meet your trading requirements. >> MT Magical <<
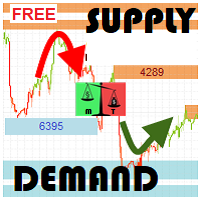
MT Supply Demand :
It is an indicator created to find supply and demand, which will be important support and resistance levels for the price. Supply Zone is a zone where the price has reached, it is often resisted. In other words, when the price reaches this zone, there will be more selling power to push the price back down.
Demand Zone is a zone where the price has reached, it is ofte
FREE

The Expert Advisor tool has been developed for XAUUSD (GOLD), based on KAMA,Ichimoku and Market orders. The stop loss is based on fixed pips. It has been backtested on more than 10-year long on M1 data with high quality of modeling. The enclosed screenshots demonstrate the complexity and coverage of the test by Monte Carlo analysis with 200 simulations. The Expert Advisor passed via Cluster Analysis, Optimization profile, System parameter Permutation . There is no need to set up parameters - a
FREE

Master Market Trends with the Hilo Flow Indicator Stop trying to predict the market and let the colors guide your decisions. Hilo Flow is the visual evolution of the classic HiLo Activator. Designed for traders who seek extreme clarity , it eliminates chart clutter and translates market flow strength directly into candle colors. Forget confusing lines and hesitation when aking decisions. With Hilo Flow, you can clearly identify potential moments to enter, hold a position, or exit a trade. Ho
FREE
Next Arrival : Flip or Die Trading Arena. Flip a trading account: https://flipordie.com/chapter-1-thirteen-doublings-double-a-trading-account/
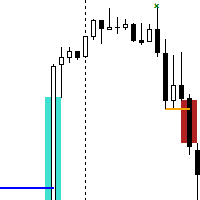
The Break of Structure (BoS) and Change of Character indicator with Fair Value Gap (FVG) filter is a specialized tool designed to enhance trading strategies by pinpointing high-probability trading opportunities on price charts. By integrating the BoS and Change of Character concepts with the FVG formation, this indicator provides traders with a robust f
FREE

Эксперт RSI Gold EA пригоден для торговле только одной валютной пары XAUUSD. Данная версия это наработки того, что можно извлечь только из одного индикатора RSI. В торговле используйте тайм фрейм только М5. Тестируйте на демо версии и перезапускайте эксперта каждую неделю. Мартин Гейл опасен сам по себе, а на золоте риск увеличивается многократно, не злоупотребляйте, хотя на все сделки выставляется фиксированный стоп, рекомендую на 3000 баланса брать 0,01 лот. MartingaleMultiplier = 2.0 Желаю
FREE

这款EA产品使用的交易策略来自于传统而有效的PASR策略,该策略包含了蜡烛形态判断,支撑压力位判断,当前加载的时间框架下以及周和月时间框架下的趋势判断;该产品包含了多货币对,趋势,趋势翻转等功能的自动化交易系统,没有马丁,没有网格,没有对冲,没有剥头皮;它有明确的止损位,止损方式根据当前时间框架最近收盘的蜡烛价格判断是否关闭,止盈点位默认根据EA是否检测到反向信号来判断是否关闭,当然,也可以设置目标盈利点子数或者设置跟踪止损,但强烈建议您使用默认止盈方式, 因 明确设置目标止盈点子或者设置跟踪止损会让您丢失潜在更大的盈利结果 。另外,因EA的判断目前不能做到100%,所以必要时可以人工干预关闭盈利订单,这样不会影响EA的运行。 支持的时间框架:H1 H4 D1 默认配置建议运行XAUUSD H1 下面是输入参数列表: input string EAComment = "RTNV"; //EA名称用于备注 input int MAGICMA = 891;
FREE

True Stochastic Divergence —— 高质量随机指标背离检测工具 大多数背离指标几乎会在每一个局部高点和低点产生信号,导致图表充满大量错误或意义不大的背离。 True Stochastic Divergence 采用专有过滤算法,对价格结构进行分析,仅显示最高质量的背离信号。它的目标并不是尽可能多地寻找背离,而是帮助交易者专注于真正重要的市场机会。 主要功能 自动识别随机指标(Stochastic)的看涨和看跌背离。 智能过滤虚假信号。 仅显示已确认的背离。 适用于任何交易品种和任何时间周期。 兼容 MetaTrader 4 和 MetaTrader 5。 支持 Push、电子邮件、弹窗和声音提醒。 支持普通背离(Regular)和隐藏背离(Hidden)。 选择随机指标线 与大多数同类指标不同, True Stochastic Divergence 允许您选择用于检测背离的随机指标线。 提供两种工作模式: %K 线 —— 使用随机指标主线检测背离。 %D 线 —— 使用随机指标信号线检测背离。 每种模式都有其自身特点,您可以根据自己的交易策略和市场分析方法选择最
FREE

Pips Hunter PRO 历经数年开发,是其前身的改进版。这个功能强大的指标分析市场和价格历史,生成买入和卖出条目。在计算这些条目时,它使用了不同的协同工作指标以及复杂的统计对数,可过滤并消除不利条目/ MT5 版本 。
功能特点 无重绘
当新数据到来时,该指标不会改变其数值
无滞后 该指标无滞后 交易货币对
所有外汇货币对 (最好是 EURGBP)
时间框架
所有时间框架
参数 ===== 显示 =====
箭头距离 // 信号(箭头)与蜡烛图之间的距离
===== 警报 =====
弹出式警报 // MT4 终端警报
推送通知警报 // 用于手机的警报
电子邮件警报 // 电子邮件警报
===== 图表设置 =====
更改图表上烛台颜色的选项
警告 我只在 MQL5.com 上销售我的产品。如果有人联系您向您推销我的产品,那么他们就是骗子,只想要您的钱。
此外,如果您从外部网站购买我的产品,我向您保证,这些产品都是假冒版本,与正版产品效果不同。
FREE
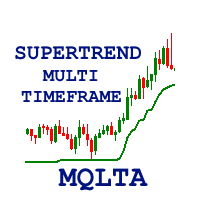
Индикатор MQLTA Supertrend Multi Timeframe сочетает в себе значения Supertrend, найденные на нескольких таймфреймах, чтобы подтвердить тренд пары. Для работы утилиты необходим бесплатный индикатор MQLTA Supertrend Line - https://www.mql5.com/en/market/product/25951.
Как он работает? Индикатор проверяет состояние Supertrend на всех выбранных таймфреймах и отображает результат в виде легко читаемой таблицы.
Как торговать с помощью индикатора Supertrend Multi Timeframe Покупку следует совершать,
FREE

GOLD (XAU) is one of the most volatile assets, and is the most attractive asset for traders.
Use this EA with this simple setup to trade Gold. To use this EA, the user only needs to fill in the Lot , TP , SL , and the EA will work optimally.
Choose the M1 time frame for this EA, to get as many trades as possible.
Even if the user leaves the TP and SL values (TP=0 & SL=0), the EA will automatically determine the best TP and SL values so that trading can be profitable.
As an additional f
FREE
免费获取我所有的 MT4 和 MT5 指标 — 点击这里了解方法
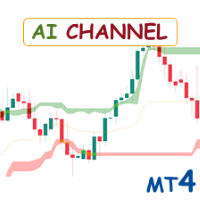
新工具 售价 $30 限于 首周 或 前 3 次购买 ! MQL5 Trading Tools 频道 : 加入我的 MQL5 频道,获取我的最新动态 AI Channels 指标利用 滚动K均值聚类 ——一种在聚类分析中强大的机器学习技术——实时提供基础价格趋势的见解。该指标根据聚类价格数据创建自适应通道,使交易者能够做出有关趋势方向和市场状况的明智决策。 该指标还包括一个 跟踪止损选项 ,提供了更灵活的风险管理方法。 查看更多MT5版本: AI Channels MT5 查看更多产品: 所有产品 如何使用AI Channels指标 每个通道的极端值为确定趋势方向提供了宝贵的见解: 上通道极端值: 价格突破此水平可能表明上升趋势。 下通道极端值: 价格跌破此水平可能表明下降趋势。 调整 窗口大小 (用于聚类的最近价格范围)可以提供高值的长期视角或低值的短期视角。 通过“群集”设置调整聚类 群集 设置允许用户控制价格突破通道极端值的难易程度。较高的群集值将极端值放置得远离价格,反映出更
FREE

产品简介 Dual Swing Breakout System 是一款专为 MT4 和 MT5 双平台设计的双摆动突破状态机主图指标。它通过构建快、慢两套完全独立的摆动高低点追踪系统,将市场结构转化为清晰的状态机模型。当价格突破关键摆动极值时,系统会改变状态线的颜色并触发交易信号。该指标帮助交易者过滤市场噪音,精准识别短期动能爆发与中长期趋势反转,提供了一套逻辑严密、视觉直观的主图趋势跟踪解决方案。 核心功能 快慢双轨状态线与实时价格标签 系统在主图绘制 4 条状态线: 快线 由红色(多头状态)和绿色(空头状态)组成,追踪短期 12 周期内的摆动极值突破; 慢线 由紫色(多头状态)和青色(空头状态)组成,基于多周期加权组合算法追踪中长期趋势结构。线条颜色会根据市场状态自动切换,让交易者一眼看清当前所处的多空阶段。系统在最新 K 线右侧显示橙色(快线)和紫色(慢线)的 实时关键价位数字 ,方便交易者设置止损或挂单。 MT5 版本额外支持 K 线变色染色功能 ,让盘整与突破状态通过 K 线颜色直观呈现。 做多信号 Long (快线做多) :当快线状态从空头(绿色)切换为多头(
FREE
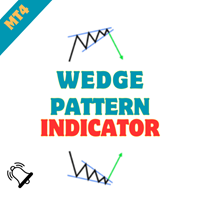
发现 "Wedge Pattern MT4" 的潜力,这是一种专为 MetaTrader 4 设计的创新指标。这个工具使各级交易者能够轻松识别市场走势中的楔形模式,从而增强决策和交易策略。 凭借其先进的模式识别能力,Wedge Pattern MT4 提供及时的见解,可以带来盈利的交易机会。无论您是想识别趋势反转还是延续,这个指标对于任何认真对待当今动态市场的交易者来说都是必不可少的。 MQL 产品安装指南 | 在 MT4/MT5 上更新已购买的 MQL 产品 | 常见故障排除指南 | 指标设置 / 指南 主要特点 缓冲区集成:将指标值暴露为可访问的缓冲区,使 Expert Advisor 能够有效利用基于信号的交易。 可视化箭头信号:在信号蜡烛上直接在图表上显示清晰的买入/卖出箭头,便于视觉阅读。 快速且可回测:基于 MetaTrader 的本地 OnCalculate() 引擎构建,确保极快的计算速度,并与策略测试器完全兼容以进行历史回测。 弹出警报:在信号事件上发送弹出警报,确保您不会错过任何交易设置。 推送通知:实时推送通知到您的 MetaTrader 移动应用,方便随时监控。
FREE

一眼就能读懂的动量,以及一个在自己不确定时会明说的产品。QQE Mod MTF 在 RSI 上跑两组彼此独立的 QQE 模块,只画一条柱状图:两组模块对方向意见一致时明亮,不一致时灰色。要点恰恰是那片灰。多数振荡器在每一根K线上都给你一个颜色,然后让你自己猜这个颜色值多少;这一个会明说没有确认。免费,没有试用期,也没有锁住的功能。 QQE 是 Qualitative Quantitative Estimation 的缩写,它先平滑 RSI,再用 RSI 自身绝对变化量的平滑均值,在其周围搭出一条跟随的带。这条带不会逆着趋势回退,这正是 QQE 的交叉比 RSI 的交叉更慢、更安静的原因。本产品同时跑两组这样的模块,并公开两者一致的部分。 两个模块,一个状态 模块一给出跟随线,相对 50 这个水平绘制,外面套一层布林过滤。动量究竟是走出了最近的区间,还是仍在其中,正是这条线和它的带在说。 模块二给出柱状图,也就是该模块的平滑 RSI 相对 50 度量后,再经过一道阈值筛选的结果。 产品公开的状态是这两者的组合。当模块二在某个方向越过自己的阈值,而模块一的线站在自己的布林带之外表示同意时,
FREE

VR Trade Panel 是一款专业的交易面板,旨在提高交易便利性并降低交易风险。借助简洁的界面和详尽的指南,新手将更容易掌握交易基础并开始实践。 面板的主要原则:舒适、快速、功能全面。 說明: [ 如何安裝 ]、[ 如何使用 ]、[ 演示版 ]。 程序界面直观简洁,只需两次点击即可开立市价单或设置任何类型的挂单。 头寸和订单管理迈上了新台阶,您不仅可以移动水平的止损和止盈位,还能创建倾斜的价位。借助这一解决方案,止损、止盈位及挂单价格可按您指定的方向移动,或在设定条件下自动失效。 该交易面板旨在让交易者能提前为自己做好一切设置,从而快速舒适地交易。 为此,交易面板采用了以下先进解决方案: 五个手数按钮——让您无需在计算上浪费时间,能瞬间选择所需的交易量。同时,交易量可按存款百分比、指定金额或存款的倍数金额进行计算。 止损和止盈输入字段——您可按方便的方式指定规模:精确价格、精确点数、期望的利润或亏损金额。 注释输入字段——会保留此前输入的注释,无需您重新填写。 声音提示——帮助您了解交易指令的执行情况。 对于每个头寸或挂单,您可设置多达 10 个部分平仓价位,每个价位均可单独配置
FREE

DeThrust StatsMood — Impulse Exhaustion Detector for D1 DeThrust StatsMood is a MetaTrader 4 indicator optimized for the Daily (D1) timeframe, designed to identify potential exhaustion points following exceptionally strong directional moves in the Forex market. How it works The indicator detects when price experiences a statistically abnormal acceleration compared to the symbol’s historical behavior and signals the potential exhaustion of that impulse. This is not a conventional trend reversal i
FREE

来自任意周期的 ICT 市场结构——HH、HL、LH、LL、每一个 BOS 和 CHoCH,带提醒——还有一张表格统计价格在您的图表上真正跟随每次突破的频率。 ICT Market Structure Honest Stats 标注每个摆动高点和低点,绘制每次结构突破(BOS)和性质转变(CHoCH),显示下一次突破所需的价位,在新的突破形成时立即提醒您,并在您图表的历史上衡量价格沿突破方向继续运行的频率,与随机 K 线对比。免费,属于 Honest Stats 系列。 MT5 版本(免费) | Order Blocks MT4(免费) | 免费:FVG Honest Stats | 免费:Liquidity Levels | 免费:SMT Divergence | 免费:Killzones 新品:所有 ICT 概念集于一个指标 -> ICT Pro All in One Honest Stats (9 个因素的共振分数、提醒和多品种扫描器) 新品(免费):反转公允价值缺口(IFVG),附回测信号和提醒 -> ICT Inversion FVG Honest Stats (被价格收盘穿
FREE

https://t.me/GoldRingM1 Get the expert for free Download Upgrade Expert on Telegram channel Request the special strategy from the Telegram channel admin Training videos for working with Expert and professional upgrades and templates are all available on the Telegram channel. This expert uses 5 separate indicators to find the entry point Along with it, it uses several capital management systems, position management and exit management The version available on the site is the limited version of
FREE

The Supertrend indicator available on the MQL5 Market for MetaTrader 4 is an exceptional tool for traders seeking to identify prevailing trends in specific trading instruments. This indicator boasts two built-in indicators, Average True Range and Standard Deviation, allowing traders to choose the most suitable indicator based on their preferred trading strategy. Additionally, users can customize the period of these indicators and select the price (Close, High, Low, Open, Weighted) to which it s
FREE

RadarSignal XAUUSD — Multi-Timeframe Radar Dashboard for Gold Trading Stop guessing where Gold is heading. Let the Radar scan it for you. RadarSignal XAUUSD is a multi-timeframe technical dashboard built specifically for XAUUSD (Gold) traders who want a single, clean, visual answer to three questions every trade requires: Where do I enter? Where is my safe invalidation zone? Where is my realistic target? Instead of flipping between five indicators on three charts, RadarSignal fuses ADX, RSI, CCI
FREE

Smart Band Classic An adaptive multi-layer trading indicator combining dynamic price zones, intelligent BUY and SELL signals, and professional chart visualization in one streamlined MetaTrader 5 workspace. Smart Band Classic is a technical analysis indicator designed to help traders navigate market movements, recognize potential trading opportunities, and evaluate price behavior through a clean and coordinated visual environment. The indicator brings together an adaptive band system and a propri
FREE

本顾问旨在用于长期(终身)的多货币交易,同时交易 28 个货币对(货币对列表固定在代码中),时间框架为 M30。货币对列表:EURUSD、GBPUSD、AUDUSD、USDCAD、USDJPY、USDCHF、GBPJPY、EURJPY、AUDCAD、AUDJPY、CHFJPY、EURCHF、EURGBP、NZDJPY、NZDUSD、CADJPY、AUDCHF、AUDNZD、CADCHF、EURAUD、EURCAD、EURNZD、GBPAUD、GBPCHF、GBPCAD、GBPNZD、NZDCAD、NZDCHF。 其目标是捕捉趋势运动,并通过特殊的平均化机制、锁仓订单和紧急保护措施来管理风险。 核心策略为趋势跟踪,使用内置的 Skdon2 指标,在每个已完成的 K 线上发出买入或卖出信号。
当信号改变时,顾问按特定规则平掉旧仓位,并按新信号方向设置一系列(数量可在参数中设定)挂单(BUYSTOP 或 SELLSTOP)。 1. 顾问整体功能
它在 M30 图表上,通过内置于代码中的自定义指标分析每个货币对。
当指标发出买入或卖出信号时,顾问会开启一系列订单:一个市价单(立即按当前价
FREE

Investment Castle EA — 趋势交易自动驾驶
Investment Castle 是一款顺势交易的智能交易系统(EA),内置了我们自己的两大工具:Investment Castle 指标和心理关键价位。它旨在免去顺势交易中的手动工作——识别市场结构、把握入场时机和管理风险——让您依据清晰的规则化计划进行交易,而非凭情绪。
它能为您做什么 自动支撑与阻力: 在每张图表上自动为您识别关键价位——无需手动画线。 心理关键价位: 入场与出场对齐价格容易反应的整数价位区域。 波动性自适应距离: 止损、目标和恢复距离会根据当前市场波动性自动调整。 可控恢复,而非盲目马丁格尔: 采用受控的止损与恢复模型,旨在抑制回撤而非累加风险。 完全可配置: 每个参数都开放且可优化——根据您的品种、周期和风险偏好进行调整。
适合人群: 既适合希望获得可靠自动化的主观交易者,也适合需要透明、可调趋势引擎的系统化交易者。
风险提示: 交易存在重大亏损风险。请务必先在模拟账户上测试,并使用您能接受的风险设置。过往表现不代表未来结果。
FREE

一种不会重绘的核回归,而这正是关键所在。Nadaraya Watson Envelope MTF在价格上绘制一条平滑的中心线以及围绕它的误差包络线,标记出价格在拉伸后重新回到内部的K线,并且每根K线仅根据其之前的K线计算,因此已收盘的K线永远不会再移动。图表网站上常见的这类线是双向拟合的,会在您脚下不断改写;而这一版本在设计上就是因果的。免费,无试用,无锁定功能。 它回答的问题很窄,也是它唯一试图回答的问题:价格已经从其近期中心拉伸开来,并且刚刚停止拉伸。您是把它当作均值回归的入场信号,还是当作在趋势仓位上获利了结的位置,抑或什么都不当,这由您决定。该指标定位事件,而不对其做出评判。 线是如何构建的 中心线是一种Nadaraya-Watson核回归:每根K线都是其之前K线的加权平均,权重是随距离衰减的高斯权重。包络线位于该中心上下选定数量的平均绝对误差处,因此当价格在线周围表现嘈杂时它会变宽,而当价格表现驯服时它会收窄。 该估计是因果的。K线i根据K线i、i-1、i-2以及更早的K线计算,而绝不会根据其右侧的K线计算。这是对图表网站上通常展示核回归方式的刻意背离,那里的拟合是双向的,随
FREE

This indicator is based on Guppy's GMMA Strategy. And shows arrows when GMMA lines cross up or down. To have this indicator and get alerts for Multiple Timeframes and multiple Pairs you can check out the demo of this GMMA Trend Scanner indicator: https://www.mql5.com/en/market/product/38747
About GMMA In Brief:
GMMA attempts to identify trends by combining two groups of moving averages with differing time periods: The long-term EMAs (30, 35, 40, 45, 50, and 60) the behaviors of investors that h
FREE

One Click Close MT4 is an EA which allows you close orders quickly. EA display on chart two buttons. The first button "Close All Positions" is using to close all opened orders. The second button "Close Profit Positions" is using to close only profitable orders. EA is closing orders for all available symbols, not only for chart symbol. In EA params you can set distance from upper chart frame (Y Offset) and from left chart frame (X Offset). For installation EA it is only need to copy One Click Clo
FREE
MetaTrader市场是 出售自动交易和技术指标的最好地方。
您只需要以一个有吸引力的设计和良好的描述为MetaTrader平台开发应用程序。我们将为您解释如何在市场发布您的产品将它提供给数以百万计的MetaTrader用户。
