 MetaTrader 5
 专家
专家
 指标
指标
 程序库
程序库
 实用工具
实用工具
 窗口小部件
窗口小部件
 规则
规则
适用于MetaTrader 4的免费EA交易和指标 - 3
 EA交易自动执行市场交易,而指标可使您更准确地分析报价并预测价格行为。
通过这些应用程序,您将能够更明智地在MetaTrader 4执行交易,抓住更多的交易机会。
EA交易自动执行市场交易,而指标可使您更准确地分析报价并预测价格行为。
通过这些应用程序,您将能够更明智地在MetaTrader 4执行交易,抓住更多的交易机会。 
PriceHunter EA is an algorithmic trading system that combines price action analysis with adaptive moving averages, volatility filters, and momentum confirmation. The Expert Advisor is designed to identify short-term and medium-term market opportunities while avoiding low-quality signals.
Key Features of the Trading Logic:
• Trend Detection – identifies the main direction using dynamic EMA-based filters. • Momentum Confirmation – validates entries through oscillators and volume analysis to r
FREE

在图表上拖动三条线:入场、止损和目标,即可读出您所选风险对应的精确 手数 。这是一个可视化的 仓位规模与风险计算器 :面板会显示以账户货币计价的风险金额、以点数表示的止损距离,以及盈亏比,全部随拖动实时更新。 您的线在两次使用之间会被记住 ,所以切换周期或重启终端之后,您设好的计划依然在那里。没有信号,不重绘。 它显示什么 手数 ,对应您愿意承担的账户百分比风险,并遵守经纪商的最小手数、最大手数和手数步长。 风险金额 ,以您的账户货币计算。 止损距离 ,从入场到止损,以点数表示。 盈亏比 ,以及到达止盈位时的潜在收益。 方向 ,多头还是空头,由三条线的相对位置自动判断。 您的计划会留在原处 入场、止损和目标按品种和账户分别保存。切换周期、重启终端、第二天再打开,三条线都还在您离开时的位置。超过 30 天的计划会被视为过期并替换为新的默认值,这样就不会把线还原到一片空白的地方。如果您更喜欢每次从头开始,也可以关掉这个功能。 当您确实想重新开始时,面板上有一个 Reset plan to current price 按钮:点击一次进入待确认状态,再点击一次确认,因此绝不会误触发生。
FREE
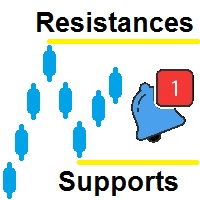
支撑位和阻力位的创建是为了帮助您在几个不同的时间范围内自动识别顶部和底部,从而在当前图表上绘制这些顶部和底部。 让我们去解释阻力的产生 有一个规则字段,你可以定义什么是顶部和底部顶部规则默认设置如下: H[ 0 ]<=H[ 1 ] and H[ 1 ]=>H[ 2 ]
在哪里:
元素 描述 H 表示高
[0] 表示当前蜡烛 [1] 表示前一根蜡烛 <= 表示小于或等于 => 表示高于或等于
因此,在此表达式中,我们首先使用以下规则检查当前最高价是否小于或等于先前最高价: H[ 0 ]<=H[ 1 ] 然后我们检查 Previous High 是否大于或等于 Previous High,表达式为: H[ 1 ]=>H[ 2 ] “And”连接两个表达式,如果为真,则意味着我们有一个新的阻力: and 但是,我们还是要选择正确的蜡烛来做标记,而正确的蜡烛不是当前的蜡烛,而是之前的蜡烛,即蜡烛[1] 然后我们使用第二个参数来获取正确的蜡烛 Get Candle = 1 现在我们有了正确的阻力点
现在让我们继续创建支持 为了创建资金,我们有以下标准规则: L[0]=>L[1
FREE
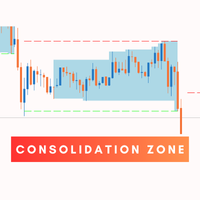
Consolidation Zone Indicator is a powerful tool designed for traders to identify and capitalize on consolidation patterns in the market. This innovative indicator detects consolidation areas and provides timely alerts when the price breaks above or below these zones, enabling traders to make informed trading decisions. MT5 Version : https://www.mql5.com/en/market/product/118748 Join To Learn Market Depth - https://www.mql5.com/en/channels/suvashishfx
Key Features:
1. Consolidation Detecti
FREE
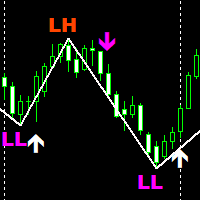
SMC Traders is a non-repaint indicator that is based on Price Action The indicator uses current market structure to predict future reversals. The indicator can be used with our free Market structure zig zag which can be found here: https://www.mql5.com/en/market/product/91579 Please note to find the HH AND HL CLINK ON LINK ABOVE Timeframes: 15 minutes for scalping 1 Hour for swing trading Purple Arrow look for sells in conjunction with LL White Arrow look for buys in conjunction with HL
FREE
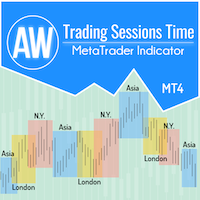
为了方便交易者获取市场表现数据并更好地制定交易策略,我们开发了交易时段指标。各个交易所的开盘时间会影响交易,因为它会影响市场活动和交易量。这些因素决定了不同工具的波动性和交易机会。 AW 交易时段指标显示亚洲、伦敦和纽约市场的交易时间。交易者可以显示或隐藏不同的时区以获得更好的体验。在图表上,您可以看到距离交易时段结束的时间,以及交易时段的大小。图表上数据的显示具有灵活的图形调整,适合不同风格的交易图表。
更多产品 -> 这里
优点:
显示亚洲、伦敦和纽约交易时段, 如果有必要,以数字显示会话大小, 开启后,显示交易时段结束的时间, 可以单独禁用交易时段, 图表上可自定义的会话边框样式 如果需要,可以在图表上显示垂直线 可以用纯色显示会话 自定义会话文本(颜色、偏移量、名称)
输入变量:
主要设置 Number_of_Days-显示指标的天数。
Show_Session_Size_in_Points - 启用后,指标将显示每个交易时段规模的数字值(以点为单位)。
Show_Time_Until_end_of_Session - 在图表的右上角显示或隐藏会话结束的时间。
Show
FREE
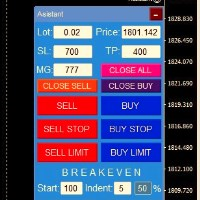
交易面板一鍵開倉! 為了幫助交易者,設定止盈、停損、掛單停損和限價訂單、轉移至損益平衡、追蹤。 還有訂單的部分平倉(%)
所有參數均可自訂。 裝高手!
設定
手數 -- 0.02 手 停損 --- 700 停損 止盈 --- 400 止盈 UseBreekeven ---- false 損益兩平關閉 ClosePersent--- 訂單的 50 關閉百分比 brStart ---- 100 損益平衡開始 brIndent ---- 5 損益平衡步驟 UseSTtrall ---- 假拖網停止 UseTPtrall ----真正的Tral Take On TrStart ---- 150 拖網開始 trstep ---- 5 拖網步驟
訂單管理
此面板支援市價訂單和掛單。 部分平倉 - 按設定交易量的百分比平倉部分訂單。 追蹤停損 - 管理停損
FREE

This is a multi-timeframe version of the popular Hull Moving Average (HMA).
The Double HMA MTF Light indicator combines two timeframes on a single chart. The HMA of the higher timeframe defines the trend, and the HMA of the current timeframe defines short-term price movements.
The indicator is freely distributed and hasn't audio signals or messages. Its main function is the visualization of price movements. If you need advanced functionality of the HMA multi-timeframe indicator (information ab
FREE

MT4 版本: https://www.mql5.com/en/market/product/157679
MT5 版本: https://www.mql5.com/en/market/product/157680
支撑阻力指标 — 智能市场结构水平
一款简洁、智能且高度可靠的支撑阻力指标,专为专业交易者和自动化交易系统打造。
支撑阻力指标采用先进的聚类算法,结合分形、基于 ATR 的价格分割和多时间框架分析,旨在检测真实的市场水平。
该指标并非绘制随机或嘈杂的线条,而是生成经过统计验证的水平线,这些水平线代表价格反复出现反应的位置,因此非常适合主观交易、算法交易、风险管理和突破验证。
主要特性
高级支撑阻力引擎
采用 ATR 缩放网格分割
将上下分形聚类,形成高精度的结构水平
使用精度模式(高/中/低)过滤噪声
兼容多时间框架
扫描支撑阻力位:
当前图表时间框架,或
M1、M5、M15、M30、H1、H4、D1、W1、MN1
非常适合在较低时间框架交易时依赖较高时间框架结构的交易者。
清晰的可视化效果
自动绘制支撑线和阻力线
可选的基于距离阈值的
FREE

This is a professional-grade, multi-strategy Expert Advisor developed exclusively for Gold (XAUUSD) on the H1 timeframe.
Unlike single-logic systems, this EA simultaneously executes 14 independent trading strategies , each with its own magic number and execution logic. All strategies are built around market structure breakouts detected by the custom RecentSwingHighLowBands indicator — engineered to adapt to Gold's unique volatility profile. This is a rule-based, risk-controlled trading system b
FREE

如果你象这个项目一样,就有5个饥饿审查。 这项指标采用了既定价格的公开、高、低价和关闭价格
可以对特定时间区加以调整。 许多机构和专业人士都认为这些是重要的。
贸易商可以为你了解他们可能更进一步的地点,
积极。 现有期间为: 前一日。 前一星期。 曾任Month。 曾任。 前一年。 或: 目前日。 目前周。 目前 Month。 目前配额。 今年。
FREE

交易会话时间指示器:
“交易会话时间指示器”是一个强大的技术分析工具,旨在增强您对外汇市场中不同交易会话的理解。这个无缝集成的指标提供了关于主要交易会话的开盘和收盘时间的重要信息,包括东京、伦敦和纽约。通过自动时区调整,它为全球交易者提供服务,帮助他们优化交易时间表,以获取高流动性时段,并避开低活跃时段。该指标提供了关于市场情绪、高峰波动期和交叠交易会话的见解,帮助日内交易者做出与其策略一致的精确决策。其可定制的显示允许个性化用户体验,其交易时段数据可用于制定交易计划。通过提高低活跃时段的意识,该指标帮助交易者避免过度交易,并专注于优质机会。适用于 MetaTrader 4,“交易会话时间指示器”是寻求优化交易路程的交易者的宝贵工具。
特点:
- 优化的时间表:提供主要交易会话时间,并与高流动性相符。 - 电话和电子邮件提醒:在会话开始时提醒您。 - 杀伤区域:使用警报设置ICT风格的杀伤区域。 - 重叠分析:探索会话重叠并针对活动增加。 - 日内精度:帮助日内决策并关注与策略一致的会话。 - 可定制的显示:个性化偏好和颜色设置。 - 避免过度交易:提高低活跃意识并优先考虑质量
FREE

VinoScalper — 4-Strategy Adaptive Scalper with Tiered Risk Management VinoScalper combines four independent, complementary entry strategies into a single Expert Advisor, all sharing one professional-grade risk and trade-management engine. Instead of relying on a single setup, VinoScalper looks for opportunities across different market conditions — trending breakouts, mean-reversion pullbacks, support/resistance reactions, and range-bound extremes — and takes whichever signal confirms first. STRA
FREE

SMC Pro Chart is a professional Smart Money Concepts chart-analysis indicator for MetaTrader 4, designed to transform a standard chart into a clear and structured market map. It automatically highlights key elements such as market structure, BOS and CHoCH, Order Blocks, Fair Value Gaps, liquidity areas, and Premium / Discount zones , helping traders understand price action and important market locations directly from the chart. The interface is built to stay clean and practical, with quick
FREE

一条不肯游走的趋势线。Half Trend MTF 在市场推挤它的时候守住自己的水平,只有当最近 N 根K线的极值真正把它顶出去时才翻转,所以在那种把移动平均线衬托成信号发生器的锯齿里,它一动不动。围绕它的 ATR 通道则显示,在这次翻转开始有意义之前,今天的波动率给价格留了多少余地。免费,没有试用期,没有锁住的功能。 它支撑的判断很简单,而且说得直白:线告诉您趋势目前守在哪一侧,翻转告诉您这件事是在哪一刻改变的,通道告诉您还有多少余地。 因为这条线只有在最近 N 根K线的极值朝它反方向走时才会动,它不会像均线那样漂移。它先是不动,然后翻转。 图表上有什么 Half Trend 线,用趋势的颜色绘制,跨过翻转K线也不断开:趋势向上时是一条画法,趋势向下时是另一条,在交接的位置连起来。ATR 通道,一条上轨和一条下轨,它们到线的距离是半个 ATR 的倍数,每条轨道都是一条各自颜色的细线。两者之间是两层填充,线以上用多头色,线以下用空头色,用细点网绘制,因此K线能直接透过它们读出来,价格处在通道的哪一半也仍然一眼可辨。翻转K线上还有 BUY 和 SELL 箭头。所有内容都画在价格窗口里。
FREE
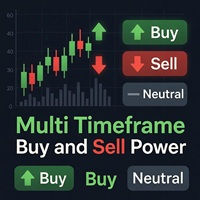
Multi Timeframe Buy and Sell Power MT4
The Multi Timeframe Buy and Sell Power indicator for MetaTrader 4 is a versatile tool designed to provide traders with a clear visual representation of market pressure across nine standard timeframes, from M1 to MN1. By aggregating buy and sell strength percentages derived from recent price action and tick volume, it helps identify potential trends, reversals, and neutral conditions in real-time. The indicator displays this information in a compact dashbo
FREE

RelicusRoad Multi Timeframe Trendbar 是适用于 MetaTrader 4 和 MetaTrader 5 的多周期趋势指标,在图表角落以一行彩色圆点显示 M1 至 MN1 共九个周期的 Uptrend、Neutral 或 Downtrend 状态。 每个周期在图表右下角都有一个圆点,其名称显示在上方。颜色表示该周期的状态,因此无需切换图表即可看出哪些周期方向一致。 工作原理 对每个周期,指标都会在该周期当前 K 线上比较两个标准工具:步长 0.02、最大值 0.2 的 Parabolic SAR,以及周期为 14 的 ADX 中 +DI 与 -DI 两条线。只有二者一致时才会显示方向: Uptrend:Parabolic SAR 位于收盘价下方,且 +DI 高于 -DI,默认柠檬绿。 Downtrend:Parabolic SAR 位于收盘价上方,且 -DI 高于 +DI,默认红色。 Neutral:其他所有情况,包括 SAR 与 DI 意见不一致,默认黄色。 ADX 主线未被使用,因此这一行只显示方向,不显示趋势强度。ADX 与 SAR 的设置是固定
FREE

Reference Candle Breakout EA — session breakout trading with full risk control
This EA automates a classic session-breakout strategy built around a single reference candle each day (e.g. the 3:30 candle) on any timeframe you choose — 5, 15, 30, 60 minutes or higher.
Add Md Trend Pro for Trending Market,A powerful Manual Trade Combination. Add SureShot Reversal Indiactor for Ranging Market& Complet the System. Tested on GOLD 30m 3:30am
FREE
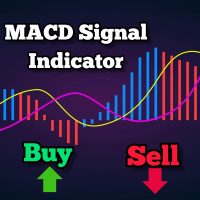
这是一种基于MACD的趋势跟踪指标,当处于200 MA之上时提供买入信号,当低于200 MA时提供卖出信号。当MACD穿过零线时,将生成信号。此指标还展示了可用作止损的支撑和阻力水平。
可调整的参数包括MA周期、MACD快速EMA、慢速EMA以及支撑-阻力间隔。它绘制在最近蜡烛的最低点和最高点。
默认设置如下: SR间隔:10, MA周期:200, 快速EMA:24, 慢速EMA:26。
调整这些值可能导致信号更频繁或更少,建议进行测试以确定最有效的配置。
推荐使用1小时或4小时的时间框架,但在任何时间框架上都可能有效。该指标适用于所有交易工具,包括外汇、股票和商品等。
欢迎进一步了解其详细应用和优势。此外,它还包含报警功能。 请查看我的其他产品: https://www.mql5.com/en/users/8587359/seller
FREE

//// Dark Phoenix Scalper ////
Dark Phoenix Scalper is Advance Scalper Working On All Broker This Scalper Working on All Forex Pairs and Gold (For Gold send me massage i will send Gold setfile, default not working on Gold) ( Cent Account have high spread this scalper need lowest spread for best performance do not run on Standard account or high spread account ) This Scalper Have 2 Mode Trading Normal Mode ( Working on Signal Chart ) Multicurrency Mode ( Working on All Pairs List
FREE

Good old UT BOT converted from TradingView script by ' QuantNomad ', initially by ' Yo_adriiiiaan ' and ' HPotter ' - so you can bet this is powerful tool. If you know, you know. This is top of the line, while keeping it really simple.
Main function: trend identification with trend switch points , created by EMA(source) and ATR -source is CLOSE PRICE with option to use HEIKEN ASHI chart instead, for this you need "Heiken Ashi" indicator - its available as free download by MetaQuotes
One of th
FREE
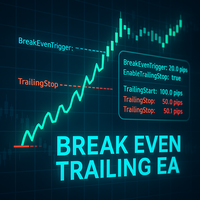
Break Even Trailing EA|自动化建仓保本与跟踪止损工具 Break Even Trailing EA 是一款适用于 MetaTrader 4/5 的实用型智能交易顾问(EA),专为手动交易者自动保护盈利而开发。该工具可在您手动开仓后,自动进行风控和盈利保护,让交易更加高效和省心。
本EA支持 两种可自由切换的盈利保护模式 ,可单独或组合使用,灵活满足不同交易风格。 1. 保本功能(止损自动移动到开仓价或加点) 当持仓达到预设盈利(以点为单位)时,EA会自动将止损位移动到开仓价,或者开仓价加指定点数(用于覆盖手续费、点差等)。 有效防止盈利回吐,确保不会让盈利单变为亏损。 支持自定义“保本+偏移”,让每笔交易即使止损也能锁定一定利润。 2. 跟踪止损功能 当盈利达到一定水平后,EA会自动启用跟踪止损,随着行情的有利波动自动推高止损位。 随着利润的增加,止损线也会动态跟随,让您在抓住趋势时自动锁定更多利润、及时防范回撤。 启动条件和跟踪点数均可自定义设置,实现精细化风控。 这两项功能可以 通过参数分别开启/关闭,或灵活组合使用 。例如,可先自动保本,再在盈利进一步扩大后
FREE

MetaTrader 4/5 中的 MACD 指标看上去与其它许多图表软件里的 MACD 不同。这是因为 MetaTrader 4/5 版本的 MACD 显示 MACD 曲线作为直方图,而传统上显示为曲线。此外,MetaTrader 4/5 版本使用 SMA 计算信号线,而根据 MACD 的定义,它应该使用 EMA。MetaTrader 4/5 版本也不计算实际的 MACD 直方图 (即 MACD 与信号线之间的差异)。这可能对那些 MetaTrader 4/5 的新手带来困惑,因为将 MACD 线显示为直方图,而未提供实际的 MACD 直方图。 这款指标按照其创造者 (Gerald Appel) 的定义显示 MACD,如同其它图表软件里显示的那样。而 MACD 线的计算采用 "快速" EMA 和 "慢速" EMA 之间的差异。信号线是 MACD 线的 EMA。MACD 直方图是MACD 和信号线之间的差异 (MACD 直方图可自行作为可靠的用作背离信号)。 True/False 启用开关,您可以显示/隐藏 MACD/信号线,以及 MACD 直方图。
FREE

使用 Advanced Market Sessions 指标掌握市场节奏。 在交易中,时间就是一切。准确了解主要金融中心的开盘和收盘时间是理解市场波动性、流动性和方向性偏差的关键。该指标为您提供对三大主要交易时段(亚洲、伦敦和纽约)的清晰可视化展示。 通过实时自动映射每个时段的确切最高价和最低价,该工具使您能够以真正的机构背景进行交易。无论您是交易聪明钱概念 (SMC)、ICT、突破策略还是均值回归,了解时段的边界对于寻找高概率交易设置至关重要。 核心优势: 识别流动性池: 时段的高点和低点是价格的天然磁铁。轻松找出流动性所在的位置,并预测潜在的突破或假突破(猎取止损)。 利用时段重叠: 直观地识别高波动性时期,例如伦敦和纽约时段的重叠期,通常最大的市场变动就发生在此期间。 干净且优化: 采用轻量级代码构建,该指标不会拖慢您的终端。它具有内置的历史限制器,因此您只需查看所需的数据,而不会让您的图表杂乱无章。 主要特点: 动态高低价追踪: 该指标自动绘制一个包含您定义的时段最高价和最低价点的精确方框。随着时段的推进以及新高或新低的形成,方框会实时动态更新。 全面时间控制: 避免自动夏令时
FREE

CyberBot——您的专业八合一投资管理助手
Panel 8 Manager Analyzer 是一款功能强大的交易工具,其设计理念是打造一个可靠的 智能交易机器人 ——一个先进的交易助手,它整合了八位强大的投资经理,并同时运行。该系统旨在识别市场机会,并提供高度精准的分析,交易者可以将其作为决策的主要参考依据。 这款工具由一支经验丰富的市场分析师和讲师团队精心打造,他们在资本市场(尤其是衍生品领域)拥有数十年的专业经验,旨在提供高效便捷的交易体验。您无需再从零开始学习技术分析。无论您是新手还是经验丰富的专业交易员,Panel 8 Manager Analyzer 都能提供全面的支持,满足各种交易经验水平的需求。 Live Signals: > Xtreme Growth Engine V 5 One > Xtreme Growth Engine V 4 One > Xtreme Growth Engine X Bot V5 > Xtreme Growth Engine X Bot V4 可用版本: > EA CyberBot MT5 Inc 8Pairs 8TF 8
FREE

交易头寸和回测工具:
“交易头寸和回测工具”又称“风险收益比工具”,是一款全面而创新的指标,旨在提升您的技术分析和交易策略。 风险工具是外汇交易中有效风险管理的全面而用户友好的解决方案。它具有预览交易头寸的能力,包括入场价格、止损(SL)和获利水平(TP),为即将进行的交易提供透明的视图。用户友好的面板配备了自动余额和自定义余额选项,以及自动手数和风险计算。它支持各种交易预览,包括市场买入和卖出、买入止损和卖出止损订单。该工具包括高级的风险收益比特性,允许在图表上任意定制移动,包括买入和卖出设置。交易信息的智能显示包括关键细节,如开仓手数、止损、TP和订单类型。它还提供了在移动SL或TP水平时自动调整风险的便利性,一个按钮将当前价格吸引过来的功能,以及一个热键用于轻松隐藏和显示风险工具。此外,该工具提供了进行彻底分析交易策略的回测能力。
特点:
- 预览交易头寸,包括入场价格、止损(SL)和获利(TP)水平的详细信息。 - 用户友好的面板:提供自动余额和自定义余额。 - 自动手数计算和风险计算。 - 各种类型的交易预览:市场买入和卖出、买入止损和卖出止损订单等。 - 高级风险收
FREE

MACD 日内趋势是通过改编自 Gerald Appel 在 1960 年代创建的原始 MACD 而开发的指标。
通过多年的交易,观察到通过使用斐波那契比例更改 MACD 的参数,我们可以更好地呈现趋势运动的连续性,从而可以更有效地检测价格趋势的开始和结束。
由于其检测价格趋势的效率,还可以非常清楚地识别顶部和底部的背离,从而更好地利用交易机会。
请务必尝试我们具有可配置功能和警报的专业版本: MACD Intraday Trend PRO
特征 适用于任何货币对 在任何时间范围内工作 适用于 Renko 图表
如果您仍有疑问,请通过直接消息与我联系: https://www.mql5.com/zh/users/robsjunqueira/ ----------------------------------------- 如果可能,请留下您的评论和评论,以帮助向社区传播信息。 还可以了解我们的其他指标和专家顾问。 我有几种有用的指标和专家顾问。 如果您有任何建议,请随时提出建议,这样我才能改进产品,使持续改进永无止境。
FREE

Hull Trend Flip identifies the moment the Hull Moving Average changes direction — giving you a clean, visual signal exactly when momentum shifts. The HMA is one of the fastest trend-following moving averages available, minimising lag while remaining smooth. Hull Trend Flip builds on this by splitting the line into two colours — lime when rising, red when falling — and firing an arrow on every confirmed flip , so you never miss a trend change at a glance. Features Hull Moving Average wit
FREE

MA EMA Cross Risk EA 是一款适用于 MetaTrader 4 的交易智能顾问,专为希望使用清晰、合理且可视化透明的移动平均线交叉策略进行交易的用户而设计。 该智能顾问基于技术分析中最经典的理念之一:快速与慢速 MA/EMA 的交叉。当市场方向发生变化时,移动平均线可以帮助识别这一时刻,减少不必要的市场噪声、情绪干扰以及手动寻找信号的需要。 智能顾问会自动监控移动平均线或指数移动平均线的交叉,并按照预设规则开仓。用户可以自行选择均线类型、周期、止损、止盈以及每笔交易的风险比例。因此,该智能顾问既适合稳健的系统化交易,也适合在不同市场环境下进行积极测试。 MA EMA Cross Risk EA 的核心理念是交易纪律。该智能顾问不会随机交易,不使用马丁格尔策略,也不会在缺乏控制的情况下增加交易手数。持仓规模根据用户设定的账户资金风险百分比自动计算,有助于即使在连续亏损的情况下,也能保持风险管理的可控性。 产品特别重视可视化功能。图表上会显示 MA/EMA 线,以及当前持仓的止损和止盈水平。用户可以清楚地看到交易信号产生的原因、风险所在的位置以及目标价位。 智能顾问主要功
FREE
False Breakout MT4 是一个用来识别价格短暂突破最近支撑/阻力后迅速回到原来区间的情形的指标。这类“假突破”对主观分析或逆势策略很有价值,提供清晰的视觉提示,但不做预测性或自动化交易决策。 主要功能: 自动检测近期高低点附近的假突破(例如:扩展的日线水平覆盖两天)。 通过箭头和趋势线段清晰标注失败突破的价格动作。 可定制的提醒:弹窗和推送通知(需配置好接收设备)。 用户可调参数:扫描的K线数量、点差容忍度、箭头偏移、颜色等。 轻量级实现,优化以提升执行速度与回测表现。 不含预测算法:不提供保证的信号,仅辅助技术判断。 兼容性: 时间框架:M1 到 H4。 交易品种:外汇、指数、股票、大宗商品。 说明: 本版命名为 False Breakout MT4 。如果需要 MetaTrader 5 版本,请访问: https://www.mql5.com/en/market/product/145504 免责声明: 交易结果没有保证。此指标用于突出价格行为,应与风险管理和完整交易策略结合使用。 假突破, 假突破 mt4, mt4 假突破, 失败突破 mt4, 虚假突破 mt4,
FREE

External Range Liquidity - Market Structure Mapper (外部区间流动性 - 市场结构映射器) 客观解读市场结构是任何成功交易策略的基础。然而,手动识别波段高点/低点(Swing Highs/Lows)、更高的高点 (HH) 或更低的低点 (LL) 通常带有主观性和混乱感,尤其是对新手交易者而言。 External Range Liquidity 指标是您的完整解决方案。该工具可直接在您的 MT4 图表上自动检测并标出这些至关重要的市场结构点。它为您提供清晰的视觉地图,以高精度读取趋势、识别止盈目标并寻找潜在的流动性扫荡区。 主要特点与优势: 自动化市场结构映射: 消除您分析中的疑虑。该指标智能地将每个价格波动标记为高点 (H)、低点 (L)、更高的高点 (HH)、更高的低点 (HL)、更低的高点 (LH) 和更低的低点 (LL)。这有助于您客观地确认市场趋势(上升趋势/下降趋势)。 识别外部区间流动性目标: 绘制的每个波段高点和波段低点都代表一个外部区间流动性区域,这通常充当价格磁铁。将这些水平用作设置止盈的逻辑参考点。 分析潜在扫荡与反
FREE

Magic Grid is an indicator-free advisor that uses a grid strategy. The strategy is based on automatic reopening of grid pending orders, after closing their market positions (by Take-Profit, Stop-Loss or manually). Pending orders are placed with a specified step from the initial prices, which can be entered manually or generated automatically ( one time at the beginning of the trade ). The robot can trade on any time frame, on any currency pair, on several currency pairs, and on any number of di
FREE

Safe Trading with a $500 Account This Expert Advisor (EA) has been carefully engineered for traders who prioritize capital protection, disciplined risk management, and sustainable long-term profitability over aggressive, high-risk trading. Rather than pursuing unrealistic returns, the EA is designed to achieve consistent performance by maintaining a conservative approach to every trade. The recommended minimum trading capital is $500 USD . With this account size, the EA automatically start
FREE

JONUX FRVP — Fixed Range Volume Profile for MT4
JONUX FRVP is an analytical tool designed to visualize volume distribution within the MetaTrader 4 platform. Unlike standard volume indicators that are statically bound to chart periods, this utility employs an interactive engine to analyze the volume traded at specific price levels over a user-defined custom time range.
Concept & Functionality The indicator calculates a histogram of volume across user-defined price bins and highlights key struc
FREE

基本供求指标是 一款功能强大的工具,旨在加强您的市场分析,帮助您在任何图表上识别关键机会区域。这款免费的 Metatrader 指标拥有直观易用的界面,能让您清楚地了解供需区域,从而做出更明智、更准确的交易决策/ 免费 MT5 版本 该指标的仪表盘扫描器: ( Basic Supply Demand Dashboard )
功能特点
该指标可自动扫描图表中的供需区,无需进行繁琐的手动分析 图形显示距离最近的供应区和需求区的剩余距离 供应区以一种独特的颜色突出显示,而需求区则以另一种颜色显示,便于快速准确地进行解读 该指标会自动计算最近的供应区或需求区与图表上当前价格之间的距离(以点为单位),为您提供清晰、可量化的参考。以点数为单位的距离会清晰地显示在图表上,让您可以快速识别与当前价格有较大或较小距离的区域 在接近或突破供需区时发出警报 适用于任何时间框架 可选择深色或浅色主题,自定义图表显示效果
如何使用
建议使用 M1 和 M5 时间框架。观看下面的视频,了解其工作原理。
FREE

介绍 Stoch RSI MT4,一种创新的交易指标,旨在通过将 Stochastic 振荡器的优势与相对强弱指数 (RSI) 结合,增强您的交易策略。该工具非常适合新手和经验丰富的交易者,提供对市场动量和趋势反转的关键洞察。 使用 Stoch RSI MT4,您可以通过识别最佳的进出点做出明智的交易决策。该指标提供了一种独特的交易时机把握方法,使用户能够利用潜在的市场变化并最大化盈利。 MQL产品安装指南 | 在 MT4/MT5 上更新已购买的MQL产品 | 常见故障排除指南 | 指标设置 / 指南 主要特点 信号生成:利用 Stochastic 振荡器和 RSI 来测量市场状况和动量变化。 买入/卖出信号:当市场条件表明超卖水平时触发买入信号,在超买水平时触发卖出信号。 无重绘:确保提供的信号保持有效,事后不会改变。 图表上的仪表板:在图表上直接显示用户友好的实时信息面板,便于快速参考。 弹出警报:通过 MetaTrader 弹出窗口发送警报通知,提醒用户重要的交易信号。 推送通知:实时警报发送到您的移动设备,让您随时监控交易。 电子邮件警报:在关键信号事件上发送电子邮件通知,便于
FREE

RelicusRoad SuperTrend 是适用于 MetaTrader 4 和 MetaTrader 5 的 SuperTrend 指标,在上升趋势中于价格下方、在下降趋势中于价格上方绘制一条基于 ATR 的跟踪线。 这是经典的 SuperTrend 算法,没有附加任何其他内容:上升一条线,下降一条线,没有箭头、标签或面板。 工作原理 对每一根 K 线,指标取中位价,即该 K 线最高价与最低价的中点,并在其上下方各设定若干个平均真实波幅(ATR)单位的通道带。当收盘价高于上一根 K 线的上轨时,趋势转为上升;当收盘价低于上一根 K 线的下轨时,趋势转为下降。在这两个事件之间,趋势方向不会改变。 Uptrend:下轨以上升颜色(默认绿色)绘制在价格下方。 Downtrend:上轨以下降颜色(默认金黄色)绘制在价格上方。 Flip:当前活跃的线结束,留出一根 K 线的空白,另一侧的线随之开始。 No neutral state:每一根被计算的 K 线都属于上升或下降一侧,没有中性状态。 SuperTrend 线只会顺着趋势移动。在上升趋势中,下轨可以上升但不会下降,因此它会在价格后方
FREE

QCL Structure Trail for MetaTrader 4 QCL Structure Trail combines confirmed market structure breaks with a volatility-based trailing line. It helps traders identify directional changes and follow price movements through a clear display directly on the chart. How It Works The indicator identifies confirmed swing highs and swing lows using the selected Pivot Confirmation Length. A bullish signal appears when the closing price crosses above the latest confirmed swing high. A bearish signal appears
FREE

该指标用于显示平面和趋势位置。 该设计基于振荡器。 它被用作一个额外的过滤器,既用于常规图表上的交易,也用于二元期权。 平的地方用于指标 UPD1 Volume Cluster 按照智能货币的概念进行交易 。 内置的警报信号最大的超买/超卖的地方。
输入参数 。
基本设置 。 Bars Count - 指定指标将显示在其上的条数 。 Period - 选择振荡器的周期 。 Start Flat After Bar - 趋势结束后要忽略多少条才能开始平图 。
视觉设置 。 Color - 自动或手动 。 Floor Color - 如果颜色是"手动"设置的,那么您可以设置自己的颜色 。 Histo Width (0 - Auto) - 选择直方图的厚度或设置自动模式 。
Alert Settings 。 Alert - 启用/禁用通知设置 。 Alert Work Time - 指定警报将处于活动状态的时间段 。 Alert Pop Up - 启用/禁用警报弹出 。 Alert Push - 启用/禁用手机通知 。 Alert E-mail - 启用/禁用电子邮件通知 。
FREE

我们的基本蜡烛图形态指标让识别主要蜡烛图形态变得前所未有的简单。只要看一眼图表,就能发现锤子、黄昏之星、三白兵等形态。凭借直观的界面和清晰的视觉提示,我们的指标可帮助您快速准确地识别交易机会/ MT5 版本
该指标的仪表盘扫描器:( Basic Candlestick Patterns Dashboard )
指标特点 准确性 : 自动识别主要蜡烛图形态,无需手动搜索。 自定义 : 根据自己的交易偏好调整参数,以适应自己的交易风格。
包括谐波形态 看涨形态 Hammer Inverse hammer Bullish engulfing Morning star 3 White soldiers 看跌形态 Hanging man Shooting star Bearish engulfing Evening star 3 Black crows
主要输入 Show only confirmed patterns :该选项允许仅显示已被蜡烛图确认的形态,建议将其设为默认值。 Max bars :计算指标时需要回溯的条数。 Pop-up alert: 向 MT4 终端发出警
FREE

Wave Reversal Indicator - determines the direction of trend waves and price reversals.
The indicator shows wave movements and trend directions. It gives recommendations where to follow the trader, helps to follow the trading strategy.
It is an addition to an intraday or medium-term strategy.
Almost all parameters are selected for each time frame and are changed automatically, the only parameter for manual adjustment is the wavelength.
Works on various trading instruments and timeframes, recomme
FREE

MT4 市场结构转变与公平价值缺口 (FVG) 指标 此 MT4 指标可识别市场结构转变和公平价值缺口 (FVG),为交易者提供潜在的交易机会。它通过移动通知提醒用户注意这些事件,使他们能够快速应对不断变化的市场状况。 主要特点: 市场结构转变检测: 根据高低点突破和相对于平均值的显着蜡烛体大小,识别看涨和看跌的市场结构转变。 在图表上用向上/向下箭头可视化。 公平价值缺口 (FVG) 识别: 根据过去三根蜡烛的价格走势,检测看涨和看跌 FVG。 FVG 在图表上以彩色矩形突出显示。 移动通知: 接收关于市场结构转变和 FVG 形态的实时移动通知,确保您不会错过潜在的交易设置。 可自定义参数: 回顾期 (Lookback Period): 调整高低点计算的回顾期,以微调指标对市场变化的敏感度。 位移因子 (Displacement Factor): 控制有效市场结构转变信号所需的最小蜡烛体大小,相对于平均体大小。 最小 FVG 大小 (Minimum FVG Size): 设置 FVG 被认为显着的最小大小(点数)。 这是一个关键参数,取决于资产和您经纪商的定价。 蜡烛体大小 (Ca
FREE
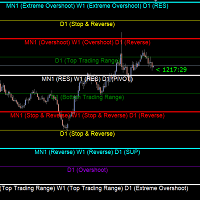
Gold Levels MTF - this is a fine stock technical indicator. The indicator algorithm analyzes the movement of the asset price, displays price levels of support and resistance from all time frames (TF) using the Murray method based on the Gann theory. The indicator indicates overbought and oversold fields, giving an idea of possible reversal points and at the same time giving some idea of the strength of the current trend. Description of levels: (Extreme Overshoot) - these levels are the ultimat
FREE
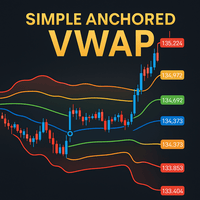
Simple Anchored VWAP is a lightweight yet powerful tool designed for traders who want precise volume-weighted levels without complexity.
This indicator lets you anchor VWAP from any point on the chart and instantly see how price reacts around institutional volume zones. MT5 Version - https://www.mql5.com/en/market/product/155321/
Join To Learn Market Depth - https://www.mql5.com/en/channels/suvashishfx Using VWAP bands and dynamic levels, the tool helps you understand where real buying and s
FREE

Title : Trade Assistant Manager for MT4
Trade Assistant Manager — See your risk before you click Trade Assistant Manager is a MetaTrader 4 chart utility for discretionary traders who want a clear, visual way to size positions . Place your Entry, Stop Loss, and Take Profit directly on the chart. The panel shows the lot size, the money at risk, the profit target in money, and the reward-to-risk ratio — updated as you move the lines.
What you gain Faster decisions : - Automatically calcu
FREE

Heikin Ashi Smoothed – MT4指标 Heikin Ashi Smoothed 是一款适用于 MetaTrader 4 (MT4) 的自定义指标,在传统的平均线蜡烛图基础上,通过加入额外的移动平均平滑处理,让趋势显示更加平滑直观。该方法极大减少了图表噪音,使得主趋势和可能的反转信号更加清晰,有助于把握市场方向。 主要特点 在图表上显示经过进一步平滑处理的 Heikin Ashi(平均足)K线,更清晰地反映价格走势 有效过滤小幅波动与虚假信号,趋势一目了然 更容易识别趋势反转,帮助避免因市场噪音导致的多余交易 适用于所有时间周期和任何品种(包括外汇、CFD、指数等) 计算轻巧高效,可在多图表、多周期下流畅运行 原理说明 Heikin Ashi Smoothed 首先计算标准的平均足四价(开盘、高点、低点、收盘),然后在此基础上再应用移动平均(如SMA或EMA)进行二次平滑处理。最终在图表上展现出极其平滑的K线,使细小波动被最大限度压制,主趋势方向更加明显。
通过不同的颜色和形状,趋势方向和强度一目了然,有助于持仓信心和避免因短期回调而频繁操作。 适用对象 采用趋势跟随
FREE

对于那些总是想了解帐户当前情况的人来说,此信息指示器将很有用。该指标显示诸如利润点数、百分比和货币等数据,以及当前货币对的点差以及柱在当前时间范围内收盘的时间。 MT5版本 - 更多有用的指标
有多种选项可用于在图表上放置信息线: 价格右侧(运行在价格后面); 作为评论(在图表的左上角); 在屏幕的选定角落。 还可以选择信息分隔符: | / 。 \ # 该指标具有内置热键: 键 1 - 退一步显示信息类型(价格、评论或角落的右侧) 关键2——信息显示类型的进步 键 3 - 更改信息行显示的位置 可以在设置中重新分配热键。 该指标易于使用且信息丰富。可以在设置中禁用不必要的信息项目。
设置 替换显示信息的热键(向后) - 后退信息显示类型 用于替换显示信息的热键(前进) - 信息显示类型向前迈进了一步 用于更改外观/角信息字符串类型的热键 - 更改信息行显示的位置 文字颜色 - 文字颜色 盈利颜色 - 有浮动利润时的文字颜色 失色 - 存在浮动损失时的文本颜色 分离器 - 一行中的数据分隔符。可以采用五个值:“|”、“/”、
FREE

SWING HIGHS LOWS DETECTOR
Swing Detection with Divergence Analysis
--------------------------------------------------
Identify swings. Spot divergences. Trade with confluence.
--------------------------------------------------
WHAT THIS INDICATOR DOES
This indicator automatically detects structural swing highs and lows using configurable depth and deviation filtering. It then analyzes RSI and MACD to detect regular and hidden divergences between consecutive swings of the same type.
Diver
FREE

介绍 SuperTrend MT4,一款尖端指标,旨在帮助交易者精准识别市场趋势。无论您是 forex、股票、加密货币还是商品交易者,这款强大的工具提供清晰的买入和卖出信号,使您能够做出明智的决策,最大化您的交易成功。 使用 SuperTrend MT4,您在交易策略中获得了显著的优势。用户报告称趋势检测的准确性得到了提升,使他们能够有效地把握进出场时机。通过利用实时警报和可自定义设置,您可以适应市场变化,改善整体交易表现。 MQL产品安装指南 | 在 MT4/MT5 上更新已购买的MQL产品 | 常见故障排除指南 | 指标设置 / 指南 主要特点 缓冲区集成:将指标值作为可访问的缓冲区暴露,以便使用 Expert Advisor 进行基于信号的自动交易。 快速且可回测:基于 MetaTrader 的原生 OnCalculate() 引擎构建,快速计算并与策略测试器兼容。 弹出警报:在信号事件上触发 MetaTrader 警报弹出窗口,确保您不会错过交易设置。 推送通知:实时向您的移动应用发送通知,让您随时随地监控交易。 电子邮件警报:提供信号事件的电子邮件通知,使您在远离终端时也能进
FREE
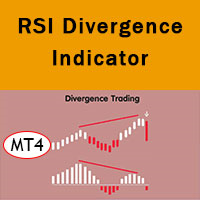
RSI divergence indicator finds divergences between price chart and RSI indicator and informs you with alerts (popup, mobile notification or email). Its main use is to find trend reversals in the chart. Always use the divergence indicators with other technical assets like support resistance zones, candlestick patterns and price action to have a higher possibility to find trend reversals. Three confirmation type for RSI divergences: RSI line cross 50 level (doesn't repaint) Price returns to
FREE
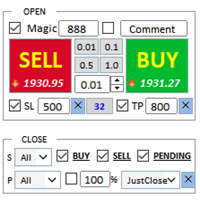
交易助手 : 购买 交易助手-MT4(点击下载) 购买 交易助手-MT5(点击下载)
操作说明文档,请仔细阅读
基本使用设置 基本: 支持语言的选择切换(目前支持中文和英文) 自动识别语言 支持 热键开平仓 绑定, 使用快捷键进行快速开平仓...... 快捷键平仓.支持最大30多种热键 解锁支持大部分功能 复盘 操作,可以在 测试环境下使用 开仓平仓区域: 一键开仓( 包含止盈止损的便捷设置,手数自动计算等便捷功能) 一键平仓 (锁仓),极简的风格设计,可以自由选择平仓品种,平仓类型(多单,空单,或者挂单),是否平仓盈利大于0的订单,是否平仓亏损订单,平仓比例的设置(0~100%),且是否平仓反向,以及锁仓功能,均在选项中可以直接实现操作. 多键平仓 划线开单控件 计算出多单或者空单的 平均持仓价格 并划线 止盈止损等自动 设置 多品种,多,空,分类平仓 .. 挂单区: 批量间隔挂单 功能。
批量挂单删除 功能 自动化功能区: 止损保护功能 移动止损功能 账户风控 利润保护 批量图表打开 商品信息显示区: 显示商品重要信息 全品种信息显示 商品信息显示区: 显示商品重
FREE

借助 MT5 的究极均线交叉指标(Golden Cross MA),精通移动平均线交易! 如果您喜欢使用移动平均线交易,这个指标将成为您的最佳助手。它的功能如下:当快速移动平均线与慢速移动平均线相交时,它能识别出高效的交叉设置。它通过多种方式通知您:在终端触发弹窗警报、向您的手机发送推送通知,以及将电子邮件直接发送到您的收件箱——现在您绝对不会错过任何交易机会。 这是专为喜欢移动平均线的交易者打造的工具。无需守在屏幕前——它会告诉您何时该采取行动。如果您想进行实验,这些参数将帮助您将其调整用于低时间周期的剥头皮或长期的波段交易。该指标具有高度优化、快速的代码,可以轻松集成到您的交易机器人中。 为了确保最高准确性,信号和警报严格在K线收盘时生成。该指标不会在同一个价格柱内重复生成信号——每个确认的突破您只会收到一次通知。为了保持图表干净,信号箭头被巧妙地放置在突破K线的高低影线之外,这意味着您的价格行为永远不会被遮挡。这种系统有助于避免冗余,消除了虚假重绘,并允许您纯粹专注于确认的数据。 您的反馈对我非常重要。您有任何问题或想分享您的看法吗?写下评论或发送消息——我随时在线! 指标参数
FREE

EMA Trend Robot is a powerful expert advisor designed to follow strong directional movement using dual EMA confirmation. It avoids weak ranges, waits for clean trend setups, and executes trades with smart logic based on momentum, price strength, and volatility. The EA includes built-in Stop Loss, Take Profit, and optional Trailing Stop to protect profits and reduce emotional trading. Suitable for beginners and professionals, it works on Forex pairs, GOLD, and major indices. Its goal is simple —
FREE
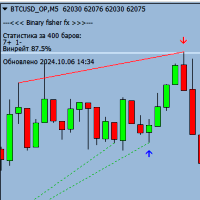
二元 Fisher FX 是一款功能强大的二元期权指标,适用于任何时间范围和任何货币对。该指标旨在识别趋势走势,并在当前蜡烛收盘前以箭头的形式指示进入点。
该指标的主要特点:
适用于任何时间范围(M1、M5、M15、M30、H1、H4、D1) 支持任何货币对 到期时间从 1 到 3 根蜡烛(默认 1 根蜡烛) 以箭头形式指示当前蜡烛收盘前的入场点 根据趋势工作,让您能够识别强劲的移动市场 重要信息:
为了使指标正常工作,您需要在终端文件夹中下载并安装“MQL5”文件夹。您可以从以下链接下载带有指标的文件夹: https://disk.yandex.ru/d/DPyo0ntaevi_2A 使用二元 Fisher FX 指标的优点:
通过准确识别趋势走势来增加盈利交易的可能性 适用于任何时间范围,这使您可以将其用于各种交易策略 支持任何货币对,扩大交易机会 立即尝试二元 Fisher FX 指标,增加您在二元期权交易中成功的机会!
FREE

Draw On Liquidity (DOL) – PDHL, PWHL & Kill Zones (引向流动性 - 前高低点与核心交易时段) 流动性水平通常充当价格变动的磁铁。前一日高低点 (PDHL) 和前一周高低点 (PWHL) 是止损单和机构活动倾向于集中的关键参考点。手动识别这些水平既耗时又容易出错。 Draw On Liquidity (DOL) 指标可在您的图表上自动绘制这些基本水平,并通过核心交易时段 (Kill Zones) 突显高概率交易窗口。凭借完全自定义选项,它提供了一个干净、专业且信息量极大的显示界面,以增强您的交易决策。 主要特点: 自动绘制 PDHL 和 PWHL: 精准且即时显示前一日和前一周的高点/低点。 流动性区可视化: 清晰查看价格可能将流动性池作为目标的区域。 核心交易时段 (Kill Zones): 标记东京、伦敦和纽约时段并提供可自定义的时间,让您专注于最活跃的交易小时。 完全自定义: 调整颜色、线条样式、粗细和标签,以匹配您首选的图表设置。 干净且用户友好: 所有输入都经过逻辑分组,无需图表杂乱即可快速设置。 它如何帮助您: 省去手动绘制线
FREE

Stratos Bora is a trading robot for the trading on forex. Designed to harness the power of the Ichimoku Kinko Hyo indicator, it offers 12 strategies to cater to every trader's style.
Whether you're a seasoned trader or just starting out, Stratos Bora provides a seamless trading experience, ensuring you're always at the forefront of market opportunities.
Important Information Revealed Leave a review and contact me via mql5 message to receive additional set files ! Do you want a powerful EA? Ch
FREE

Greed Advisor v3 是一款适用于 MetaTrader 4 的灵活网格交易 EA。它适合希望完全控制订单链,并理解网格和马丁格尔风险的交易者。 使用方式很直接:设置每日盈利目标,选择起始手数模型,配置网格级别,然后由 EA 管理订单篮子。当达到设定盈利目标时,EA 会尝试关闭当前订单篮子。 风险提示: 本 EA 使用网格/马丁格尔逻辑。递增手数可能造成较大回撤,风险控制不当可能导致账户亏损。 工作原理 在自动模式下,当价格突破前一日 High 或 Low 时开第一笔交易。突破前一日 High 开 Buy,跌破前一日 Low 开 Sell。 如果第一笔交易进入浮亏,EA 可以建立后续网格订单。每个网格级别都可以单独设置距离、方向规则和手数倍数。下一笔订单可以同向,也可以反向。 网格最多可包含 12 个订单。整个订单篮子作为一个交易周期管理,并可在达到盈利目标时关闭。 主要设置 Profit - 订单篮子盈利目标,占账户余额百分比。 Lot - 基础手数。 Balance - 用于计算基础手数的资金单位。 Max_Orders - 单个网格周期最大订单数量。 First_Tr
FREE

SilvMAT EA - XAGUSD 白银自动交易系统 SilvMAT EA 是 Marc Albrecht Trading 专门为 XAGUSD 开发的 Expert Advisor,结合自动 Cycle Trading、神经网络入场逻辑、可配置 Grid、利润保护和账户级风险控制。 优化品种: XAGUSD Timeframe: M15 推荐环境: RoboForex ProCent + KXTL Live MAT Trading Account 可通过我们的 MQL5 Signal 查看一个 Live MAT Trading Account: https://www.mql5.com/zh/signals/2389532 专门为 XAGUSD 开发 SilvMAT EA 专门针对白银,不是通用 Multi-Symbol 系统。XAGUSD 有自己的 Volatility、Spread、Liquidity 和 Session 特性,因此策略围绕白银条件进行校准。 SilvMAT EA 将神经网络入场分析与动态 Cycle Management 和可配置 Trading Cont
FREE

使用指南
帮助您了解指标的工作原理以及 Smart Money Concepts(聪明钱概念)背后的逻辑。 指标设置指南 // 如何使用 SMC
Smart Market Concepts - 适用于MT4/MT5的全能型SMC指标:市场结构、订单块、FVG、价格区间、交易时段、斐波那契/OTE及警报功能。// MT5版本 该指标将20余种指标整合为单一“全能”工具,实时展示市场结构——包括内部及震荡的BOS/CHoCH水平、订单区块、溢价与折价区域、等高点与等低点、公允价值缺口、多时间周期的高点与低点、斐波那契/OTE水平、交易时段等丰富内容。该指标聚焦于“聪明钱”概念,融合了“内圈交易者”分析等先进交易策略以及基于“聪明钱”理念的交易策略,旨在揭示大型机构的运作机制并协助预测其动向。 “聪明钱”概念通过追踪结构如何被打破以及反应区(订单区块、供需失衡、前期高低点、交易时段窗口)可能形成的位置,帮助价格走势交易者绘制流动性分布图和关注区域。该指标将大部分标注工作自动化,让您减少绘图时间,专注于分析。 可选的警报模块会在相关 SMC 条件触发时(如结构破位、订单区块突破与触
FREE

[ My Channel ] , [ My Products ] , [ ABOUT ME ]
DiagonalResistanceIndi — 逆势信号指标
DiagonalResistanceIndi 专为 VolumeHedger EA 开发。用于 Gold 的 M1 周期。也适合在不使用 EA 的情况下进行手动交易。
这是一款信号指标,用于检测价格在短时间窗口内出现的异常大幅百分比波动,并在图表上标记该波动的潜在反转点。 工作原理
该指标在 M1 图表上持续扫描一个回溯时间窗口。窗口长度并不固定,而是根据市场波动率(基于 H1 ATR)自动调整。市场平静时窗口变宽,市场活跃时窗口变窄。当价格从窗口内的极值水平起超过设定的百分比阈值时,指标判定该波动已"过度拉伸",并产生反方向信号: 红色向下箭头 — 大幅上涨后的卖出信号 蓝色向上箭头 — 大幅下跌后的买入信号 黄色箭头 — 如果波动持续,显示加仓(grid)级别 金色圆点 — 逐根K线跟踪当前周期的目标(TP)水平;目标先按波动的既定回撤比例计算,随时间推移逐渐移向保本位。圆点序列结束处即为周期平仓位置。
FREE

The indicator analyzes the volume scale and splits it into two components - seller volumes and buyer volumes, and also calculates the delta and cumulative delta. The indicator does not flicker or redraw, its calculation and plotting are performed fairly quickly, while using the data from the smaller (relative to the current) periods. The indicator operation modes can be switched using the Mode input variable: Buy - display only the buyer volumes. Sell - display only the seller volumes. BuySell -
FREE

BB Sniper v6.00 BB Sniper is a trading expert advisor that implements a scalping strategy based on Bollinger Bands analysis. The advisor is designed for trading on M1 and M5 timeframes. The core trading logic involves identifying price touches of the Bollinger Bands boundaries. Signal filtering employs two additional confirmations: the Relative Strength Index (RSI) value and Supply/Demand zone analysis across multiple timeframes. After opening the initial position, the advisor builds a grid of o
FREE

UT Bot Signal Alerts MT4 is a trend indicator for MetaTrader 4 that draws an ATR trailing stop line. It puts a buy or sell arrow on the bar where the close crosses it, with pop-up, sound, push and e-mail alerts. It is a charting tool. It places no trades and does not touch your orders. Arrows and alerts come from closed bars only. The arrow of a closed bar does not repaint. It is based on the UT Bot Alerts script known from TradingView and uses the same maths. Standalone: everything is built in.
FREE

X1 Copy MT4 是一款简单可靠的解决方案,用于在单台电脑或 Windows VPS 上的 MetaTrader 终端之间快速同步交易。只需一分钟,您即可获得一个现成的工具,处理跟单过程中的所有技术繁琐事务,让您专注于交易本身。无论是跟单信号还是管理自己的账户,X1 都能确保极高的执行速度和精准度。 X1 Copy MT4 是一个完全独立的程序,包含了高质量跟单所需的所有基础工具。该程序专为在日常工作中追求可靠性和简洁性的交易者而设计。如果您的交易策略需要特定的风险管理工具(例如:自动手数缩放、自定义止损/止盈偏移或高级交易过滤),请关注我们的专业版 —— X2 Copy MT4,它专为处理更复杂的资金管理任务而设计。 功能特性 极速执行 — 终端间的交易传输延迟低于 1 秒 跨平台支持 — 完美兼容 MT4>MT4, MT4>MT5, MT5>MT4, MT5>MT5 之间的跟单 即时设置 — 直观的界面让您在 1 分钟内即可开启跟单 账户通用性 — 支持所有经纪商的任何账户类型(实盘、模拟、净额、锁仓)之间的跟单 多通道模式 — 支持从一个或多个 Master 账户跟单至一个
FREE

TV SuperTrend 是一款基于 ATR 的趋势跟随指标,适用于 MetaTrader 4。它会直接在图表上绘制清晰的看涨和看跌 SuperTrend 线,帮助交易者识别趋势方向、潜在趋势变化以及动态支撑或阻力区域。 该指标在趋势方向发生变化时,可选择显示买入和卖出箭头。它还支持终端提醒、推送通知和电子邮件通知,因此当新信号出现时,您可以及时收到提醒。 主要功能 基于 ATR 的 SuperTrend 计算
连续的看涨和看跌趋势线
趋势变化时显示买入和卖出箭头
可选的弹窗、推送和电子邮件通知
可调整 ATR 周期和倍数
可配置箭头偏移
适用于所有交易品种和时间周期
轻量且易于使用 输入参数 ATR period: 设置 ATR 计算周期。
ATR multiplier: 控制 SuperTrend 线与价格之间的距离。
Price source: 选择用于计算的价格来源。
Show buy and sell arrows: 启用或禁用图表信号。
Arrow offset: 调整箭头与蜡烛图之间的距离。
Alerts / Push / Email: 启用
FREE
Hi Trader, ================================================================================ If you like my indicator, please do not hesitate to give a review and/or comment. Thank you! ================================================================================
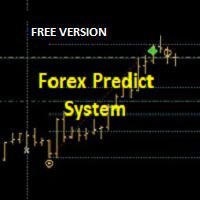
This indicator draws trade entry zone and target levels based on the levels of the previous day.
A blue zone (BUY) or red zone (SELL) is drawn and two targets. The optimal trade entry value is also indicated.
A second gray zone is
FREE

Quick Drawing MT4 – 终极一键画图工具(100% 免费) 厌倦了为了画一个简单的矩形或趋势线而不断浏览默认的 MetaTrader 4 菜单吗?对于依赖精度和速度的交易者——尤其是价格行为(Price Action)、聪明钱概念(SMC)、内部圈子交易者(ICT)、供需关系(SND)以及支撑阻力(SNR)交易者——每一秒都至关重要。标记图表应该是顺畅的,而不是一件繁琐的苦差事。 Quick Drawing 是一款轻量、高度可定制且绝对高效的图表内工具栏,旨在让您的技术分析如虎添翼。只需轻轻一击,您就可以立即在屏幕正中央生成格式完美的矩形和趋势线,随时准备拖动到您的兴趣点(POI)。 非常适合标记 订单块(OB)、公平价值缺口(FVG)、结构破裂(BOS)、 属性变更(CHoCH)、流动性空白(Liquidity Voids)以及关键的 SND/SNR 区域。 主要特点 一键执行: 直接从图表即时生成预配置的形状,无需打开任何下拉菜单。 自动居中生成: 再也不用寻找丢失的形状了!无论您在历史记录中向后滚动了多远,对象都会动态且精准地生成在可见图表区域的正中央。 自动选中
FREE

Stratos Zephyr is a cutting-edge trading robot designed for the forex market, leveraging the power of the Relative Strength Index (RSI) indicator. With 10 sophisticated strategies, Stratos Zephyr is engineered to cater to a wide range of trading preferences. Whether you are an experienced trader or just beginning your journey in the forex market, Stratos Zephyr offers a dynamic and intuitive trading experience, ensuring you stay ahead in the fast-paced world of forex trading.
Unlock Exclusive B
FREE

EA finds the largest volume in the market and determines the level for entry. After crossing the level towards the breakdown, a market order is opened. The EA builds a two-sided grid of orders, adapting to the market. Each direction of orders works separately and has its own take-profit. Thus, the adviser covers the whole trend, starting from its start, while the adviser perfectly passes the flat market condition, trading both directions. Please see all my products: https://www.mql5.com/en/user
FREE

Smart Color Level Drawing Indicator Smart Color Level Drawing Indicator 是一款简单而强大的 MT4 图表绘图工具,旨在帮助交易者快速、直观地标记 支撑位、阻力位、区域、水平线以及重要价格区域 。 无需反复打开 MT4 绘图菜单并手动设置对象,本指标提供了一个方便的 一键式图表绘图面板 。 主要功能 一键绘图面板 4 个可自定义的空心矩形 4 个可自定义的填充矩形 4 个可自定义的水平线样式 快速访问常用绘图工具 完全可自定义颜色 矩形边框颜色 矩形填充颜色 线条颜色 可调节线条样式和宽度 实线 虚线 点线及其他 MT4 支持的样式 线条宽度调整 可调节绘图尺寸 矩形宽度(K线数量) 矩形高度倍数 4 种面板位置 左上角 右上角 左下角 右下角 交互式绘图对象 创建的矩形和线条可以继续选择,因此您可以直接在图表上移动和调整它们。 适用场景 支撑与阻力 供需区域 价格区域 突破区域 入场与出场区域 交易时段标记 手动技术分析 图表视觉整理 快速价格水平标记 重要说明 本指标是一个 手动图表绘图工具 。 它不会自动生
FREE
MetaTrader市场是一个简单方便的网站,在这里开发者可以出售自己的交易应用程序。
我们将帮助您发布您的产品,并向您解释如何为市场准备您的产品描述。市场上所有的应用程序都是加密保护并且只能在买家的电脑上运行。非法拷贝是不可能的。
