 MetaTrader 5
 专家
专家
 指标
指标
 程序库
程序库
 实用工具
实用工具
 窗口小部件
窗口小部件
 规则
规则
适用于MetaTrader 4的免费EA交易和指标 - 8
 EA交易自动执行市场交易,而指标可使您更准确地分析报价并预测价格行为。
通过这些应用程序,您将能够更明智地在MetaTrader 4执行交易,抓住更多的交易机会。
EA交易自动执行市场交易,而指标可使您更准确地分析报价并预测价格行为。
通过这些应用程序,您将能够更明智地在MetaTrader 4执行交易,抓住更多的交易机会。 
1. Core Components & Visual Logic While this version is customized, it retains the five foundational pillars of the Ichimoku system, designed to provide a "one-glance" view of equilibrium, trend, and momentum. The Kumo (Cloud): The shaded area (orange and blue boundaries) acts as the primary filter. In this screenshot, the price is trading above the cloud , which signifies a dominant bullish trend. Tenkan-sen (Blue Line): This is the fast-moving signal line. When it is above the slower line, mom
FREE

该指标会实时扫描您的交易账户,分析已持仓单,并可选择是否计算挂单,然后通过数学方式计算出两个关键价格。 保本线(BE)
在该价格平仓后,您的总利润将正好为零。指标会计入手续费和库存费,避免您因为忽略交易成本而意外亏损平仓。 目标线(Target/TP)
价格需要达到该水平后,您才能获得指定金额的利润,例如正好 100 美元,或者获得账户余额的指定百分比,例如余额增长 2%。 两种计算模式,适合不同策略 您可以在设置中选择指标如何处理您的交易。 独立模式
非常适合对冲账户。指标会分别计算多单和空单。图表上会分别显示多单的保本线和目标线,以及空单的保本线和目标线。如果您双向交易或使用锁仓,非常适合该模式。 合并模式
非常适合净额结算账户以及锁仓交易。指标会将所有多单和空单合并计算,得出整体净头寸,并为该交易品种上的所有持仓显示一条统一的保本线和一条统一的目标线。 主要优势与功能 灵活的目标设置
您可以将目标利润设置为账户货币金额,例如 50 美元,也可以设置为当前余额的百分比,例如 1.5%。当余额变化时,指标会自动重新计算目标线。 精确计算
可选择是否计入库存费和手续费,使
FREE
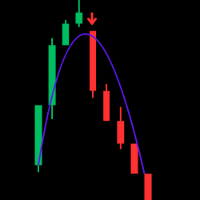
Trend WTS — Advanced Modular Trend & Signal Indicator for XAUUSD (M5 Optimized) Unlock precise trading insights with Trend WTS , a powerful and modular trend and signal indicator designed specifically for XAUUSD on the M5 timeframe. Built for traders seeking accuracy and clarity, Trend WTS combines fast moving average crossovers with a long-term EMA filter to deliver reliable buy and sell signals tailored for the gold market. Key Features: Dual Moving Average Trend Detection: Detect strong trend
FREE
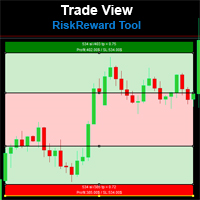
Risk Reward Tool , It is easy to use. With this tool you can see the rates of profit loss profit. You can see your strategy and earnings reward status of your goals.Double calculation can be done with single tool. Move with drag and drop. You can adjust the lot amount for calculations. The calculation results are shown in the comment section. There may sometimes be graphical errors during movements. Calculations works at all currency. Calculations All CFD works. Updates and improvements will co
FREE

The Bollinger Scalper EA is a fully automated Expert Advisor that trades based on Bollinger Band and RSI entry signals. The EA trades using market orders and uses averaging to safely turn otherwise negative trades positive. This EA works best on EURUSD using the M5 timeframe. A VPS is advisable when trading this system. Check the comments for back test results and optimized settings. Please note: I have made the decision to give this EA away and many more for free with limited support so that I
FREE
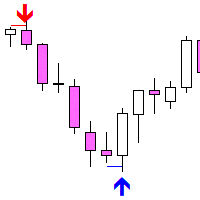
Fakey Detector — 假突破(Fakey)形态指标 Fakey Detector 是一个可以自动识别经典 Fakey(内部K线的假突破)形态的指标,并在图表上用箭头和突破水平线进行显示。 工作原理: Fakey 模式由三根K线组成: 母K线(Mother Bar) — 区间最大的K线 内部K线(Inside Bar) — 完全包含在母K线的范围内 Fakey K线 — 向上或向下突破,但又收盘回到范围之内 当满足设定条件时(包括可选的实体方向过滤器),指标会显示: 向下箭头 — 表示 Fakey Sell 信号 向上箭头 — 表示 Fakey Buy 信号 突破线 — 显示关键突破水平 ️ 参数设置: LookBackBars — 分析的K线数量 MinBreakoutPips — 最小假突破深度(点) UseBodyDirectionFilter — 启用对 Fakey 和 Inside K线实体方向的过滤 UseMotherBarBreakout — true 表示从母K线判断突破, false 表示从内部K线判断 特点: 不重绘 适用
FREE

Торговый робот предназначен для торговли криптовалютой по уровням Фибоначчи на рынке Форекс. Безопасность в торговле: постоянный стоплосс, тейкпрофит, защита от повышенного спреда, а лгоритм не использует опасные методы торговли - мартингейл, сетку и усреднение . Достоинством советника является торговля Мани Менеджмент (система управления капиталом) автоматический расчет лота на основе размера вашего депозита, автоматическая установка и перемещение уровней Фибоначчи. Установка отложенных ордеров
FREE

Magnet Wall 指标是一套适用于 MetaTrader 4 的非重绘、基于 ATR 的趋势通道系统。它在价格上方和下方绘制两条自适应带,这两条带像磁性“墙”一样:在趋势保持有效时将价格包裹在内部,一旦墙被突破就翻转到另一侧。K 线和通道会随当前趋势自动重新着色,在趋势反转的那一刻确认买入或卖出信号。该指标基于 Wilder ATR,支持可调倍数,采用非对称的突破‑锚定算法(不是标准 Supertrend),并内置完整的提醒功能:弹窗、推送通知、邮件和声音。 查看 MT5 版本: Magnet Wall MT5 查看更多产品: 所有产 品 想查看实盘示例和新工具,请访问我的个人主页并发送好友请求,以免错过任何更新! 工作原理 非对称 ATR 趋势通道 在每一根收盘 K 线上,指标会基于可配置的回溯周期(默认 5 根)计算 Wilder ATR,并乘以通道宽度倍数(默认 7.6),得到决定通道距源价格高低距离的“Δ”值。当源价格收盘在某一通道之外时,对应那一侧的“墙”会立即贴合到新的极值位置;当价格维持在通道内时,两侧“墙”保持不动。两条通道的中线就是趋势参考:中线向上倾斜表
FREE

Color Levels is a convenient tool for traders using a Trendline and a Rectangle in their technical analysis. It allows setting two empty rectangles, three filled ones, and two tredlines. The indicator parameters are very simple and divided into numbered blocks: The ones beginning with 1 and 2 - empty rectangle (frame) parameters; 3, 4, and 5 - filled rectangle parameters; 6 and 7 - trendline parameters. Simply click a desired object and it will appear in the upper left corner. Main Adjustable Pa
FREE

市场交易时段指标 全球市场交易时段可视化的必备工具 市场交易时段指标是一款强大的MT4工具,旨在帮助交易者在图表上直观显示主要外汇市场交易时段。通过清晰展示悉尼、东京、伦敦和纽约市场的活跃交易时间,这一指标帮助您识别最佳交易时段并了解市场波动模式。 主要特点: 清晰显示四个主要交易时段(悉尼、东京、伦敦、纽约) 用彩色垂直线标记时段的开始和结束时间 每个市场时段可自定义颜色 可调整的线条样式和宽度,提高可视性 时段标签位于图表底部,便于快速参考 自动或手动GMT时差计算 完全可自定义的时段时间 优势: 轻松识别时段重叠,通常在这些时段市场波动性增加 根据特定市场时间规划交易 了解哪些金融中心正在驱动当前价格走势 基于历史时段表现优化交易策略 适合初学者和经验丰富的交易者使用 该指标适用于任何时间框架和货币对,是每位希望将交易与全球市场时间保持一致的外汇交易者的必备工具。
FREE

Draggable Previous Candle Alert - Breakout Alert Indicator for MT4 & MT5
Draggable Previous Candle Alert is a powerful breakout indicator that automatically plots two draggable horizontal lines at the High and Low of the previous candle. Unlike standard high low indicators, you can drag the lines to any price you want - perfect for manual support and resistance, supply and demand, and breakout trading.
This is the best tool for traders who trade previous candle breakout, daily high low breako
FREE

Renko charts. This is not timeframe based indicator. Works with close prices. External parameters: BrickSize - each brick size, 10 by default. PriceColor - Bid line color, white by default. UpColor - up brick color, LimeGreen by default. DnColor - down brick color, Crimson by default. BarsCount - bars amount to work with (0 by default - for all available). Alerts - alerts on trend change (true/false), false by default.
FREE

MACD MTF Timeframe Independent Colorized is a MetaTrader 4 indicator designed to make MACD momentum easier to read while allowing the MACD calculation timeframe to be completely independent from the chart timeframe. Unlike a standard MACD that always follows the timeframe of the active chart, this indicator can calculate its values from a separately selected timeframe. For example, you can keep an M5 chart open while displaying an H1 or H4 MACD, making it useful for multi-timeframe analysis with
FREE

Wonder 8 属于 Wonder 系列,这些策略选自我自己的投资组合。 在 H1 周期交易 USDJPY,使用带自适应波动率过滤器的趋势衰竭模型。 它是什么,不是什么 每笔交易都带固定止损和止盈,风险始终明确。 无网格、无马丁格尔、无加仓摊平。同时只持一单,占用保证金低。 无神经网络、无人工智能、无量子字眼。基于规则、经过测试且诚实的系统。 无需优化:默认设置就是测试过的设置。 如何构建 系统化流程,而非对单一图表的曲线拟合:遗传生成、在从未用于构建的数据上验证、其他市场检验、点差压力和蒙特卡洛。2026 年用近期数据再次复核。 回测(固定 0.01 手,99% 建模质量) 2020-2026:149 笔交易,盈利因子 1.74,收益/回撤 7.4 最近 24 个月:37 笔交易,盈利因子 1.13 回测不是承诺。真实结果取决于你的经纪商,会有差异。 如何测试:打开 USDJPY H1 图表,默认设置,Every tick 或 1 minute OHLC。0.01 手 500 美元即可。 参数:mmLots(固定手数)、资金管理固定或按百分比、MagicNumber、ExitOnF
FREE

Vault Depth Indicator 是一款适用于 MetaTrader 4 的 不重绘 趋势工具,围绕三个可量化概念构建:通过脉冲引擎逐 K 线跟踪“信念力度”、使用平均绝对偏差的波动率自适应通道,以及通过饱和峰值回落发现结构性价格水平。该指标跟踪每根 K 线上多空参与度,在信念读数最强的位置自动种植价格区域,并在价格在冷却周期之后回踩这些区域时发出二次测试信号。趋势翻转箭头在确认的通道突破上出现,时机是确定性的——信号逻辑使用的是原始通道数值,而不是可选的平滑显示线,因此在刷新图表或切换周期后,信号位置可以一致复现。 查看 MT5 版本: Vault Depth MT5 更多产品请访问: 全部产品 想查看实盘示例和最新工具,请访问我的个人主页并添加好友,这样就不会错过任何更新! 工作原理 脉冲引擎(Pulse Engine) 指标统计“信念 K 线”——收盘价落在整根 K 线区间上方或下方 30% 且具有方向意图的蜡烛(收盘高于开盘为多头信念,收盘低于开盘为空头信念)。在每一根信念 K 线上,脉冲计数加 1(默认封顶为 8),在非信念 K 线上按 0.85 的步长衰减。
FREE

The Supertrend indicator available on the MQL5 Market for MetaTrader 4 is an exceptional tool for traders seeking to identify prevailing trends in specific trading instruments. This indicator boasts two built-in indicators, Average True Range and Standard Deviation, allowing traders to choose the most suitable indicator based on their preferred trading strategy. Additionally, users can customize the period of these indicators and select the price (Close, High, Low, Open, Weighted) to which it s
FREE
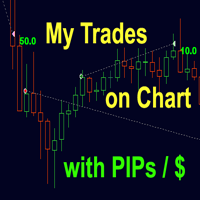
一个你不希望错过的交易工具。该指标在图表中显示所有的交易/交易,以及它所连接的符号。它打印出盈利或亏损的点数。根据选择,它通过子窗口打印一条垂直线,以便更好地进行分析。
也可以在这里查看专业版。我的交易历史专业版 https://www.mql5.com/en/market/product/50206
此外,它还增加了关于存款货币交易的总结果和总点数的信息。
你可以选择只显示当天的交易,或只显示一定数量条内的交易。
它可以显示有指定魔数的交易。如果该值被设置为0,指标将显示所有交易。如果您指定了一个专家顾问的魔数,它将只显示该专家顾问的交易。鼠标放在入口处的箭头会显示订单号,评论和魔力号码。
该指标主要与我的其他专门的货币强度指标之一一起使用。 https://www.mql5.com/en/blogs/post/679077
指标参数
===指标设置
显示垂直线(线穿过子窗口) 显示总利润(利润或损失,包括佣金和掉期)。 显示总点数 只显示今天 在条形图中显示(0=全部)(限制条形图的数量,0将显示全部)。 在角落里显示总结果(改变结果的角落) 魔术数字过滤器
FREE
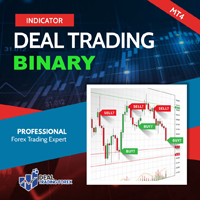
Binary Deal Trading Indicator is designed for MetaTrader 4 to assist traders in identifying potential market reversal and exhaustion zones, based on overbought and oversold conditions as well as fractal swing points.
The indicator provides visual reversal signals on the chart and can be applied to any timeframe, with M5 and M15 being the primary recommended charts.
Key Features
Designed for reversal and swing analysis on multiple timeframes.
Displays a preliminary warning alert one candle pr
FREE

Indicador SMART MONEY CONCEPTS DRAW Este indicador te permitirá dibujar de forma sencilla, rápida y fácil todos los conceptos de Trading Institucional e Smart Money Concepts basados en la terminología de The Inner Circle Trader (ICT) necesarios para realizar análisis técnico en tus gráficos de Metatrader.
Este indicador ha sido desarrollado por el equipo de TradingForexTV y lo entregamos totalmente gratis para toda nuestra comunidad y seguidores de nuestro canal y redes sociales.
Algunos de lo
FREE

Cristoforo Gold Rush: Your Ultimate Trading Ally Welcome, Traders and Investors! Join the Conversation: Telegram Channel for Cristoforo Gold Rush Step into the world of advanced trading with "Cristoforo Gold Rush," the ultimate trading ally engineered to navigate the complexities of financial markets with unmatched precision. In this comprehensive guide, discover how this state-of-the-art trading tool can elevate your strategies, turning every trade into an opportunity. Now Available ! Don't m
FREE

Optimal Strategy
Be your trading assistant MT Merit Candle Count :
Designed for binary options trading, Indicator counts the number of bullish or bearish candlesticks, making it suitable for both martingale and standard trading strategies.
It's ideal for experienced traders and applicable to Forex, helping to gauge volume and identify trends or potential reversals on the chart. Indicator for traders who prefer manual trading.
TRADE: Binary Option and Forex TIME FRAME: All Time Frame SYMBOL
FREE

The VWAP Level indicator is a technical analysis tool that calculates the weighted average price for the traded volumes of a specific asset. The VWAP provides traders and investors with the average price of an asset over a specific time frame.
It is commonly used by investors to compare data on "passive" trading operations, such as pension funds and mutual funds, but also by traders who want to check if an asset has been bought or sold at a good market price.
To calculate the VWAP level we us
FREE

FT Local Trade Copier (MT4) – Fast, Private Local Trade Copying Copy trades between MetaTrader terminals on the same PC or VPS—no cloud, no external servers, no DLLs. Lightning-fast, reliable, and completely private in local environment. MT5 version: https://www.mql5.com/en/market/product/195281 Why Traders Choose FT Local Trade Copier Blazing fast – Local copying with as little as 1 ms overhead. No waiting for cloud round trips. Totally private – No external servers, no internet bridge, no
FREE

Volatility Pullback Radar 是一个图表分析指标,用于显示当前整体趋势,并根据当前市场波动率衡量回调深度。 指标运行在其所加载图表的交易品种和时间周期上。 本指标不会开仓、平仓或管理交易。它用于提供趋势方向、回调深度和当前回调状态的信息。 工作原理 指标使用长期指数移动平均线作为整体趋势参考。默认周期为 200。 较短周期的指数移动平均线作为回调测量的参考水平。默认周期为 20。 Average True Range 用于衡量当前市场波动率。默认周期为 14。 当价格明显高于长期平均线时,趋势被分类为 Bullish。 当价格明显低于长期平均线时,趋势被分类为 Bearish。 长期平均线附近的一小段波动率调整区域被分类为 Neutral。 在 Bullish 趋势中,指标测量价格相对于较短参考平均线的向下运动。 在 Bearish 趋势中,指标测量价格相对于较短参考平均线的向上运动。 价格距离会与 Average True Range 进行比较,因此回调深度是相对于当前波动率进行衡量,而不是仅使用原始价格距离。 当前状态会被分类为 No Pullback、Sha
FREE

True Stochastic Divergence —— 高质量随机指标背离检测工具 大多数背离指标几乎会在每一个局部高点和低点产生信号,导致图表充满大量错误或意义不大的背离。 True Stochastic Divergence 采用专有过滤算法,对价格结构进行分析,仅显示最高质量的背离信号。它的目标并不是尽可能多地寻找背离,而是帮助交易者专注于真正重要的市场机会。 主要功能 自动识别随机指标(Stochastic)的看涨和看跌背离。 智能过滤虚假信号。 仅显示已确认的背离。 适用于任何交易品种和任何时间周期。 兼容 MetaTrader 4 和 MetaTrader 5。 支持 Push、电子邮件、弹窗和声音提醒。 支持普通背离(Regular)和隐藏背离(Hidden)。 选择随机指标线 与大多数同类指标不同, True Stochastic Divergence 允许您选择用于检测背离的随机指标线。 提供两种工作模式: %K 线 —— 使用随机指标主线检测背离。 %D 线 —— 使用随机指标信号线检测背离。 每种模式都有其自身特点,您可以根据自己的交易策略和市场分析方法选择最
FREE

风险交易面板是为手动交易而设计的. 这是发送订单的另一种方式。
面板的第一个特点是使用控制线方便地下订单。 第二个特征是在存在止损线的情况下计算给定风险的交易量。
使用热键设置控制行:
获利-默认情况下T键;
价格-默认情况下p键;
止损-默认情况下,S键;
您可以在交易面板的设置中自行配置密钥。
运算算法:
1)-我们把水平在所需的地方(这是没有必要把所有的水平);
2)-指定风险(可选);
3)-点击绿色发送订单按钮;
4)-我们正在等待下订单,或者会出现带有错误消息的警报;
5)-如果我们想关闭当前符号的所有订单,通过魔术链接到专家顾问,然后点击关闭订单按钮。
您不应该多次按下发送订单按钮。 一次就够了。 下单后,按钮将呈现"未按下"状态。
要发送带有风险计算的订单,需要设置止损线并在交易面板的"风险"字段中设置风险。 否则,订单将以当前交易工具的最低手数放置。
风险是从账户余额计算出来的. 由于经纪商对保证金交易细节的限制,不可能承担100%的风险。
在"风险"字段中允许小数(例如,您可以以余额的0.5%的风险进行交易)。
如果指定的风险低于允许
FREE

本指标绘制 累积成交量差(CVD) ——将每根K线的成交量按其收盘方向赋予正负后累加得到的滚动总和——并置于自适应标准差通道之中。它回答了单看价格无法回答的问题:这波行情是由参与度推动的,还是只是在漂移? 累积总和会在您选择的 锚定点 重新开始——按日、按周或按月——因此读数始终相对于当前的交易日、当周或当月,而不是相对于图表历史的起点。正是这一个设置,使同一个指标既适用于一分钟的外汇图表,也适用于日线的指数图表;也正是它,把本指标与那种只会从您历史数据碰巧开始之处不断累加的普通累积成交量线区分开来。 工作原理 每根K线将其成交量计入累积总和:收盘高于前一根收盘时相加,低于时相减,收平时不变。 随后在该累积序列上计算20周期的中轨及其标准差,上下轨则置于标准差的指定倍数处。由于通道由序列自身的波动性构建,参与度剧烈时通道变宽,趋于平稳时收窄——无需为每个品种重新调整固定阈值。 当累积总和到达锚定边界时会归零并重新开始。在图表上这表现为线条的一次干净重启,通道随即围绕新的周期重新成形。 通道说明什么 越出通道意味着相对于该品种近期的表现,成交量流向已变得统计意义上不寻常;回到通道内则意味
FREE

Candle Remaining Time 适用于 MetaTrader 4
不再错过K线收盘时刻 精准把握交易时机 MT4 精准倒计时工具 Candle Remaining Time Candle Remaining Time 是一款为 MetaTrader 4 设计的轻量级精准计时工具。它在图表上实时显示当前K线剩余时间。 该工具专为依赖K线收盘确认的交易者设计。无论您进行剥头皮交易 日内交易 突破交易 或价格行为交易 精准的时间控制都能提升执行效率 减少过早或过晚入场。 如果您的交易策略依赖K线收盘确认 这款工具必不可少。 为什么时间至关重要 许多交易系统需要等待K线完全收盘后再入场。如果没有可见的倒计时 交易者往往凭感觉估算时间 容易过早入场 从而产生假信号或不必要的亏损。 Candle Remaining Time 通过在图表上显示清晰的实时倒计时 消除不确定性。您始终可以准确知道距离K线收盘还有多少秒。 主要功能 实时K线倒计时显示 适用于所有时间周期 从M1到月线 兼容所有交易品种 包括外汇 黄金 加密货币 和指数 简洁清晰的显示界面 可自定义字体大小和位置 轻量级
FREE

这是免费产品,欢迎您使用以满足您的需求! 如果您喜欢这个指标,请留下简短的好评!非常感谢! .................................................... 点击这里查看高质量的交易机器人和指标! Crypto_Forex MT4 版“资金流量指数 (MFI) 带警报”指标,无需重绘。 - 资金流量指数 (MFI) 是一种技术震荡指标,它利用价格和成交量数据来识别超卖和超买区域。 - 内置电脑和移动设备警报,适用于:进入超卖/超买区域以及退出超卖/超买区域。 - 警报触发点可调整。 - MFI 震荡指标提供有关看涨和看跌价格动能的信息。 - 当 MFI 高于 80 时,建议在超买区域卖出;当 MFI 低于 20 时,建议在超卖区域买入。 - MFI 非常适合用于背离检测,也非常适合与价格行为结合使用。 - 指标适用于任何时间范围。 这是仅在 MQL5 网站上提供的原创产品。
FREE

BlueDigitsFx 官方生态系统入口 此免费工具是 BlueDigitsFx 交易基础设施生态系统的一部分。 通过 BlueDigitsFx 官方机器人获取更新、工作流程资源、产品发布信息以及官方生态系统访问权限。 Telegram 生态系统
官方网站
MT5 版本
BlueDigitsFx Open Trades MT4 —— 用于主动交易管理的实时点数监控工具 BlueDigitsFx Open Trades 是一款免费的 MT4 工具,可直接在图表上实时显示所有未平仓交易的总点数结果。 该工具采用清晰的颜色编码显示方式,帮助交易者快速识别盈利和亏损仓位,并监控多个活跃交易及货币对的整体表现。 它专为希望获得更清晰交易视图、更快速仓位监控以及无需频繁切换多个窗口即可管理交易会话的交易者而设计。 通过在图表上持续显示未平仓交易的整体表现,交易者无需频繁打开 MetaTrader 终端窗口即可更快做出反应。
主要功能 实时点数显示 —— 直接在图表上监控所有未平仓交易的总点数结果。 颜色编码交易概览 —— 快速识别正收益和负收益交易表现。 多交易监控 —— 适用于同时
FREE

本顾问旨在用于长期(终身)的多货币交易,同时交易 28 个货币对(货币对列表固定在代码中),时间框架为 M30。货币对列表:EURUSD、GBPUSD、AUDUSD、USDCAD、USDJPY、USDCHF、GBPJPY、EURJPY、AUDCAD、AUDJPY、CHFJPY、EURCHF、EURGBP、NZDJPY、NZDUSD、CADJPY、AUDCHF、AUDNZD、CADCHF、EURAUD、EURCAD、EURNZD、GBPAUD、GBPCHF、GBPCAD、GBPNZD、NZDCAD、NZDCHF。 其目标是捕捉趋势运动,并通过特殊的平均化机制、锁仓订单和紧急保护措施来管理风险。 核心策略为趋势跟踪,使用内置的 Skdon2 指标,在每个已完成的 K 线上发出买入或卖出信号。
当信号改变时,顾问按特定规则平掉旧仓位,并按新信号方向设置一系列(数量可在参数中设定)挂单(BUYSTOP 或 SELLSTOP)。 1. 顾问整体功能
它在 M30 图表上,通过内置于代码中的自定义指标分析每个货币对。
当指标发出买入或卖出信号时,顾问会开启一系列订单:一个市价单(立即按当前价
FREE
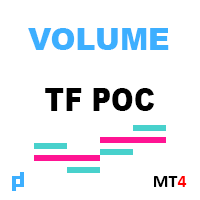
指标显示所选时间帧上的最大水平交易量。 基于指标 UPD1 Volume Box 。 线可以连接或分离。 在设置中,您可以启用智能触摸通知。 这个指标对于那些使用市场概况和智能货币概念进行交易的人来说非常有用。
输入参数 。
基本设置 。 Bars Count - 表示将在其上绘制TF POC的条数 。 Data Source - 使用蜱虫的时间范围。 Vertical Step - 影响密度和垂直精度 。 TimeFrame Period - 应用最大水平交易量的时间段 。 ID - 指标标识号。 选择不同的值以在同一图表上多次使用指标 。
视觉设置 。 Current POC - 显示出现的POC 。 Crop Line To Current Bar - 这条线不会超过最后一条 。 Link POC - 用垂直线连接POC线 。 POC Width - POC线厚度 。 POC Color ID - 所选指标ID的poc线颜色 。 Extend Line Multiplier - POC线的延续,乘数。 等于1。 该线由相同数量的条形扩展 。 Extend Line St
FREE

Relative Volume or RVOL is an indicator that averages the volume of X amount of days, making it easy to compare sessions volumes.
The histogram only has 3 colors:
Green - Above average volume
Yellow - Average volume
Red - Below average volume
The default setting is 20 days, which corresponds more or less to a month of trading.
With the data obtained from this indicator you can better gauge the commitment behind a move. For example, you will be better equipped to judge if a breakout of a r
FREE

Moving Average ATR Channel Experimental indicator that constructs a dynamic price channel around a Moving Average by applying Average True Range multiples. The channel consists of an inner and outer boundary on both the upper and lower side of the moving average, creating a visual “tunnel” that expands and contracts with market volatility. Default parameter values are completely untested and are not derived from any back-tested strategy, statistical study, or recommended trading system. They ser
FREE

AWESOME MACD INDICATOR
Awesome MACD Indicator is a powerful trading tool that combines the strengths of Moving Average (MA) and Moving Average Convergence Divergence (MACD) to provide accurate and reliable trading signals. Designed for forex and stock traders, this indicator simplifies the identification of trading opportunities by detecting significant crosses in price movements. Key Features:
MA and MACD Combination: Awesome MACD leverages the power of Moving Averages (MA) to identify short-te
FREE

Эксперт RSI Gold EA пригоден для торговле только одной валютной пары XAUUSD. Данная версия это наработки того, что можно извлечь только из одного индикатора RSI. В торговле используйте тайм фрейм только М5. Тестируйте на демо версии и перезапускайте эксперта каждую неделю. Мартин Гейл опасен сам по себе, а на золоте риск увеличивается многократно, не злоупотребляйте, хотя на все сделки выставляется фиксированный стоп, рекомендую на 3000 баланса брать 0,01 лот. MartingaleMultiplier = 2.0 Желаю
FREE

磁性价格发现指标,即价格倾向于回归的平均价格。 针对XAUUSD H1优化。它有3条线,中间线是需要重点关注的价格。 根据历史数据,在默认设置下,价格回归到平均价格的成功率超过92%;在其他情况下,默认设置的止损会被触发。 入场点和入场时间大致在新的一天开始时,为方便起见,新一天的第一根K线会根据其开盘价是低于还是高于磁力线而用箭头标记。 该指标适用于日内单次入场的交易策略,重点关注价格回归,也适用于网格策略。 可用设置: Candles:用于精细调整的K线数量。建议使用12-24-48的值或保持默认设置。 ATR设置:用于根据您的策略精细调整止损。 ShowLabels:显示线条右侧的标记文本。 LabelOffsetBars:文本缩进。 ArrowOffset_Multiplier:箭头缩进。
FREE

Opening Range Breakout EA is a focused trading robot that automates one of the most effective intraday strategies: trading the session breakout. It operates by observing the market during its initial, quiet phase to establish the opening range. Once that range is defined, the EA is ready to enter a trade the moment price action confirms a breakout, helping you ride the volatility that follows.
The Trading Idea The core of this strategy is simple: many of the day's biggest moves begin when the
FREE

Perfect for one minutes high trading and scalping. This indicator is very effective for trading on one minutes, in the hour. A combination of moving averages and STOCHASTICS calculation to produce a very convincing signal every hour. Blue colour signals a buy opportunity. Follow the X signs for possible buy points. The Blue average line serves as possible trend direction and support. Red colour signals a sell opportunity. Follow the X signs for possible sell points. The Red average line serves a
FREE

QCL Adaptive Band Oscillator — MetaTrader 4 A smooth 0–100 oscillator with adaptive reference bands for a clearer view of price momentum. QCL Adaptive Band Oscillator combines smoothed price calculations with dynamic upper and lower bands. Displayed in a separate indicator window, it helps you examine momentum swings, potential turning points, and divergences between price and the oscillator. A smooth transformation keeps the oscillator and both bands within the 0–100 range , with a center refer
FREE

Markov Prime 是一款新一代专业分析指标,它将经典技术分析与概率论(马尔可夫链)和分形几何(时间指数)相结合。 与大多数具有“记忆”且严重滞后的标准指标不同,Markov Prime 以不同的方式分析市场:它实时计算当前市场状态(趋势或盘整)持续的概率。该指标旨在过滤市场噪音期间的虚假入场信号,并寻找最有可能的建仓点。 该指标不重绘(Non-Repainting),在已收盘的 K 线上不滞后,并在图表上配有便捷的信息面板。 核心技术: 马尔可夫链过滤器 (Markov Chain Filter):分析过去 100 根 K 线并构建状态转移矩阵。如果出现信号,但马尔可夫模型显示趋势延续的概率很低,则该信号将被阻止。 时间指数 (Time Exponent, TE):评估价格运动的“质量”。它过滤掉混乱(噪音)的运动,防止在震荡市中入场。 混合信号核心:您可以通过方便的下拉菜单直接在图表上选择三种内置策略之一。 三种内置策略: RSI + EMA Trend:顺着全局趋势的方向进行回调交易(使用 RSI 超买/超卖区和 EMA 21/50 过滤器)。 EMA 21/50 Cros
FREE

BlueDigitsFx 官方生态系统入口 此免费工具是 BlueDigitsFx 交易基础设施生态系统的一部分。 通过 BlueDigitsFx 官方机器人获取更新、工作流程资源、产品发布信息以及官方生态系统访问权限。 Telegram 生态系统
官方网站
BlueDigitsFx Symbol Changer MT4 —— 一键切换交易品种,提升 MetaTrader 4 分析效率 BlueDigitsFx Symbol Changer 是一款轻量级 MT4 工具,可让交易者快速切换当前图表的交易品种,同时保留指标、图形对象、模板以及图表设置。 该工具专为需要分析多个交易品种的 MetaTrader 4 交易者而设计,帮助他们无需重新打开图表或重建工作区即可快速切换市场。 通过在切换品种时保持相同的图表布局,交易者能够更高效地扫描市场、更快速地比较不同品种,并保持整洁有序的分析流程。
主要功能 一键切换交易品种 —— 无需打开新图表即可快速切换当前图表的交易品种。 保留图表设置 —— 指标、图形对象、模板和图表设置保持不变。 更快速的多市场分析 —— 使用同一布局分析多个货
FREE

ATC Currency Strength Meter 在一个面板上测量 USD、EUR、GBP、JPY、AUD、NZD、CAD 和 CHF,并将它们从最强到最弱排名。
此工具也是 All In One Trade Management Panel MT4 的一部分,与仓位工具、交易管理和绩效分析一起。 计算方法: 强度是自所选蜡烛开盘以来的百分比变化,取自7个主要USD货币对。
USD强度是其他货币对其走势的平均值。
经纪商符号后缀(例如 EURUSD.m)会自动检测。 主要功能: M15、H1、H4、D1 和 W1 的时间周期按钮。所选时间周期会为每个图表记住。
带居中条的排名行:盈利向右为绿色,亏损向左为红色,并显示百分比值。
最强对最弱:由顶部和底部货币组成的货币对,当您的经纪商提供该符号时,显示其自身的百分比变化。
每秒更新。 输入: 从N根蜡烛前的开盘测量(默认1)
面板位置和宽度 您的经纪商必须提供7个主要USD货币对。缺少货币对的货币显示为 n/a。
FREE

Lot Size Calculation MT4 x Calculation of Lot Size x Position Size Calculation Lot Size Calculator MT4 是一款实用的风险管理工具,可根据 账户余额或净值、风险百分比、入场价格、止损和止盈 计算合适的交易手数。 计算器提供直接显示在 MT4 图表上的交互式面板,可以快速调整交易参数,并即时查看计算出的手数、点数距离、金额以及风险回报比。 主要功能 手数计算 根据以下参数计算允许的手数: 入场价格 止损 风险百分比 账户余额或净值 计算器会根据止损距离和交易品种的点值计算风险金额以及相应的交易手数。 入场价格 可以手动输入入场价格,也可以使用 Current Price 按钮快速设置当前 Bid 价格。 止盈和止损 设置自己的 Take Profit 和 Stop Loss。 对应的水平线可以直接在图表上用鼠标拖动,计算器中的价格会自动更新。 风险百分比 设置您愿意承担的账户风险百分比。 风险百分比可以手动输入,也可以使用 + / − 按钮调整。 Balance /
FREE

This indicator help to mark the high and low of the session Asian,London,Newyork , with custom hour setting
This indicator is set to count from minute candle so it will move with the current market and stop at the designated hour and create a accurate line for the day.
below is the customization that you can adjust :
Input Descriptions EnableAsian Enables or disables the display of Asian session high and low levels.
EnableLondon Enables or disables the display of London session high and
FREE
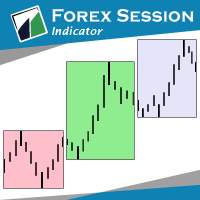
The indicator Forex Session displays official forex session times for Asia, Europe, America.
Main features shows Asian, European and American sessions shows the session volatility it can also be used for breakout trading
Indicator parameters 01: Sessions Session value - number of sessions Last session in developing mode - the session will be progressively displayed Adapts the size session to range - session size adjusts to volatility
02: Display Asia - on/off Europe - on/off America - on/of
FREE

Flow Anchor 指标是一款适用于 MetaTrader 4 的非重绘趋势引擎。它将相对动量指数(RMI——由标准 14 周期收盘价 RSI 与 14 周期典型价 MFI 的平均值构成)、区间加权移动平均线以及基于 ATR 的自适应波动带结合在一起。最终形成一条单一的彩色“锚定线”,用于跟踪主导趋势:在多头阶段位于价格下方,在空头阶段位于价格上方,并且从不会穿过 K 线实体。状态切换时,会在图表上绘制 BUY 或 SELL 箭头,并可选通过最多四种通知渠道推送提醒。
查看 MT5 版本: Flow Anchor MT5 查看更多产品: 所有产 品 想查看实盘示例和新工具,请访问我的个人主页并发送好友请求,以免错过任何更新! 工作原理 混合动量指数(RMI) RMI 是两个经典振荡指标的算术平均:一个是基于收盘价的标准 14 周期 RSI,另一个是基于典型价 (high+low+close)/3 的 14 周期资金流量指数 MFI。RSI 捕捉的是纯价格动量,MFI 则用成交量对动量进行加权。将两者取平均,就得到一个同时对价格速度和市场参与度敏感的混合指数:放量上涨的行情会
FREE

This indicator is based on Guppy's GMMA Strategy. And shows arrows when GMMA lines cross up or down. To have this indicator and get alerts for Multiple Timeframes and multiple Pairs you can check out the demo of this GMMA Trend Scanner indicator: https://www.mql5.com/en/market/product/38747
About GMMA In Brief:
GMMA attempts to identify trends by combining two groups of moving averages with differing time periods: The long-term EMAs (30, 35, 40, 45, 50, and 60) the behaviors of investors that h
FREE

Advanced SMC & Volumetric Order Block Indicator Overview
This enhanced-grade for MetaTrader 5 indicator is designed to decode market behavior using Smart Money Concepts (SMC) method . It goes beyond standard price action analysis by integrating Volumetric Data directly into market structure, helping traders identify high-probability reversal and continuation zones with precision. Key Features Volumetric Order Blocks: A unique, split-gauge visualization within Order Block zones tha
FREE

Double Yellow H1 Setup Pro MT4 Professional H1 Buy & Sell Signal Indicator Double Yellow H1 Setup Pro MT4 is a professional price action indicator developed to identify high-probability BUY and SELL trading opportunities on the H1 (1 Hour) timeframe. It is designed for traders who prefer clear, rule-based setups without cluttering their charts with unnecessary indicators. The indicator scans the market continuously and highlights potential reversal or continuation setups based on the proprietary
FREE

Median Cross 指标是外汇及其他金融市场中非常强大的技术分析工具。与传统的移动平均线不同,它绘制 两条中值线,并在交叉时生成 箭头和提示,帮助交易者更早、更可靠地发现趋势变化和潜在入场点。 中值价格表示价格区间的中间值,这使其比移动平均线 更不容易受到极端价格波动、尖峰和短期噪声的影响。在高波动性或横盘市场中,这一点尤为重要,因为它能提供 更平滑、更清晰的价格信号,帮助交易者判断市场的真实趋势。相比MA容易被异常高点或低点扭曲,中值更准确地反映价格的中心趋势。 该指标适用于 趋势跟随交易和区间交易,可帮助交易者识别关键的支撑和阻力位,从而在重要点位制定买卖策略。通过两条中值线的交叉、箭头和提示,交易者无需持续盯盘,也能快速做出交易决策。同时,将此指标与其他技术工具结合使用,可以增强信号可靠性,减少误报,提升整体交易表现和决策信心。 Median Cross 指标不仅提供了价格中值的直观视觉表现,还为交易者提供了对市场结构和价格分布的独特洞察,使交易更科学、更高效。无论是短线交易还是中长线趋势策略,它都能成为交易者的重要参考工具。
FREE

The indicator displays volume profiles based on the nesting principle. Profiles periods are pre-set so that each subsequent profile has a length twice as long as the length of the previous profile. In addition to profiles, the indicator displays volume clusters sorted by color, depending on the volume they contain.
Indicator operation features The indicator works on typical timeframes from M5 to MN, but for calculations uses historical data from smaller timeframes: M1 - for timeframes from M5
FREE
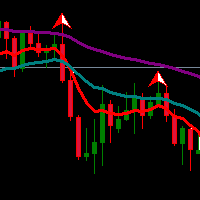
Exponential Moving Average (EMA) is an indicator that often be used by traders. Combination of two or three EMA indicators often applied to determine trend direction. Multiple EMA combined with fractals or oscillator indicator to detect overbought/oversold and divergence point also great to do in trading system.
If you like EMA indicator and want to get better indicator, highly recommended using EMA SuperTrend Strategy Indicator if you want to get better result in here:
https://www.mql5.com/en
FREE

UzFx-Total TP'SL & Timer-MT4指标旨在实时追踪所有已开仓及挂单交易的总止盈(TP)与止损(SL)值。此外,它还包含一个K线倒计时器,用于显示当前K线收盘的剩余时间。
核心功能:
自动计算所有活跃交易与挂单的预期盈亏总额。 显示当前K线收盘剩余时间,助力交易者高效管理进出场时机。 支持自定义文本颜色、字号及位置以提升可视性。 简约轻量化设计,不干扰图表布局。
用户设置: 可选择止盈/止损显示颜色。 自定义K线计时器文字颜色。 调整字体大小及图表位置。
应用场景:
适用于希望快速掌握风险回报水平而无需手动核查每笔订单的交易者。 适合依赖K线收盘时间精准执行交易的短线交易者和日内交易者。 通过直观监控潜在盈亏水平,强化风险管理能力。
FREE

RelicusRoad Trading Sessions 是适用于 MetaTrader 4 和 MetaTrader 5 的交易时段指标,在 M1、M5 与 M15 图表上以垂直点线标出东京、伦敦与纽约时段的开盘时间。 每个时段的开盘都以一条线、一个旋转显示的小名称标签,以及一个事件标记来呈现,颜色为该时段自己的颜色,覆盖当前交易日与此前的若干工作日。将鼠标悬停在其上会显示时段名称与开盘时间。本指标只标记开盘:不会填充时段区间、重叠或收盘时间。 工作原理 指标加载时会读取经纪商服务器时间与 UTC 之间的差值,四舍五入到整小时,再减去一小时。随后它会把东京开盘设在 UTC 23:00、伦敦开盘设在 UTC 07:00、纽约开盘设在 UTC 12:00,换算为服务器时间,并从当前 UTC 日期向前逐个工作日标出。周六与周日会被跳过。 Tokyo:默认橙色,位于 UTC 23:00,即东京时间 08:00。 London:默认绿色,位于 UTC 07:00,即夏令时下的伦敦开盘时间。 New York:默认红色,位于 UTC 12:00,即夏令时下的纽约开盘时间。 指标不做夏令时调整。这
FREE

The "REVERSAL" indicator is a pointer indicator without redrawing and delay. The "REVERSAL" indicator shows the best trend entry points on the chart. It is better to use it in tandem with other trend indicators as a filter. The indicator shows good results on all timeframes. The signal is generated after the candle closes and appears as blue and red arrows. If you reduce the amplitude, then you can trade in the style of scalping
FREE

水印 MT4 版本: https://www.mql5.com/en/market/product/120783 MT5 版本: https://www.mql5.com/en/market/product/120784
Logo MT4 版本: https://www.mql5.com/en/market/product/121289 MT5 版本: https://www.mql5.com/en/market/product/121290
“水印”脚本旨在通过在图表背景上直接显示关键信息来增强您的交易图表。该脚本提供了一种清晰且不显眼的方式来跟踪关键细节,例如当前交易对、时间范围以及各种时间指标。
功能:
交易对显示:
该脚本会自动检测并在图表上显示当前交易对(例如 EUR/USD、BTC/USD)。这可确保交易者始终了解他们正在分析的资产,从而降低基于错误货币对做出决策的风险。
时间范围显示:
脚本显示当前图表时间范围(例如,1 分钟、1 小时、1 天)。这有助于交易者了解他们正在查看的具体时间范围,无论是用于剥头皮交易、日内交易还是长期分析。
时间指标:
G
FREE

Discover the power of precision and efficiency in your trading with the " Super Auto Fibonacci " MT4 indicator. This cutting-edge tool is meticulously designed to enhance your technical analysis, providing you with invaluable insights to make informed trading decisions. Key Features: Automated Fibonacci Analysis: Say goodbye to the hassle of manual Fibonacci retracement and extension drawing. "Super Auto Fibonacci" instantly identifies and plots Fibonacci levels on your MT4 chart, saving you tim
FREE

Welcome to the Forex Gold Angel EA , which is a highly stable profit-generating EA. It comes highly recommended. The logic behind the EA is simple. It uses the BAND indicator, which triggers a flag when the price deviates from the band. However, it does not enter a trade at this point. Instead, it carefully monitors the price movement. When the price returns to the band and touches the center line, it enters a trade in the direction of the trend. This strategy is simple, but it yields significan
FREE

IntraScalpermt4 Indicator is an advanced, dynamic level-providing strategy/ Signals built in proven price action principles.
At the start of every trading session, it automatically calculates the decisive Levels —a key point that DECIDER guides high-probability trade opportunities.
Indicators Including:-
1. Day Trading Levels.
2. IntraTrend Line for Scalping using M1 TF.
3. Dynamic IntraScalper providing supply or demand zone on chart.
4. EA Setting/Documentation in Indicator=> About T
FREE

TrendBite v1.5 - 专业趋势跟踪指标 开发者:8aLt4 版本:1.5 平台:MetaTrader 4
概述 TrendBite v1.5是一款先进的技分析指标,旨在识别市场趋势变化并为投资者提供清晰的买卖信号。该工具基于布林带算法,能精准捕捉趋势反转点,既适合新手交易者,也适用于经验丰富的交易者。
核心功能 趋势识别 自动趋势分析:实时捕捉市场上升与下降趋势 基于布林带:采用可靠数学模型构建的计算系统 视觉清晰度:通过绿色(上升)和黄色(下降)柱状图直观展示趋势状态 买卖信号 绿色箭头(↑):提示买入机会 红色箭头(↓):提示卖出机会 清晰可视化:趋势线助您轻松追踪持仓方向 柱状图显示:直观评估趋势强度 警报系统 声音提醒:新信号生成时自动通知 邮件支持:通过邮件接收关键信号 详细信息:每条警报均包含价格水平和交易建议 用户友好界面 自动关闭网格:自动关闭网格以获得更清晰的图表 可自定义ZigZag:自由开启或关闭趋势线
参数设置 SignalPeriod(默认值:15) 信号计算周期 数值越高 = 信号越少但更可靠 数值越低 = 信号更多但更敏
FREE

Enigma Scalper Pro Breakout - EURUSD ONLY Overview Enigma Scalper Pro Breakout is a multi-filter breakout indicator designed to help traders identify high-probability trading opportunities by combining price action with multiple technical confirmations. The indicator uses a proprietary 3-Bar Breakout pattern together with optional Higher Timeframe, Bollinger Bands, RSI, and EMA filters to reduce low-quality signals and improve trade accuracy. How It Works The indicator waits for a valid breakout
FREE

Murray 的数学水平基于江恩的观察和他的价格平方理论。 根据江恩的说法,价格在该范围的 1/8 内波动。 这些 1/8 使我们能够为给定的图表获得不同的阻力位和支撑位,它们各有特点。 在突破 -2 或 +2 水平或波动性下降后,它们会重建。 您可以选择要显示的时间段(当前或整个历史记录)。 所有线条都通过缓冲区绘制。 Blog-Link - Murrey Math Trading with UPD1
输入参数 。
Period - 计算范围 。 History - 历史 (Current / All) 。 Bars Count - 线长 。
Visual Button - 按钮显示(启用/禁用) 。 Corner - 按钮锚定角度 。 X indent - 以像素为单位的水平填充 。 Y indent - 以像素为单位的垂直填充 。
Label Visual - 显示级别标签 。 Label Font Size - 字体大小 。 Label Shift Bars - 在酒吧的铭文的缩进 。 Label Tooltip - 在关卡上方的光标下显示文本
FREE

Zenith Aquarius Standard Most Expert Advisors on the market fall into one of two traps: they are either over-optimised to historical data and fail in live conditions, or they rely on grid and martingale recovery logic that averages deeper into losing positions. Zenith Aquarius takes a different approach. Zenith Aquarius Standard is an Expert Advisor designed for MetaTrader 4 and BTCUSD trading conditions. The product includes five predefined strategy configurations. Each configuration uses a dif
FREE

时区时钟是一个小巧的 MT4 指标,看它一眼就能回答一个问题:经纪商时间转换成我的本地时间是多少? 它在图表上是这样的 LOCAL 23:58:43 | SERV 15:58:43 | 10-02 SERV 是终端服务器时间, LOCAL 是你自己的时钟,末尾的 MM-DD 是服务器日期。当你准备用本地时间去描述交易或者选择一段时间进行交易时,这个小工具很有用。 功能 本地时间 服务器时间 服务器日期 时间精确到秒 文本颜色和字体大小都是可以根据自己的喜好进行调节的 显示的时钟可以用鼠标左键抓取并移动到任何地方 参数
LocalOffsetHours - 要加到服务器时间上以得到本地时间的小时数
ShowSeconds - true 显示 hh:mm:ss,false 显示 hh:mm
ShowDate - 在末尾附加服务器日期,格式为 MM-DD
TextColor - 文本颜色(clrWhite)
FontSize - 字体大小,单位为磅(11)
ScreenCorner - 0 左上,1 右上,2 左下,3 右下
X_Distance - 距角落的水平偏移,单位
FREE

Our offer also includes a free panel — Indicator Panel — which allows you to show or hide indicators created by BOToBRACIA -> MT4 / MT5 Our offer also includes a version for MetaTrader 5 -> https://www.mql5.com/en/market/product/171227?source=Site+Market+My+Products+Page
High and Low Points is a practical technical analysis indicator that plots levels corresponding to the highs and lows from previous periods (day / week / month) — levels that, in the Smart Money Concepts (SMC) and ICT app
FREE

Fer Scalphunter Gold VIP Signals ATTENTION: This is a demo version. To access the FULL VERSION and get a one-week trial with a temporary activation code, you must download the attached instruction manual in a .ZIP file from the comments tab and follow the instructions. To request the temporary activation code, contact me via private message. Fer Scalphunter Gold VIP Signals is the ultimate automation tool designed exclusively to replicate trading signals in real-time. Forget about being glued t
FREE

VolumeMS —— 带有价格图表超买/超卖区域的成交量指标(免费) Volume Strength 是一款适用于 MetaTrader 5 的成交量指标,基于 Time Segmented Volume (TSV) 理念开发。它不仅显示成交量大小,还能反映每根K线中买方或卖方谁占据优势,并将关键价格水平直接投射到主图上。 指标功能: 成交量强度柱状图 —— 深绿色柱表示买方占优势,深红色柱表示卖方占优势。灰色曲线为平滑后的趋势参考线。 Current Bar Strength —— 在指标窗口角落显示当前K线强度百分比(0–100%),相对于近期历史,并带有 / 箭头显示强度是在增强还是减弱。 主图斐波那契水平 —— 指标根据设定周期内的最高价/最低价自动绘制经典斐波那契水平(0%、23.6%、38.2%、50%、61.8%、78.6%、100%),以虚线直接显示在主价格图表上,而不是副图窗口。上方区域标记为 超买区 ,下方区域标记为 超卖区 ,每条水平线旁均显示对应百分比及精确价格。 主要参数: 成交量流计算与平滑周期 K线强度百分比归一化窗口 超买/超卖区
FREE

Super trend is one of the best trend indicators in metatrader 4 (MT4). Triple SuperTrend indicator is an indicator that consist of three super trend indicator that can be aranged. This indicator is built by mql4 language and doesn't provided by MT4 platform. Highly recommended using EMA SuperTrend Strategy Indicator if you want to get better result in here:
https://www.mql5.com/en/market/product/91664
This indicator is easy to use, power full and has many benefits, there are: Using three indic
FREE
MetaTrader市场是独有的自动交易和技术指标商店。
阅读MQL5.community用户备忘更多地了解我们提供给交易者的独特的服务:复制交易信号,自由职业者开发的自定义应用程序,通过支付系统完成的自动付款和MQL5云网络。
