 MetaTrader 5
 专家
专家
 指标
指标
 程序库
程序库
 实用工具
实用工具
 窗口小部件
窗口小部件
 规则
规则
适用于MetaTrader 4的免费EA交易和指标 - 4
 EA交易自动执行市场交易,而指标可使您更准确地分析报价并预测价格行为。
通过这些应用程序,您将能够更明智地在MetaTrader 4执行交易,抓住更多的交易机会。
EA交易自动执行市场交易,而指标可使您更准确地分析报价并预测价格行为。
通过这些应用程序,您将能够更明智地在MetaTrader 4执行交易,抓住更多的交易机会。 
The Supply and Demand Zone Indicator is a powerful and easy-to-use tool designed to help traders identify critical supply and demand zones on the chart. These zones can provide valuable insight into potential market reversals, breakouts, and important price levels where buyers or sellers are likely to take control. The best FREE Trade Manager . If you want to create your own Hedging or Grid strategies without any coding make sure to check out the ManHedger Key Features: Automatic Zone Detect
FREE

RelicusRoad Signal Line 是适用于 MetaTrader 4 和 MetaTrader 5 的趋势过滤指标,绘制两条移动平均线,并依据所选的策略过滤器,把每根线段染成绿色、鲑鱼色或灰色。 线条本身显示均线所在的位置,颜色则显示所选过滤器对该 K 线的判断。默认情况下,Line 1 是以 momentum 着色的快速 KAMA 9,Line 2 是以 Ichimoku 着色的慢速 Hull 移动平均 200。 工作原理 每条线都根据设定的均线类型与周期,以收盘价计算得出,下方始终绘制着一条灰色底线。在所选过滤器判断为向上的 K 线上,会在其上绘制绿色线段;判断为向下的 K 线上,线段则为浅鲑鱼色。过滤器无法判断时,灰色底线保持可见。每条线都有自己独立的均线设置与过滤器。 Momentum:上一根已收盘 K 线 5 周期 momentum,与两根 K 线之前的数值比较。 Ichimoku:Tenkan 高于 Kijun,且上一根收盘价高于云层两条边界时为绿色,相反情形为鲑鱼色。 MACD:12、26、9 参数下的主线高于或低于其信号线。 ParabolicSAR:K
FREE

Draw On Liquidity (DOL) – PDHL, PWHL & Kill Zones (引向流动性 - 前高低点与核心交易时段) 流动性水平通常充当价格变动的磁铁。前一日高低点 (PDHL) 和前一周高低点 (PWHL) 是止损单和机构活动倾向于集中的关键参考点。手动识别这些水平既耗时又容易出错。 Draw On Liquidity (DOL) 指标可在您的图表上自动绘制这些基本水平,并通过核心交易时段 (Kill Zones) 突显高概率交易窗口。凭借完全自定义选项,它提供了一个干净、专业且信息量极大的显示界面,以增强您的交易决策。 主要特点: 自动绘制 PDHL 和 PWHL: 精准且即时显示前一日和前一周的高点/低点。 流动性区可视化: 清晰查看价格可能将流动性池作为目标的区域。 核心交易时段 (Kill Zones): 标记东京、伦敦和纽约时段并提供可自定义的时间,让您专注于最活跃的交易小时。 完全自定义: 调整颜色、线条样式、粗细和标签,以匹配您首选的图表设置。 干净且用户友好: 所有输入都经过逻辑分组,无需图表杂乱即可快速设置。 它如何帮助您: 省去手动绘制线
FREE

R R Trade Assistant is a utility Expert Advisor for MetaTrader 4 built to help traders visually define trades and manage risk efficiently. This tool combines a graphical risk-reward interface with manual trade execution , allowing traders to easily set trade parameters directly on the chart. Users can define Entry, Stop-Loss, and Take-Profit levels , calculate lot size based on risk percentage, and execute trades directly from the control panel.
If you like the EA, feel free to lea
FREE

Enhanced Volume Profile: The Ultimate Order Flow & Liquidity Analysis Tool
Overview
Enhanced Volume Profile is an indicator for MetaTrader 5 that displays the traded volume at specific price levels over a defined period. It separates the total volume into buy and sell components, presenting them as a side-by-side histogram on the chart. This allows users to observe the volume distribution and the proportion of buy and sell volumes at each price level. Graphics Rendering
The indicator uses t
FREE

Pips Chaser 指标的开发是为了补充你的手动交易。该指标可用于短线剥头皮和长线波段交易 // MT5 版本
特点 无重绘指标 当新数据到来时,该指标不会改变其数值 交易货币对 任何货币对 时间框架 H1是最好的,但你可以将其适应于任何时间框架 交易时间 全天候 Buffers Buy Buffer: 0 / Sell Buffer: 1
要求
使用一个ECN经纪商,并为一些头寸提供严格的点差是必须的。 不要在中等影响和高影响的新闻发布时间进行交易。
如何安装
将该指标附加到首选的交易对上(推荐H1)。
配置
指标设置 。 在这里你可以修改指标的参数以采用最适合你的策略。 附加设置 。 在这里你可以改变指标不同部分的颜色。你还可以改变警报的配置。
如何使用它
当你在图表中看到箱体突破的箭头时,你就必须进行买入或卖出交易。 当蜡烛触及趋势线时,你必须关闭交易。 当趋势线和狙击线在同一水平上相互接触时,这将是一个理想的利润水平。 当交易线远离对方时,在这种情况下,该交易将给你带来更多利润。而当交易线小于对方时,在这种情况下,该交易将给你带来较少的利润。 你必须在突破框
FREE

摘要: Smart FVG Visualizer 是一款专为 MetaTrader 交易者打造的高性能专业指标, 旨在自动、 精准地识别市场中的价格失衡区域(Fair Value Gaps, FVG)。 该指标深度结合了 Smart Money Concepts (SMC) 和 ICT (Inner Circle Trader)的核心理论。 在机构级交易中, FVG 被视为算法留下的“价格脚印”, 代表了由于订单流极度不平衡而产生的效率低下区域。 这些区域通常具有极强的价格吸引力, 是寻找高胜率入场点、 设置止盈目标或判断趋势延续的重要依据。 主要技术优势与功能: 实时算法识别: 该工具能够即时扫描图表, 自动锁定看涨(Bullish)和看跌(Bearish)的 FVG 空间。 无论您是在 M1 进行剥头皮交易, 还是在 D1 进行趋势跟踪, 它都能提供稳定的精准度。 机构级专业美学: 我们严格遵循现代机构交易者的视觉标准。 指标通过平滑的有色方框和清晰的 "FVG" 文本标签来标注区域。 这种设计不仅直观, 而且有助于交易者在极短的时间内做出决策, 减少心理疲劳。 极致的性能优化:
FREE

SyncObjects 是一个工具,允许您在 MetaTrader 中实时同步绘制在多个图表上的对象。趋势线、水平线和文本标签等对象可以自动反映在其他图表上。这使得跨不同时间框架和货币对的无缝分析成为可能,从而提高了您的交易效率。此外,它与诸如 PracticeSimulator 等交易练习和测试工具配合良好,可以更高效地进行图表分析和模拟测试。
主要功能 实时同步:在一个图表上绘制的对象将自动同步到同一平台内的其他图表上。您可以在不同的时间框架和货币对之间共享分析。 支持多种对象类型:同步各种对象,包括趋势线、水平线、箭头、文本标签等。 策略测试器支持:与 MetaTrader 的策略测试器配合使用,轻松进行回测和分析。 离线图表支持:可与离线图表一起使用,使其在自定义时间框架和测试中具有更大的灵活性。 与 PracticeSimulator 兼容:SyncObjects 与 PracticeSimulator 工具高度集成,增强了模拟交易测试和验证的功能。 参数设置 仅同步相同的符号:设置为 true 时,对象仅在相同货币对的图表之间同步。设置为 false 时,仅垂直线将在不同
FREE

本指标在图表上绘制可配置的交易时段方框,将每个时段的最高价和最低价向前延伸为水平价位,并可在价格回到这些价位时发出提醒。时段开始时间通过经纪商服务器时间相对纽约时间的偏移设定,因此无论您的经纪商处于哪个时区,方框都能正确对齐。
指标绘制五个独立时段——亚洲、伦敦、NY AM、NY Lunch 和 NY PM,每个时段都有各自的启用开关、开始时间、持续时长和颜色,可显示为填充方框或仅边框。每个已完成时段的最高价和最低价会向前投射为水平价位,当价格穿越这些延伸线时,对应的线会自动结束,线条样式和宽度均可调节。此外还提供两条参考线:一条亚洲收盘线,将亚洲时段的中间价延伸至整个交易日;以及每个时段方框可选的中线。
当价格触及某个时段的高点或低点时,指标可发出提醒。提醒在每根K线仅触发一次,以避免在同一根K线上重复触发,并支持弹窗、声音、邮件和推送通知,各项均可独立开启或关闭。
配置时先从 ServerMinusNY 参数入手,它是您经纪商服务器时间减去纽约时间的小时数,应在其他设置之前先行设定。NumberOfDays 控制显示过去多少天的时段,而每个时段都带有各自的启用、开始时间、持
FREE
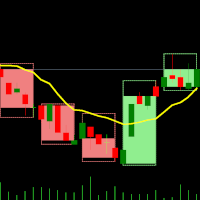
双时间框架指标 – MT4蜡烛嵌套 概述 蜡烛嵌套指标是一款专为MT4设计的多时间框架可视化工具。它将高时间框架的蜡烛叠加在低时间框架图表上,让您可以观察较小蜡烛在较大蜡烛内的表现。此方法改善了市场结构分析,增强了趋势识别,并使价格行为更加清晰——无需切换图表。 工作原理 选择低时间框架:
在MT4中打开您希望分析的时间框架图表(例如:M1、M5、M10)。 应用倍数:
选择一个倍数,动态生成高时间框架的蜡烛结构。 例如: 在M1图表上,倍数为5 → 显示M1蜡烛嵌套在M5蜡烛内。 在M10图表上,倍数为6 → 显示M10蜡烛嵌套在H1蜡烛内。 高时间框架蜡烛的叠加显示:
指标将高时间框架的OHLC(开、高、低、收)直接绘制在当前图表上,最新蜡烛会随着价格波动实时更新。 每根高时间框架蜡烛包含: 外框(高-低): 表示该周期内的最高价与最低价。 内框(开-收): 表示该周期的开盘价与收盘价。 实时更新: 当前活动蜡烛会在周期内动态更新。 如何在MT4上测试 将指标应用到图表:
打开M1(或其他低时间框架)图表,将双时间框架指标拖放到图表上。 选择周期倍数: 默认倍数为5,即在M
FREE

Bollinger RSI Momentum Reversal:精准动量反转指标 告别盲目追涨杀跌。大多数交易者之所以亏损,是因为他们在价格触碰布林带时就急于入场,而没有等待动量的转变。 Bollinger RSI Momentum Reversal 指标通过“双重锁定”确认机制解决了这一难题。 工作原理 本指标将 布林带 的波动边界与 相对强弱指数 (RSI) 的趋势转换能力相结合。它不仅能告诉你价格何时处于“超买”或“超卖”状态,更能精准捕捉动量真正转向有利时机的瞬间。 买入信号: 当价格从布林带下轨反弹,且 RSI 向上突破 50 (确认牛市动量)时触发。 卖出信号: 当价格从布林带上轨回落,且 RSI 向下跌破 50 (确认熊市动量)时触发。 核心优势 信号不漂移: 信号箭头在蜡烛图收盘时出现,一旦确定永不消失。 视觉直观: 满足条件时,买入/卖出箭头直接显示在图表上,清晰易懂。 高度可定制化: 可微调 RSI 周期、布林带参数及信号方向,以匹配不同交易品种的“个性”。 策略应用与核心规则 顺势而为: 在趋势市场中,务必筛选并仅跟随主趋势
FREE
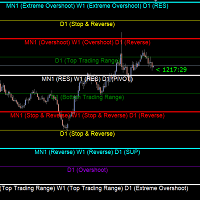
Gold Levels MTF - this is a fine stock technical indicator. The indicator algorithm analyzes the movement of the asset price, displays price levels of support and resistance from all time frames (TF) using the Murray method based on the Gann theory. The indicator indicates overbought and oversold fields, giving an idea of possible reversal points and at the same time giving some idea of the strength of the current trend. Description of levels: (Extreme Overshoot) - these levels are the ultimat
FREE

"The Breakout Master EA is a semi-automatic expert advisor. In semi-automatic mode, you only need to draw support and resistance lines or trendlines, and then the EA handles the trading. You can use this EA for every market and timeframe. However, backtesting is not available in semi-automatic mode. The EA has an option to specify how many trades to open when a breakout occurs. It opens all trades with stop loss and target orders. There is also an optional input for a breakeven function, which
FREE
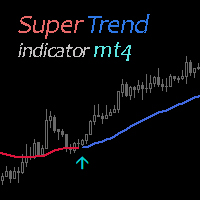
Super Trend Indicator uses two moving averages for calculating the trend direction. Combination with other market signals and analysis is necessary and provides more stable results. Indicator can be easily customized by the user including change of colors, with and arrow sizes.
MT5 version : https://www.mql5.com/en/market/product/185239?source=Site +Profile#
FREE Super Trend Expert Advisor > https://www.mql5.com/en/market/product/81160?source=Site +Profile+Seller
best results broker >
FREE

FOLLOW THE LINE GET THE FULL VERSION HERE: https://www.mql5.com/en/market/product/36024 This indicator obeys the popular maxim that: "THE TREND IS YOUR FRIEND" It paints a GREEN line for BUY and also paints a RED line for SELL. It gives alarms and alerts of all kinds. IT DOES NOT REPAINT and can be used for all currency pairs and timeframes. Yes, as easy and simple as that. Even a newbie can use it to make great and reliable trades. NB: For best results, get my other premium indicators for more
FREE

Ichimoku Wave Pro
产品简介
Ichimoku Wave Pro 是一款用于 MetaTrader 4 的图表分析指标,帮助交易者在同一张图表中研究 Ichimoku 的波动理论、价格理论和时间理论。
指标会自动寻找看涨和看跌的 A-B-C 结构,并将其视为 N 波候选结构;同时计算经典的 V、N、E 和 NT 价格投影,跟踪价格是否突破 B 点完成第三段确认,并显示重要的 Ichimoku 时间计数。
产品还包括交互式信息面板、可选的 Ichimoku 共振过滤、高周期背景、P/Y 结构辅助线、可拖动的 A/B/C 点以及可选提醒。
本产品是分析工具,不会自动开仓、修改订单或平仓。
主要功能
- 自动识别看涨和看跌 A-B-C / N 波候选结构。 - 区分 N 波候选状态和已确认第三段。 - 计算经典 Ichimoku 价格目标 V、N、E、NT。 - 可选高阶 E 投影。 - 在图表和面板中跟踪目标是否已到达。 - Kihon 时间数字:9、17、26、33、42、65、76、129、172。 - 根据 A-B 与 B-C 的K线数量计算对应时间。
FREE

Adaptive SuperTrend K-Means is an MT4 port of the open-source TradingView indicator "Machine Learning Adaptive SuperTrend" by AlgoAlpha (Mozilla Public License 2.0). All credit for the idea and the original code goes to AlgoAlpha. At a glance What it is: a SuperTrend whose band width adapts to the current volatility level Volatility levels: K-means sorts recent ATR values into high, medium and low clusters Faithful port: same math and the same defaults as the original Pine Script code For EA dev
FREE

Quantum Falcon Signal Free is a smart visual trading indicator for MetaTrader 4 designed for Forex and Gold traders. The indicator combines:
• Trend analysis
• RSI momentum confirmation
• MACD momentum filtering
• ATR volatility filtering
• Higher timeframe confirmation
• Smart exit signal detection Main Features:
• Smart Buy and Sell signals
• Exit Buy / Exit Sell alerts
• Real-time dashboard on chart
• Professional candle arrows
• Multi-timeframe trend confirmation
• ATR market volatility filt
FREE

Contact me for any queries or custom orders, if you want to use this in an EA.
Key Features: Pattern Recognition : Identifies Fair Value Gaps (FVGs) Spots Break of Structure (BOS) points Detects Change of Character (CHoCH) patterns Versatile Application : Optimized for candlestick charts Compatible with any chart type and financial instrument Real-Time and Historical Analysis : Works seamlessly with both real-time and historical data Allows for backtesting strategies and live market analysis Vi
FREE

介绍 Stoch RSI MT4,一种创新的交易指标,旨在通过将 Stochastic 振荡器的优势与相对强弱指数 (RSI) 结合,增强您的交易策略。该工具非常适合新手和经验丰富的交易者,提供对市场动量和趋势反转的关键洞察。 使用 Stoch RSI MT4,您可以通过识别最佳的进出点做出明智的交易决策。该指标提供了一种独特的交易时机把握方法,使用户能够利用潜在的市场变化并最大化盈利。 MQL产品安装指南 | 在 MT4/MT5 上更新已购买的MQL产品 | 常见故障排除指南 | 指标设置 / 指南 主要特点 信号生成:利用 Stochastic 振荡器和 RSI 来测量市场状况和动量变化。 买入/卖出信号:当市场条件表明超卖水平时触发买入信号,在超买水平时触发卖出信号。 无重绘:确保提供的信号保持有效,事后不会改变。 图表上的仪表板:在图表上直接显示用户友好的实时信息面板,便于快速参考。 弹出警报:通过 MetaTrader 弹出窗口发送警报通知,提醒用户重要的交易信号。 推送通知:实时警报发送到您的移动设备,让您随时监控交易。 电子邮件警报:在关键信号事件上发送电子邮件通知,便于
FREE
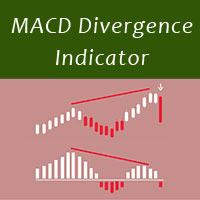
MACD divergence indicator finds divergences between price chart and MACD indicator and informs you with alerts (popup, mobile notification or email). Its main use is to find trend reversals in the chart. Always use the divergence indicators with other technical assets like support resistance zones, candlestick patterns and price action to have a higher possibility to find trend reversals. Three confirmation type for MACD divergences: MACD line cross zero level Price returns to previous H/L Creat
FREE

Full Fractals —— 无噪音的分形
标准 Fractals 指标会让图表变得杂乱 :出现大量点位,使人难以判断哪些真正重要。
结果是市场结构变得模糊,关键水平需要手动识别。 Full Fractals 解决了这个问题 —— 只保留价格真正产生反应的关键点。 该指标基于 Bill Williams 的经典分形逻辑构建,并且在形成后不会重绘。 用于实盘交易中识别市场结构。
当用 Full Fractals 替换标准 Fractals 指标后,图表中的无效点位会被清除 :只保留价格真正发生反应的关键水平, 市场结构变得清晰可见 。 你可以自行控制左右两侧需要多少根K线来确认一个峰值,从而决定在你的交易品种和周期中哪些波动才是重要的。
图表分析会发生什么变化
当增加参数( 例如从 2×2 提升到 5×5 )时,指标会过滤掉弱势波动,只保留 关键的摆动高低点 : 分形数量明显减少 小幅回调中的次要高点被过滤掉 只保留价格真正发生反转或停滞的关键水平 你看到的不再是随机点的堆积,而是少量用于分析的关键参考水平。 没有固定规则 —— 你可以自行定义一个峰值需要多“强”才被认为有效。
FREE

Telegram Copier Signal Telegram Copier Signal (TCS) 是 Telegram 信号工作流程中负责 MetaTrader 执行与管理的一端。图表内 GUI 会持续显示实时连接状态、品种范围、手数行为和交易管理控制,因此无需反复打开 EA Inputs,也能从图表跟踪日常设置。 TCS 围绕三个工作标签组织 — Current、Modify 和 Features — 每个标签覆盖从收到信号到管理持仓过程中的不同阶段。 清楚查看整个信号工作流程 Current 标签显示 TCS 正在等待什么,以及品种和手数如何处理。 Modify 控制信号没有 TP 或 SL 时的处理方式,并管理入场后的功能。 Features 把手动交易工具和设置快捷入口放在一起。 主要控制与功能 Current tab — 查看连接状态、当前品种范围、running/pending 总数、盈亏视图和当前手数模式。 Symbol control — 选择 ALL SYMBOLS 或 ARRAY LIST,并通过已配置的品种流程处理不同经纪商的品种名称差异。 Lot beha
FREE

免费 — ZigZag 摆动枢轴点加上移动平均趋势过滤器,绘制在同一图表上。它显示枢轴突破系统所依据的枢轴水平和趋势背景。针对黄金(XAUUSD)调校。
完全免费,无任何限制。如果它在您的图表上派上用场,一条简短的评价对我们帮助最大——只需30秒,这也是其他交易者发现这款工具的唯一途径。
平台: MetaTrader 4(本页面)。MetaTrader 5 版本: https://www.mql5.com/en/market/product/185643
枢轴突破只有在顺应更大趋势的方向时才有意义。本指标标记每一个确认的摆动枢轴,并绘制一条趋势移动平均线,让你一眼就能看出上一个枢轴的突破是顺势还是逆势。
=== 它绘制什么 ===
- 已确认的 ZigZag 摆动高点和低点(圆点)——突破系统所响应的枢轴。
- 趋势移动平均线(默认 MA 50)。
=== 已确认枢轴不重绘 ===
只有当一个枢轴被确认为其窗口内的局部极值后才会绘制出来。已确认的枢轴不会移动。(与所有 ZigZag 一样,最近仍在形成的那一段是临时的,直到出现新的极值加以确认——这是摆动检测的固有特性,而非
FREE

BB Sniper v6.00 BB Sniper is a trading expert advisor that implements a scalping strategy based on Bollinger Bands analysis. The advisor is designed for trading on M1 and M5 timeframes. The core trading logic involves identifying price touches of the Bollinger Bands boundaries. Signal filtering employs two additional confirmations: the Relative Strength Index (RSI) value and Supply/Demand zone analysis across multiple timeframes. After opening the initial position, the advisor builds a grid of o
FREE

UT Bot Alerts An ATR trailing-stop trend indicator that alerts you when the trend flips, and grades how trustworthy each signal is.
MT4: https://www.mql5.com/en/market/product/187140?source=Site MT5: https://www.mql5.com/en/market/product/193099?source=Site What it does UT Bot Alerts draws a trailing line that follows price and flips sides whenever the trend changes, marking each flip with a BUY or SELL arrow. It works on any symbol and timeframe. On top of the classic trailing-stop logic, th
FREE

ATC Candle Timer 将当前蜡烛的剩余时间和关键品种信息放在一个小面板中。
此工具也是 All In One Trade Management Panel MT4 的一部分,与仓位工具、交易管理和绩效分析一起。
蜡烛计时器: 图表时间周期或您选择的任何时间周期(包括周线和月线)的蜡烛收盘倒计时。
显示蜡烛已过去多少的进度条。
可选的当前蜡烛旁边的倒计时标签,通过面板上的按钮开启或关闭。
可选的蜡烛收盘前设定秒数警报。 品种信息: 以点和点表示的价差。
今日波幅(以点表示)。
所选天数内的平均日波幅(ADR),今日波幅占其百分比:低于75%为绿色,75%起为琥珀色,100%起为红色。
多头和空头隔夜利息。
经纪商服务器时间,以及可选的您电脑的本地时间。 输入: 倒计时时间周期(默认:图表时间周期)
在当前蜡烛旁显示倒计时、其颜色和字体大小
蜡烛收盘前N秒警报(0 = 关闭)
平均日波幅天数(默认14)
显示本地时间
面板位置和宽度
FREE

一条不肯游走的趋势线。Half Trend MTF 在市场推挤它的时候守住自己的水平,只有当最近 N 根K线的极值真正把它顶出去时才翻转,所以在那种把移动平均线衬托成信号发生器的锯齿里,它一动不动。围绕它的 ATR 通道则显示,在这次翻转开始有意义之前,今天的波动率给价格留了多少余地。免费,没有试用期,没有锁住的功能。 它支撑的判断很简单,而且说得直白:线告诉您趋势目前守在哪一侧,翻转告诉您这件事是在哪一刻改变的,通道告诉您还有多少余地。 因为这条线只有在最近 N 根K线的极值朝它反方向走时才会动,它不会像均线那样漂移。它先是不动,然后翻转。 图表上有什么 Half Trend 线,用趋势的颜色绘制,跨过翻转K线也不断开:趋势向上时是一条画法,趋势向下时是另一条,在交接的位置连起来。ATR 通道,一条上轨和一条下轨,它们到线的距离是半个 ATR 的倍数,每条轨道都是一条各自颜色的细线。两者之间是两层填充,线以上用多头色,线以下用空头色,用细点网绘制,因此K线能直接透过它们读出来,价格处在通道的哪一半也仍然一眼可辨。翻转K线上还有 BUY 和 SELL 箭头。所有内容都画在价格窗口里。
FREE

МetaТrader的交易复印机4.它复制任何账户的外汇交易,头寸,订单。
这是МТ5↔️МТ4今天贸易复印机的最佳 МТ4 - МТ4, МТ5 - МТ5, МТ4 - МТ5, МТ5 - МТ4 。 独特的复制算法将所有交易从主账户复制到您的客户账户。运行速度快。严格的错误处理。一组强大的功能。 所有这些品质都合并在一个程序中 - EXP - COPYLOT。 该程序可以在多个终端绑定上运行。 在一个账户上交易的各种投资者账户中将其用作交易的同步器, - COPYLOT会将您的交易复制到其他终端。 安装 CopyLot Master - 要在帐户上安装的专家,您要从中复制职位和订单。 在终端中安装此专家,您可以从中将位置复制到投资帐户。 将任何文本标签名称指定为pathWrite(pathRead),例如“COPY”。 EA需要设置为1图表!默认情况下,我们的顾问会复制您帐户中的所有头寸和订单!
要复制您需要在第二个帐户或 Copylot客户端MT5 上安装 COPYLOT客户端MT4 的位置
注意:设置列表在我们的 特征 从有利可图的投
FREE
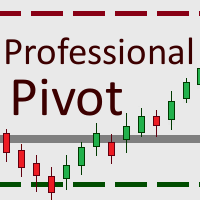
This tool gives you the opportunity to display pivot point support and resistance levels as well as the daily open, weekly close and monthly close levels on your chart with high levels of customization.
Pivot points are important horizontal support and resistance levels that get calculated using the high, low and closing price of the previous period (for example D1). With this indicator, you can choose between hourly to monthly timeframes to base your pivot point calculation on.
There is a va
FREE
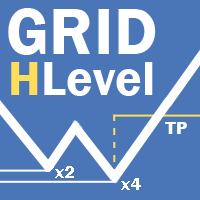
MT5版本 | Valable ZigZag 指標 | FAQ Grid HLevel Expert Advisor 非常適合那些希望每月在外匯市場上獲得穩定利潤的交易者。 Expert Advisor 根據平均策略工作 , 我建議您正確使用它。 “ 正確 ” 使用它意味著以市場反轉點的平均數開倉 , 並且僅在全球趨勢的方向上交易。 至於主要趨勢的方向 , 我建議通過時間框架 H4 上的 Valable ZigZag 指標來確定。 指標更難確定市場可能發生變化的水平 , 因此我建議交易者在圖表上手動設置它們 , 以便使用平均訂單更準確地進入市場。
因此 , 我想向您介紹 Grid HLevel Expert Advisor - 一種以手動設置的支撐和阻力水平進行交易的 Expert Advisor 。 注意力 !!! Grid HLevel EA 不是全自動的 , 而是半自動的。 所以不要指望你把它放在你的帳 戶 上什麼都不做 , 每天一次你必須為它的正確操作設置新的級別。 如何使用 Expert A
FREE

XA Risk Reward Ratio Tool MT4 tool is a professional algorithm, that calculates risk of every transaction before it is finalized. It allows you to precisely estimate gain and possible loss. The professional tool can estimate levels of Take Profit and Stop Loss incredibly precisely, making investments more effective and safer. Using Risk Reward Ratio Tool, you can with one click carry out transactions, cancel position, set position rate, set opening point, TP, SL and many other features. List of
FREE

It identifies the pivot, support, and resistance price levels of the selected timeframe and then draws lines onto the chart. FEATURES: Option to specify the Timeframe Period in the PivotSR calculation. Option to display the PivotSR of the last candle, of every candle, or of the current candle. Options for displaying labels, line thickness, and line color. PivotSR can be interpreted as reversal levels or past price reactions that can be used as the basis for current price analysis. Some traders b
FREE
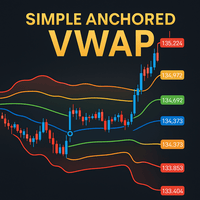
Simple Anchored VWAP is a lightweight yet powerful tool designed for traders who want precise volume-weighted levels without complexity.
This indicator lets you anchor VWAP from any point on the chart and instantly see how price reacts around institutional volume zones. MT5 Version - https://www.mql5.com/en/market/product/155321/
Join To Learn Market Depth - https://www.mql5.com/en/channels/suvashishfx Using VWAP bands and dynamic levels, the tool helps you understand where real buying and s
FREE

Advanced Non-Repaint Daily 支撑与阻力 + 供需指标 Advanced Non-Repaint Daily 支撑与阻力 + 供需指标 是一款专业级机构市场结构分析工具,旨在自动识别并锁定关键的 日线支撑、阻力、供给与需求区域 ,且完全不重绘。 该指标通过提取日线历史数据中的关键价格水平,并在初始化后将其永久固定,为交易者提供清晰、稳定且可靠的高时间框架市场结构视图。 这确保了分析的一致性,并消除了在真实市场环境中因区域移动或重绘而产生的混乱。 主要功能 完全 不重绘的日线支撑与阻力水平 锁定的机构级 供给与需求区域 稳定的高时间框架市场结构映射 简洁、干净的图表显示 轻量级优化性能 启动时自动检测日线关键水平 初始扫描后固定区域(不再重新计算) 支持多时间框架交易策略 指标识别内容 该指标可自动识别: 主要日线支撑位 主要日线阻力位 关键需求区域(买入区域) 关键供给区域(卖出区域) 所有水平一旦生成即保持固定,确保结构稳定性。 适用人群 本工具非常适合: Smart Money 交易者 机构风格交易者 供需交易者 价格行为交易者 波段交易者 突破交易者 多时
FREE
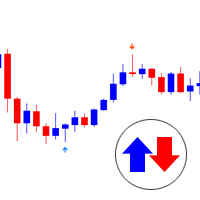
It works based on the Stochastic Indicator algorithm. Very useful for trading with high-low or OverSold/Overbought swing strategies. StochSignal will show a buy arrow if the two lines have crossed in the OverSold area and sell arrows if the two lines have crossed in the Overbought area. You can put the Stochastic Indicator on the chart with the same parameters as this StochSignal Indicator to understand more clearly how it works. This indicator is equipped with the following parameters: Inputs d
FREE
描述
Market Phase Analyzer 是一款高级指标,专为识别市场的三大主要阶段: 累积阶段 、 操纵阶段 和 分配阶段 而设计。
通过自动化会话分析,指标绘制 亚洲区间框(Asia Box) ,检测关键水平上下的扫单动作,并结合 ATR 滤波器 确认反转信号,从而减少虚假信号。 主要功能 高亮显示可自定义的亚洲交易时段区间框。 自动检测看涨或看跌的扫单行为。 可选 ATR 滤波器进行信号确认。 显示每日开盘价水平线。 图表上以箭头和文字提示交易信号。 重新初始化时自动清理对象。 交易优势 帮助识别潜在的反转点和趋势阶段。 支持 Smart Money Concepts(聪明资金理念)及高级价格行为策略。 适用于日内和波段交易。 时间、颜色和水平完全可自定义。 使用建议
建议在 M15、M30 或 H1 图表上应用,以获得更精细的市场阶段分析。可结合多周期策略,在关键位置确认交易信号。 推荐搭配使用的指标
Candlestick Pattern Analyzer MT4: https://www.mql5.com/en/market/product/145982 累积
FREE

Next Arrival : Flip or Die Trading Arena. Flip a trading account: https://flipordie.com/chapter-1-thirteen-doublings-double-a-trading-account/
The Break of Structure (BoS) and Change of Character indicator with Fair Value Gap (FVG) filter is a specialized tool designed to enhance trading strategies by pinpointing high-probability trading opportunities on price charts. By integrating the BoS and Change of Character concepts with the FVG formation, this indicator provides traders with a robust f
FREE

本程序是为交易者和投资者设计的简单图表播放器,旨在帮助您回放历史市场数据,从而更好地理解市场的动态和价格走势。
使用本播放器,您可以逐根推进K线,按顺序确认市场走势, 并可以分析特定交易策略在不同市场情况下的表现。
通过反复观察关键价格点和趋势变化, 您能够有效地提升交易决策的准确性和操作信心。
播放过程中可以暂停, 并在需要时继续播放。
【功能特点】 从过去向未来方向自动播放 以固定间隔逐根K线推进 支持播放中的暂停 【播放规格】 播放方向:过去 → 未来 播放速度:固定 移动K线数量:1根固定 播放暂停 / 继续 使用END结束播放 【操作方法】 Pause / Restart:暂停或继续播放 END:结束播放并停止程序 版本比较 下表显示了本产品(Player版)与高端型号(Full Version)之间的功能差异。虽然用户界面(控制面板)的布局完全相同,但可用的模式和设置范围有所不同。
功能项目 Player版 (本产品) Full Version (完整版) 用户界面 完全相同 (通用
FREE
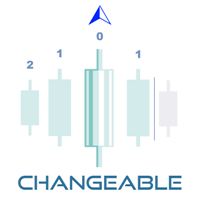
Fractals Dynamic Fractals Dynamic – 是 Bill Williams 改進的免費分形指標,您可以在其中手動設定左側和右側的柱形數量,從而在圖表上建立獨特的模式。 现在所有基于或基于分形动态指标的交易策略都将有一个额外的信号。
此外,分形可以充当支撑位和阻力位。 在一些交易策略中,显示流动性水平。 为此,在这个版本的多分形和多帧指标 MultiFractal Levels 中引入了水平。 您会发现这个指标在任何价格图表上作为您交易的助手更具信息性,视觉性和实用性。 使用分形動態指標作為您交易系統的補充 也試試我在市面上的其他產品 https://www.mql5.com/ru/users/capitalplus/seller
如果您喜欢该指标,请对其进行评分并留下评论,这对我来说非常重要!
交易獲利豐厚!
FREE

QCL Bollinger Trend Trail — MT4 Track trend direction with an adaptive trailing line directly on your MetaTrader 4 chart. QCL Bollinger Trend Trail combines trend detection with integrated volatility filtering to provide a clear visual reference alongside price action. Its two-color line advances as a trend develops and holds its position when conditions do not support further movement. Key Features Adaptive trailing line: Follows developing price movements. Directional colors: Distinguishes upw
FREE

This is the best Support and Resistance Indicator on the market, and it shows both confirmed Support and Resistance as well as Retests. Support & Resistance: Support marks where buying demand halts price declines, acting as a safety net. Resistance caps price surges, driven by selling pressure. Traders leverage these levels to predict reversals, plan entries, exits, and manage risks, making them trading's fundamental guideposts. Join To Learn Market Depth - https://www.mql5.com/en/channels/suv
FREE

Smart Color Level Drawing Indicator Smart Color Level Drawing Indicator 是一款简单而强大的 MT4 图表绘图工具,旨在帮助交易者快速、直观地标记 支撑位、阻力位、区域、水平线以及重要价格区域 。 无需反复打开 MT4 绘图菜单并手动设置对象,本指标提供了一个方便的 一键式图表绘图面板 。 主要功能 一键绘图面板 4 个可自定义的空心矩形 4 个可自定义的填充矩形 4 个可自定义的水平线样式 快速访问常用绘图工具 完全可自定义颜色 矩形边框颜色 矩形填充颜色 线条颜色 可调节线条样式和宽度 实线 虚线 点线及其他 MT4 支持的样式 线条宽度调整 可调节绘图尺寸 矩形宽度(K线数量) 矩形高度倍数 4 种面板位置 左上角 右上角 左下角 右下角 交互式绘图对象 创建的矩形和线条可以继续选择,因此您可以直接在图表上移动和调整它们。 适用场景 支撑与阻力 供需区域 价格区域 突破区域 入场与出场区域 交易时段标记 手动技术分析 图表视觉整理 快速价格水平标记 重要说明 本指标是一个 手动图表绘图工具 。 它不会自动生
FREE
免费获取我所有的 MT4 和 MT5 指标 — 点击这里了解方法
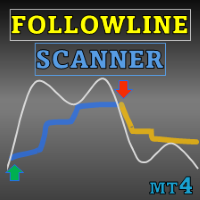
新工具 售价 $30 限于 首周 或 前 3 次购买 ! MQL5 Trading Tools 频道 : 加入我的 MQL5 频道,获取我的最新动态 通过 Follow Line MT5 与扫描仪,最大化您的交易优势,这是一款为严肃交易者设计的先进基于波动率的指标。此工具结合了布林带的强大功能和可定制的设置,提供对价格波动的精准见解。 See more MT5 version at: Follow Line MT5 with Scanner See more products at: https://www.mql5.com/en/users/ndhsfy/seller Follow Line 的关键在于其能够检测价格何时超出设置为 1 标准差的布林带。以下是其工作原理: 买入信号: 当价格突破上布林带时,Follow Line 变为蓝色,提示潜在的买入机会。 卖出信号: 当价格跌破下布林带时,Follow Line 变为红色,指示可能的卖出信号。 但 Follow Line 不仅仅
FREE

The Omega Trend Indicator is an advanced tool that has been specifically designed to detect market trends early, and follow them efficiently. The indicator draws two lines. The main (thicker) Trend Line represents the presumed lower or upper volatility limits of the current market trend. A break in the main Trend Line indicates a potential reversal or shift in the movement of the trend. The Trend Line also indicates the best point to place a stop loss order. In Omega Trend Indicator, the Trend L
FREE

免费但先进产品概述 Turbo Trend 是一个强大的指标,旨在帮助交易者识别和跟随市场趋势。它结合了高级移动平均线和成交量分析,以提供明确的趋势方向信号。Turbo Trend 通过将市场状况分类为三种不同的状态: 上升趋势 、 下降趋势 和 中性趋势,简化了决策过程,使用易于区分的彩色线条和蜡烛高亮显示。 加入 Koala Trading Solution 频道 在mql5社区,获取有关所有Koala产品的最新新闻,加入链接如下: https://www.mql5.com/en/channels/koalatradingsolution 访问其他不错的免费工具:FVG 指标: https://www.mql5.com/en/market/product/108907 基于 Turbo Trend 的EA 现在已在市场上提供 在此访问 Turbo Trend Bot: https://www.mql5.com/en/market/product/127401 关键功能 趋势分类 :该指标使用复杂的算法来分析多个移动平均线和成交量,以提供明确的趋势洞察。 视觉信号 :趋势方向
FREE

这个实用的EA旨在从你的经纪人那里一次性下载所有历史数据。一旦投放到一个图表上(可以是任何图表),你将选择符号和时间段来处理输入。然后所有的都是自动的。这可能需要一些时间,所做的一切将显示在专家日志上。
当然,它只能下载经纪人服务器上真正可用的数据。这个过程取决于MT4的 "图表 "设置 "历史最大条数 "和 "图表最大条数",如果你想确保获得最大的数据,你可以将这些值设置为大于默认值。然而,并不是所有的经纪商都提供大量的历史数据,对这些设置使用非常大的值会严重影响你的平台性能,使用时要小心。 这个工具主要对下载指标或EA在多个符号和多个时间段工作所需的所有数据非常有用,因为所有的数据都是自动的,没有必要全部手动完成。 一个非常好的例子是在首先使用 Fx Power 之前 ,最好的 ,具有所有时间框架的完整历史的货币强度表 ,由我的合作伙伴 Daniel Stein 提供,他为你提供完整的交易工具组合和非常有趣的交易分析。
通过我们 在mql5 和 Telegram 上 的 晨间简报,获得每日市场更新的细节和截图!
FREE

设置止损,获利,追踪止损,盈亏平衡,启用虚拟止损。
Exp Assistant 将帮助您组织职位维护。 此EA交易将为您的头寸设置所有必要的止损和获利水平。 所有Expert Advisor操作都通过图表上的控制面板进行管理。 如果您有未平仓头寸,但您的EA交易无法设置止损,获利,追踪止损或盈亏平衡,如果您手动交易,您可以使用助理。它将自动为您的交易设置止损并获利,将在需要时开启追踪止损或止损至盈亏平衡。它还具有基于抛物线Sar指标的追踪止损。 MT5版本
详细描述 +DEMO +PDF 如何购买
如何安装
如何获取日志文件 如何测试和优化 Expforex 的所有产品 我們助手的9個主要功能 - 開盤買賣; 安裝止損/獲利; 啟用追踪止損; 包括盈虧平衡; 拋物線尾隨停止; 虛擬止損和獲利; 虛擬追踪止損和盈虧平衡; 顯示當前條的結束時間; 顯示有關帳戶的有用信息;
只需在实时图表上单击交易,即可下载 MetaTrader 4的 实用程序 VirtualTradePad 和 MetaTrader 5的VirtualTradePad For strat
FREE

GridHedgeMartingaleEA — Умный Мартингейл с Защитой и Хеджированием GridHedgeMartingaleEA – советник, сочетающий классическую мартингейл-сетку с интеллектуальную логику парного закрытия убыточных и прибыльных ордеров. Основные фишки: Закрытие по прибыли всех ордеров при достижении заданной цели. Парное закрытие: убытки нивелируются за счёт прибыли! ️ Гибкая настройка лота, шага и количества ордеров. Контроль просадки в процентах от баланса. Информационная панель прямо на граф
FREE

Title : Trade Assistant Manager for MT4
Trade Assistant Manager — See your risk before you click Trade Assistant Manager is a MetaTrader 4 chart utility for discretionary traders who want a clear, visual way to size positions . Place your Entry, Stop Loss, and Take Profit directly on the chart. The panel shows the lot size, the money at risk, the profit target in money, and the reward-to-risk ratio — updated as you move the lines.
What you gain Faster decisions : - Automatically calcu
FREE
Lux Algo MT5 信号移动平均线
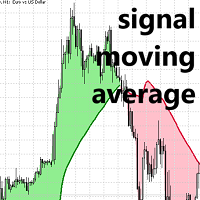
探索一款专为移动平均线交叉系统中信号线使用而设计的独特移动平均线指标。这款先进的工具的独特之处在于,它在区间震荡市场中偏离价格,而在趋势市场中则与标准移动平均线高度相似。这一特性有助于交易者避免不必要的噪音和因市场波动而导致的潜在过度交易。
在区间震荡市场中,移动平均线会偏离价格,而在趋势市场中则达到常规移动平均线的水平。
移动平均线交叉策略通常依赖于“信号”线,即一条用于判断总体趋势的较慢移动平均线。该信号线与一条较快移动平均线搭配使用,可以滤除常规价格与信号线交叉可能引发的潜在洗盘交易。
该指标将在更多区间震荡周期内偏离价格,从而有效减少价格与信号线交叉的次数。
价格与信号线之间区域的颜色由价格相对于信号线的位置决定,绿色指标表示价格高于信号线。
然而,信号线的颜色会考虑市场是趋势还是区间波动,只有在市场趋势出现时才会改变。
该指标最初由 Lux Algo 开发,用于交易查看。
FREE

摆动策略是 Shuttle Runner 专家顾问的基础。 该策略在2009年被描述,并被外汇市场的交易者积极使用。 Shuttle runner是该策略的修改和改进版本。
该战略的主要实质如下:
只有在市场的活跃阶段才值得交易这个专家顾问。 我们知道市场在欧洲和美国的交易时段是活跃的(你也可以采取亚洲的,但重要的经济新闻的存在是一个先决条件)。 因此,在启动专家顾问之前,一定要查看经济日历,并检查我们要交易的国家的重要新闻。 如果有新闻,我们可以在新闻发布前1-2小时启动专家顾问。 您可以使用挂单开始,虽然如果有消息将移动市场100%,您也可以进入市场价格(由开始交易参数配置)。 第一个订单打开后,我们立即将相反的订单放置在距离初始订单20-30点的距离处,比第一个订单的数量大2.3-3倍。 这是必要的,以弥补损失的第一个订单,如果价格转向相反的方向。 此外,如果价格反转并捕获挂单,我们会在相反的方向上放置另一个订单。 这个订单的手数也增加了2.3-3倍。 依此类推,如果价格在30-40点的小通道。 订单的止损和利润从通道边缘放置15-30点,以便同一通道的所有订单在同一时间关闭。
FREE
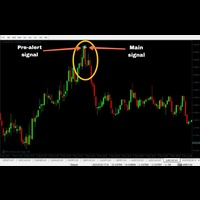
100% non-repaint MT4 indicator with advance pre alert
Recommended candle timeframe M15
Trade expiry 15 minutes
Call buffer 0
Put buffer 1
Intrabar
Pros Neural Network based Advance price action algorithms Advance trend filtering algorithms Advance consolidation filtering algo
Pre-alert (get ready) signals
Non-delay indications
Auto-trading supported
100% Non repaint
100% No lag
No recalculating
Lifetime license
Cons Very few signals
Instructions to use
1 Do not enter a trade if pre-a
FREE

This indicator was created as an MT4 version inspired by a TMA RSI Divergence indicator found on TradingView.
This indicator detects both Regular and Hidden divergences using RSI pivot points, similar to TradingView's pivot-based divergence logic.
-------------------------------------------------- Features -------------------------------------------------- • Regular Bullish / Bearish divergence • Hidden Bullish / Bearish divergence • Pivot-based detection (Left / Right bars) • Optional RSI SM
FREE

Trading doesn’t have to be complicated. With the right visual guidance, market decisions become clearer, calmer, and more confident.
Nebula Arrow is designed to help traders focus on what truly matters: high-quality entries based on refined market behavior. Just load it on your chart and let the arrows guide your trading decisions. Trade With Confidence We believe that simplicity is power. Nebula Arrow was created after extensive market observation and practical research, transforming complex
FREE

Safe Trading with a $500 Account This Expert Advisor (EA) has been carefully engineered for traders who prioritize capital protection, disciplined risk management, and sustainable long-term profitability over aggressive, high-risk trading. Rather than pursuing unrealistic returns, the EA is designed to achieve consistent performance by maintaining a conservative approach to every trade. The recommended minimum trading capital is $500 USD . With this account size, the EA automatically start
FREE
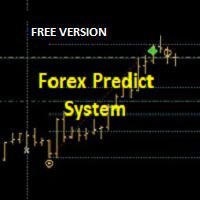
Hi Trader, ================================================================================ If you like my indicator, please do not hesitate to give a review and/or comment. Thank you! ================================================================================
This indicator draws trade entry zone and target levels based on the levels of the previous day.
A blue zone (BUY) or red zone (SELL) is drawn and two targets. The optimal trade entry value is also indicated.
A second gray zone is
FREE

Scalper Arrow x is a buy sell arrow type indicator, the strategy behind its signals is based on the MFI indicator with trend filter using Halftrend formula, this indicator can be used alone or mixed with other tools. NOTE : THIS INDICATOR DOESN'T REPAINT OR BACK PAINT, AND ITS ARROW SIGNALS ARE NOT DELAYED. ---------------------------------------------------------------
FREE

SilvMAT EA - XAGUSD 白银自动交易系统 SilvMAT EA 是 Marc Albrecht Trading 专门为 XAGUSD 开发的 Expert Advisor,结合自动 Cycle Trading、神经网络入场逻辑、可配置 Grid、利润保护和账户级风险控制。 优化品种: XAGUSD Timeframe: M15 推荐环境: RoboForex ProCent + KXTL Live MAT Trading Account 可通过我们的 MQL5 Signal 查看一个 Live MAT Trading Account: https://www.mql5.com/zh/signals/2389532 专门为 XAGUSD 开发 SilvMAT EA 专门针对白银,不是通用 Multi-Symbol 系统。XAGUSD 有自己的 Volatility、Spread、Liquidity 和 Session 特性,因此策略围绕白银条件进行校准。 SilvMAT EA 将神经网络入场分析与动态 Cycle Management 和可配置 Trading Cont
FREE

Wave Reversal Indicator - determines the direction of trend waves and price reversals.
The indicator shows wave movements and trend directions. It gives recommendations where to follow the trader, helps to follow the trading strategy.
It is an addition to an intraday or medium-term strategy.
Almost all parameters are selected for each time frame and are changed automatically, the only parameter for manual adjustment is the wavelength.
Works on various trading instruments and timeframes, recomme
FREE

Adjustable Fractal MT4 is a modification of Bill Williams' Fractals indicator. The fractal consists of a two sets of arrows - up (upper fractals) and down (lower fractals). Each fractal satisfies the following conditions: Upper fractal - maximum (high) of a signal bar exceeds or is equal to maximums of all bars from the range to the left and to the right; Lower fractal - minimum (low) of a signal bar is less or equal to minimums of all bars from the range to the left and to the right. Unlike a s
FREE

如果您在TradingView上使用Inside Bar,在那里发现内部柱轻松且令人愉悦,但在MQL市场找不到它 - 您的搜索到此结束。 InsideBar Highlight为什么? 简单易懂:内部柱变得简单。我们的工具专注于蜡烛本体,让您看到重要的部分,没有任何麻烦。 您的风格,您的选择:喜欢五颜六色还是全部相同?由您决定。轻松发现上升或下降的动态。 贴心适配:我们的突出显示不仅仅是为了好看。它完美适应每根蜡烛,使您的图表清晰易读。 援助之手: 如果您遇到任何困难或对使用我们的工具有疑问,我们在这里为您提供帮助。欢迎您的留言,我们将竭诚为您提供所需的任何帮助。InsideBar Highlight 4不仅仅是一个工具; 它是一个支持性的社区,您的问题和经验都很重要。
FREE

XU Gold ST ATR H1 Strategy is a fully automated MetaTrader 5 strategy designed to capture structured directional movement on XAUUSD using a SuperTrend and ATR-based framework with volatility-adjusted risk management and disciplined exit rules.
The strategy is designed for Gold / XAUUSD on the H1 timeframe. Its goal is to participate in cleaner directional Gold movements while avoiding excessive noise that is common on lower timeframes. Gold is a highly reactive market, often influenced by macr
FREE

The XU_H4_910440109_S_PS_CF_SQX is an algorithmic trading strategy for MetaTrader, tested on XAUUSD (Gold) using the H4 timeframe from April 1, 2004, to April 24, 2024. There is no need to set up parameters, all settings are already optimized and fine-tuned.
Recommended broker RoboForex because of EET timezone.
You can find the strategy source code for StrategyQuant at the link: https://quantmonitor.net/gold-bulls-power-trader/
Key details are:
Parameters
MagicNumber: 910440109
Main Ch
FREE

关于 Range Explosion Range Explosion 是一款功能强大且免费的交易工具,用于检测市场震荡区间、绘制精确的支撑和阻力,并以高精度和精美的视觉效果识别突破机会。
它是 Break Out Explosion 项目的一部分,为初学者和专业交易者提供可靠且先进的解决方案。 此产品的 MT5 版本可在此获取:
https://www.mql5.com/en/market/product/153004
\如果您对突破交易概念感兴趣,请查看这款用于检测趋势线突破的高级工具:
https://www.mql5.com/en/market/product/155132 您想要一个根据此指标箭头进行交易的智能交易系统(EA)吗?您只需通过以下链接以 $30 创建一个直接任务,我将为您制作:
https://www.mql5.com/en/job/new?prefered=eeecad 加入我的 MQL5 频道,获取最新更新和新产品发布信息。: Join 主要功能 自动区间检测 – 实时识别市场震荡区。 智能突破信号 – 等待价格突破支撑或阻力并标记买卖信号。 清晰的可视化设
FREE

Представляю новый индикатор — Profit Reaper! Это чистый Price Action, усиленный алгоритмом. Как он это делает? Мощный сканер Engulf-паттернов: Сканирует рынок 24/7 в поиске сильнейших паттернов "Поглощение". Фильтр RSI | инд. стабильности: Отсеивает слабые сигналы с помощью RSI и фильтра стабильности. ️ TP/SL на основе ATR: Мгновенно определяет оптимальные TP и SL на основе ATR. ️ Мгновенные алерты на сигналы Основа — паттерн "Поглощение": Индикатор находит классические бычьи и
FREE

具有多时间框架支持、可自定义视觉信号和可配置警报系统的相对强弱指数(RSI)指标。
自由职业编程服务、更新和其他TrueTL产品可在我的 MQL5主页 获取。
非常欢迎您的反馈和评价!
什么是RSI? 相对强弱指数(RSI)是一种动量振荡器,用于测量价格变化的速度和幅度。该指标在0到100之间振荡,比较在指定期间内近期涨幅与近期跌幅的大小。 RSI主要用于识别超买和超卖状态。高读数表示超买状态,而低读数表示超卖状态。交易者还会关注RSI与价格走势之间的背离,这可能预示着潜在的趋势反转。 功能特点: 带箭头和垂直线的视觉信号标记 三个独立信号缓冲区,带可配置触发器(方向变化、水平交叉、峰值/谷值、极端区域) 具有时间范围过滤的可配置警报功能(电子邮件、推送、声音、弹窗) 带插值方法的多时间框架(MTF)功能 多种绘图和颜色模式(直方图/线条,简单/方向/水平基础着色) 带可选中间水平的可调超买/超卖水平 用于Expert Advisor(EA)集成的自定义指标调用(iCustom)缓冲区访问 输入参数: 基本设置: RSI参数: 周期(默认:14)、应用价格、K线位移偏移量。 多时
FREE

Double Band Reversal indicator MT4
Indicator based on bollinger bands and it shows arrows of high profit strategy in overbought / oversold areas. the strategy is suitable for sideways markets like EURUSD AUDUSD EURGBP USDCHF CADCHF 15min 1H timeframes and more...
Expert Advisor + Live Signal based on this indicator : https://www.mql5.com/en/market/product/184273?source=Site +Profile
FREE
Our modernised version of the popular Order Blocks Indicator for MT4 identifies major trend reversal and momentum exhaustion points by providing arrow signals on the chart. As a result, traders can identify bullish and bearish price reversal zones and BUY and SELL accordingly. Moreover, the indicator provides Buy and Sell Arrow signals.
An order block is a market structure that is defined as the last bearish candle before a bullish price move and vice versa. These order blocks act as support a
FREE

Key Features of the Indicator: Buy & Sell Signals: The indicator generates buy and sell signals based on specific conditions. It uses the crossover of the Fast Moving Average (Fast MA) and Slow Moving Average (Slow MA) to determine market entries. The RSI (Relative Strength Index) is used to identify buy signals when RSI is above 50 and below 75. It also considers support and resistance levels for additional confirmation of signals. Trend Filter: The market trend is identified using a Trend Movi
FREE
MetaTrader市场是 出售自动交易和技术指标的最好地方。
您只需要以一个有吸引力的设计和良好的描述为MetaTrader平台开发应用程序。我们将为您解释如何在市场发布您的产品将它提供给数以百万计的MetaTrader用户。
