 MetaTrader 5
 专家
专家
 指标
指标
 程序库
程序库
 实用工具
实用工具
 窗口小部件
窗口小部件
 规则
规则
适用于MetaTrader 4的免费EA交易和指标 - 10
 EA交易自动执行市场交易,而指标可使您更准确地分析报价并预测价格行为。
通过这些应用程序,您将能够更明智地在MetaTrader 4执行交易,抓住更多的交易机会。
EA交易自动执行市场交易,而指标可使您更准确地分析报价并预测价格行为。
通过这些应用程序,您将能够更明智地在MetaTrader 4执行交易,抓住更多的交易机会。 
来自任意周期的订单块,带提醒——还有一张表格如实告诉您它们在您的图表上是否有效。 ICT Order Blocks Honest Stats 绘制本周期或更高周期的订单块,将每个标记为新鲜、已测试或已突破,在价格回到新鲜订单块时提醒您,并在您图表的历史上衡量这些订单块相比同等大小的虚拟区域守住的频率。免费,属于 Honest Stats 系列。 Market Structure MT4(免费) | MT5 版本(免费) | 免费:FVG Honest Stats | 免费:Liquidity Levels | 免费:SMT Divergence | 免费:Killzones 新品:所有 ICT 概念集于一个指标 -> ICT Pro All in One Honest Stats (9 个因素的共振分数、提醒和多品种扫描器) 新品(免费):Silver Bullet 时间窗口,附扫荡 + FVG 信号和提醒 -> ICT Silver Bullet Honest Stats (伦敦、纽约上午和下午窗口,倒计时,同样的诚实统计表) 新品(免费):带提醒的溢价 / 折价和 OTE 区 ->
FREE

Discover the power of precision and efficiency in your trading with the " Super Auto Fibonacci " MT4 indicator. This cutting-edge tool is meticulously designed to enhance your technical analysis, providing you with invaluable insights to make informed trading decisions. Key Features: Automated Fibonacci Analysis: Say goodbye to the hassle of manual Fibonacci retracement and extension drawing. "Super Auto Fibonacci" instantly identifies and plots Fibonacci levels on your MT4 chart, saving you tim
FREE
This is a powerful, session-aware breakout indicator designed for serious traders who thrive on volatility and structure. Engineered for precision, it identifies high-probability breakout zones during the London and New York trading sessions—where the market moves with intent. Key Features: Session Range Detection
Automatically detects and highlights the key price range of London and New York sessions. Breakout Confirmation
Identifies breakout candles after the session range, with cl
FREE
Thank you for your interest in "Goldfish Indicator". I have been trading since 2008. I usually trade on Renko chart in reversal pattern with Goldfish Indicator. If you share your vps details with me, I will connect your account (Live/Demo). To get proper results copy my trades for at least 30 days. Minimum Deposit: $1000 Leverage: 100:1 Profit Target: Monthly average profit target is 10% to 20%+/- Draw-down: The average drawdown is 10% to 20% Risk
Warning: Trading financial products on margin
FREE
"GA Moving Average"("GA 移动平均线")是一个移动平均线交叉策略的专家顾问(EA),它具有可调整的设置,可根据您的想法打造完美的交易策略。
"GA Moving Average"的核心概念是利用移动平均线指标来识别潜在的交易机会。通过分析不同移动平均线之间的相互作用,该EA旨在生成市场上的买入和卖出信号。
主要特点和自定义选项: 1. 移动平均线参数:交易者可以定义特定的移动平均线期数(短期和长期),以适应其交易风格和偏好。这提供了灵活性,以适应不同的市场条件和时间框架。
2. 交叉信号生成:该EA监控短期移动平均线与长期移动平均线的交叉。当短期移动平均线向上穿过长期移动平均线时,生成一个看涨信号,表示可能的买入机会。相反,当短期移动平均线向下穿过长期移动平均线时,生成一个看跌信号,表示可能的卖出机会。
3. 风险管理:该EA包含风险管理功能,允许交易者控制市场风险敞口。用户可以指定交易手数、止损和止盈水平等参数,以管理风险并保护交易资本。
4. 可自定义参数:"GA Moving Average"提供一系列可调整的参数,用于优化策略。交易者可以尝试不
FREE

这是免费产品,欢迎您使用以满足您的需求!
如果您喜欢这个指标,请留下简短的好评!非常感谢! .............................................................. 点击这里查看高质量的交易机器人和指标! ......................................................... 适用于 MT4 的 Crypto_Forex 指标“DeMarker 带警报”,无需重绘。 - DeMarker 振荡线指示当前价格相对于先前高点和低点的位置。 - 内置电脑和移动设备警报,用于:进入超卖/超买区域以及退出超卖/超买区域。 - 警报触发级别可调。 - DeMarker 提供最有效的常规背离信号,优于其他振荡指标。 - 当 DeMarker 高于 0.7 时,为超买区域;低于 0.3 时,为超卖区域。 - 指标适用于任何时间范围。 - 该指标也非常适合与价格行为技术结合使用。 本产品为原创产品,仅在 MQL5 网站提供。
FREE

Hello everyone,
Today I want to share with you a sclaping strategy who can works on many currency pair timeframe M1 .
Multicurrency Scalper is not a spread sensitive scalper . Multicurrency Scalper is an expert with a backtest around 67% of winrate . Multicurrency Scalper is very easy to use . Multicurrency Scalper do not use any dangerous strategy . Multicurrency Scalper can work on XAUUSD, EURUSD, GBPUSD, USDJPY, AUDCAD, EURCHF and many others.
This expert is free because results are variab
FREE

GRock EA – XAUUSD Smart Grid Recovery System GRock EA is a professional automated trading solution developed specifically for XAUUSD (Gold) on the H1 timeframe. The system combines trend-following logic, adaptive grid management, and integrated risk controls to provide a structured approach to automated gold trading. Designed for traders seeking a balance between opportunity and risk management, GRock EA continuously analyzes market conditions and adapts its behavior based on volatility and
FREE

EA PROMO EXPIRED 2022.12.12 (12 December 2022)......!!!!
.... NEW VERSION WITH 6 INDICATORS SETTING ON OR OFF (MA,RSI,CCI,MACD,STOCHASTIC,PARABOLIC SAR).... Automatic EA (With 6 indicator setting TRUE or FALSE) Manual trade (Buy,Sell,Trailing stop,Close buy,Close sell,Close profit,Close all) Local copy trading Full Panel indicators (SnR,Fibonacci,Currency strength,trade panel) Push notification,email,STP ALLINONE EA (All strategy in one EA) Hedging (on/off),martingale (on/off),anti martingale
FREE
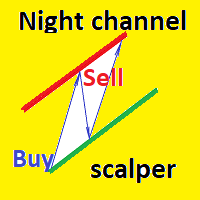
Night channel scalper is a fully automatic trading advisor. The strategy of night scalping in the channel, working hours 2-3 hours. Advisor does not use martingale. does not use a grid, does not use hedging. All trading orders are protected by stop loss, the recommended timeframe for working M5 is M15. It has a setting of dynamic take profit and stop loss. The minimum deposit for work is 10 -15 dollars for one currency pair, leverage 1: 500
Settings
Take Profit - Fixed Take Profit Dynamic Take
FREE

SK Gold Trader desire based on ZigZag indicator. Trading style breakout system no use dangerious method (Use only pending order, stoploss and takeprofit). EA enters the market with market orders from 3h to 19h(can change it).
Supported currency pairs: XAUUSD
Recommended timeframe: M30, H1 Easy to use and Simple. No Martingale/No grid. Works for ECN/Non-ECN brokers. A low latency vps and an lower spread broker is always recommended. Support us by open My recommended broker. IC Market E
FREE

Indicator designed for both beginners and professionals. RECOMMEHDATION Trade with this indicator for 2-3 weeks and you will feel significant progress in your trading. This indicator is developed based on the use of HMA, Laguerre, CCI . The indicator is clear and does not require any setting. Does not redraw and works by opening bar. It works on timeframes M1-D1. I use timeframe M5 to enter the market.
FREE
该指标显示任何时间范围内任何品种的最小化图表。显示的最大图表数为 28。图表可以位于主窗口和底部窗口中。两种显示模式:蜡烛图和条形图。显示的数据量(条形图和蜡烛图)和图表大小是可调的。 参数: Corner - 显示起始角(从列表中选择) CandleMode - 显示模式:true - 蜡烛,false - 柱 ShowLastBid - 启用/禁用最后价格显示 LastBidShiftX - 最后价格线 X 轴偏移(所有偏移用于更准确的显示) LastBidShiftY - 最后价格线 Y 轴移动 ColorLB - 最后价格线颜色 BarsToDisplay - 显示的柱/蜡烛数量,没有当前的 LineColor - 线条颜色(十字星蜡烛) BullColor - 看涨条/蜡烛颜色 BearColor - 看跌柱/蜡烛颜色 ScaleColor - 刻度颜色 WindowNumber - 图表显示窗口的编号(0 - 主窗口) CornerX - 从一个角缩进 X 轴 CornerY - 从一个角按 Y 轴缩进 ChartWidth - 每个图表窗口的宽度 ChartHeight
FREE

Our offer also includes a free panel — Indicator Panel — which allows you to show or hide indicators created by BOToBRACIA -> MT4 / MT5 Our offer also includes a version for MetaTrader 5 -> https://www.mql5.com/en/market/product/171227?source=Site+Market+My+Products+Page
High and Low Points is a practical technical analysis indicator that plots levels corresponding to the highs and lows from previous periods (day / week / month) — levels that, in the Smart Money Concepts (SMC) and ICT app
FREE

具有双线信号、三级系统、多时间框架支持、可自定义视觉信号和高度可配置警报系统的高级随机振荡器。
自由职业编程服务、更新和其他TrueTL产品可在我的 MQL5主页 获取。
非常欢迎您的反馈和评价!
什么是随机振荡器? 随机振荡器是一种动量指标,它将证券的收盘价与特定时期内的价格范围进行比较。该指标由两条线组成:%K(主线)和%D(信号线——%K的移动平均线)。 随机振荡器在0到100之间振荡。高读数表示超买状态,而低读数表示超卖状态。%K和%D线之间的交叉以及穿越水平边界的移动通常被用作交易信号。 功能特点: 具有三级系统(高、中、低)的双线随机振荡器(%K和%D) 带有三个独立可配置信号缓冲区的视觉信号标记(箭头、垂直线) 两条线的高级信号检测:方向变化、线交叉、水平交叉、峰值/谷值 具有时间范围过滤的可配置警报功能(电子邮件、推送、声音、弹窗) 带插值的多时间框架(MTF)、多种颜色模式以及用于EA集成的iCustom缓冲区访问 输入参数: 基本设置: 随机参数: K周期(默认:5)、D周期(3)、减速(3)、MA方法、应用价格。 多时间框架: 随机时间框架选择及MTF插值模
FREE

The Super Arrow PRT Indicator generates high-probability trading signals by using multiple indicators such as Moving Averages, Bull/Bear power, Relative Strength Index (RSI), Bollinger Bands, and Magic Filter. It filters out false signals and provides good trade signals by combining these indicators. The Supper Arrow PRT indicator is a trend reversal system that paints buy/sell signal arrows at the potential reversal zone of the price. The buy/sell signal arrows are painted directly on the ch
FREE

MTF RSI Candles on Current Chart MT4 Non-repainting multi timeframe RSI candle colouring Overview MTF RSI Candles colours the candles on your chart using the RSI of a higher timeframe. You keep working on the timeframe you normally trade. In the background the indicator watches RSI on a higher timeframe you choose. When that higher timeframe closes a candle, the RSI is read once and the colour is set: • MTF RSI candle closed above the level – Current chart candles turn the Buy colour. •
FREE
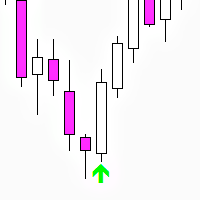
Three Bar Reversal (MT4) — free indicator Three Bar Reversal is a simple and effective MetaTrader 4 indicator that detects the classic three-bar reversal candlestick pattern with additional filtering based on ATR and candle body sizes.
Arrows are displayed on the last closed candle of the pattern, and push notifications are also sent. An automated trading robot Three Bar Reversal EA has been developed based on this indicator. The indicator works on all currency pairs and timeframes but pe
FREE

SnR Trend Direction MT4 by RWBTradeLab
A clean, non-repainting multi-timeframe trend dashboard for MetaTrader 4 that tells you the REAL trend direction — detected the classical SnR way. No moving averages, no oscillators: the trend is derived purely from classical Support/Resistance behavior (level creation, rejection and confirmed breakouts), exactly how a classical SnR trader reads the market by hand.
What This Indicator Does
The indicator shows the confirmed trend direction (Bullish / Bea
FREE
The ADX Indicator is known to be used to determine the trend direction. Not only that, but it also has deviation (+DI and -DI) that determine the direction of the trend as well. The role of the indicator is to spot the trend and its direction and generate signals accordingly.
Indicator Settings: - ADX period : default is 14 periods (it works best with the timeframe H1). - Signal Width : the size of signals arrows. - Signal Distance : the distance of the signal arrow from the candle. - Signal co
FREE
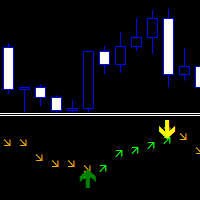
Direction Change Detector — 区分看涨和看跌走势之间平衡的趋势指标。它有两条箭头,并带有确认其方向的信号。
可以作为寻找趋势的独立指标,也可以作为开启交易和遵循信号方向的附加工具。
适应任何市场和时间范围。 没有在历史上重现他的证词。 有几种类型的通知。 指向上方的绿色箭头表示价格看涨方向。 指向下方的橙色箭头表示价格看跌方向。 有 1 个可自定义的参数来改变读数。当方向数量增加时,价格变得更平滑(用于较低的时间框架),当方向数量减少时,价格变得更早(用于较高的时间框架)。
Length Directions - 用于计算方向变化的蜡烛数量。 ----------------------------------------------------------------------------
FREE

SNIPER INVICTUS: GOLD PULSE – Professional XAUUSD Algorithm Turn Market Volatility into Profit with the Hybrid Mirror System. SNIPER INVICTUS is not just a simple grid EA; it is a high-performance trading engine designed specifically for XAUUSD (Gold). Developed by NAIL FX Trading, this system bridges the gap between precision trend-following and smart recovery logic. EA has added new features with the latest update, including limit and stop order features, and a B-plan feature within the mirro
FREE

Impulse System MTF 按照 Alexander Elder 描述的 Impulse System 为图表上的K线着色,并且可以取用更高周期的着色结果,而不局限于你正在看的这个周期。Impulse System 结合了一个趋势度量和一个动量度量:收盘价的指数移动平均线,以及 MACD 的柱状图。两者同时上升时K线为绿色,两者同时下降时为红色,两者不一致时为蓝色。
这三种状态的用处,在于 Elder 赋予它们的职责。Impulse System 是一个否决系统,而不是信号发生器。绿色不代表买入,它代表在多头同时掌握趋势和动量期间禁止做空。红色不代表卖出,它代表禁止做多。蓝色代表任何一方都没有控制权、两个方向都被允许,而这在实际盘面上正是趋势结束和开始的位置。按这种方式理解,这套着色是一层叠加在你现有入场方法之上的过滤器,而不是对它的替代。
本指标有两种运行模式,并根据你选择的周期自动切换。当所选周期与图表周期相同时,它就地为图表本身的K线重新着色。当你选择更高的周期时,它会把那个周期的K线作为叠加层画在当前图表上,因此你在五分钟或十五分钟图上操作时,日线或四小时的结构
FREE

该程序将使分析多个时间范围更加方便。
这将有助于在不同的时间范围同步图表中同步所有图表以显示相同的符号, 相同的特定时间段和同步绘图对象同时显示在所有图表上
在这个版本中,只有 6 种对象类型可以同步所有图表。
绘图对象类型支持:垂直/水平线、趋势线、矩形、箭头、斐波纳契回撤
附加功能:趋势线警报 如果您想在价格触及趋势线时获得警报,您只需在描述字段中将“alert”一词放在趋势线属性中, 当价格触及该趋势线时,MT4 会弹出提示信息,您也将通过 MT4 App 收到通知
使用方法>> https://youtu.be/NEHUW7v1h1c
报告问题或关注最新版本更新
网站: www.RookieTraders.com LineID:@RookieTraders
FREE

======================================================== XAUUSD ELLIOTT WAVE + REAL YIELD (BIG DASHBOARD) - MQL5/MT4 MARKET DESCRIPTION (formatting: **bold** = Bold button; lines with • = bullet list; UPPERCASE = heading) ========================================================
OVERVIEW ------------------------------------------------------- **XAUUSD Elliott Wave + Real Yield (Big Dashboard)** is the dashboard edition of the Elliott + real-yield engine: the same ZigZag/Elliott structure and ma
FREE

基于突破水平的趋势指标,是一款专为外汇交易者打造的智能分析工具。
它能够通过识别价格在关键支撑位和阻力位的突破情况,帮助交易者更快、更清晰地把握市场趋势,及时捕捉入场机会。 与普通指标不同,这款指标只需一个参数设置,就能迅速适应任何交易品种和市场环境。
无论您是进行外汇、黄金、大宗商品,还是指数交易,它都能根据不同的波动特性快速完成调整,从而大幅减少繁琐的优化过程。
这种简单而高效的设计,让交易者能够专注于策略执行,而不是浪费时间在复杂的参数调试上。 该指标的另一个重要优势是——绝不重绘。
这意味着它的信号稳定可靠,不会在图表更新后发生变化,从而避免了虚假信号带来的困扰。
这对短线交易者和趋势跟随者尤其有价值,因为他们最需要的就是清晰且稳定的交易信号。 提醒功能十分全面: 手机 PUSH 通知 —— 即使您不在电脑前,也能第一时间获取信号。 桌面弹窗提醒 —— 方便在活跃交易时快速响应。 邮件提醒 —— 适合长期监控或离线查看。 此外,指标在收盘时自动绘制清晰的箭头,标记潜在的入场点,避免了因盯盘不足而错过机会的情况。 兼容性方面,该指标可应用于 任何 MT4 交易品种和任意时间周
FREE

======================================================== GOLD WAVE LEVELS (ELLIOTT-ALIGNED) - MQL5/MT4 MARKET DESCRIPTION (formatting: **bold** = Bold button; lines with • = bullet list; UPPERCASE = heading) ========================================================
OVERVIEW ------------------------------------------------------- **Gold Wave Levels** draws a tested wave backbone for gold and validates signals against **Elliott theory hard-rules**, with higher-timeframe context and per-timeframe
FREE

市场在启动之前会先安静下来,这扇窗口把这句话的两半都展示出来。Squeeze Momentum MTF 会标记出布林带完全落在肯特纳通道内部的柱线,打印出这次压缩释放的精确柱线,并为动量柱状图上色,让你看清能量在释放那一刻是站在哪一边,无论是在当前周期,还是在这里直接画出的更高周期。免费,没有试用期,也没有被锁住的功能。 它回答的第一个问题是,市场当前是否处于压缩状态。布林带会与肯特纳通道进行比较:当布林带完全落在肯特纳通道内部时,波动率已经收缩,市场处于挤压状态。当布林带重新突破到通道外时,挤压就已经释放。 第二个问题是压缩的能量指向哪一边。经过去趋势处理的价格序列会用线性回归拟合,这条拟合线的终点就是动量柱状图。它的正负号说明方向,颜色还说明当前柱线相对上一根是在扩大还是在减弱,因此一根仍为正值但正在收缩的柱线,读法与正值且在扩大的柱线完全不同。 它所支撑的判断是:市场原本安静,刚刚结束了这种安静,而这里显示的正是那一刻动量所在的一边。 图表上能看到什么 在它自己的子窗口里有两样东西。动量柱状图有四种颜色:正值扩大、正值减弱、负值扩大、负值减弱。零轴上还有一行点,分三种状态:无挤压
FREE

UzFx-Total TP'SL & Timer-MT4指标旨在实时追踪所有已开仓及挂单交易的总止盈(TP)与止损(SL)值。此外,它还包含一个K线倒计时器,用于显示当前K线收盘的剩余时间。
核心功能:
自动计算所有活跃交易与挂单的预期盈亏总额。 显示当前K线收盘剩余时间,助力交易者高效管理进出场时机。 支持自定义文本颜色、字号及位置以提升可视性。 简约轻量化设计,不干扰图表布局。
用户设置: 可选择止盈/止损显示颜色。 自定义K线计时器文字颜色。 调整字体大小及图表位置。
应用场景:
适用于希望快速掌握风险回报水平而无需手动核查每笔订单的交易者。 适合依赖K线收盘时间精准执行交易的短线交易者和日内交易者。 通过直观监控潜在盈亏水平,强化风险管理能力。
FREE

Free indicator, that displays the remaining time until the current candle closes directly on the chart. Designed for traders who demand precision and timing, this lightweight and fully customizable tool enhances your trading experience. It is easy to install, compatible with all assets, markets, and timeframes, and provides real-time updates to support smarter decision-making.
FREE

Ultimate AI Trader – MT4 Expert Advisor Version: 2.20
Developer: Ljubomir Nikolic Platform: MetaTrader 4 Version: 2.30 Supported Instruments: XAU/USD, EUR/USD, major FX pairs System Type: Modular breakout EA with AI signal logic and full local control
Core Features: • Multi-Timeframe Analysis Combines M15 and H1 to identify high-probability entry zones. • Breakout Logic Entry is triggered based on candle color, price breakout, and trend confirmation. • VWAP Trend Filter Prevents trades agains
FREE

RSI Turn Finder 指标是一套适用于 MetaTrader 4 的 非重绘型动能拐点捕捉系统 。它监测 14 周期 RSI 向上突破可配置的正向阈值(默认 65)的精确时刻,并要求 5 周期收盘价 EMA 同时向上,以此确认动能;在此基础上将得到的趋势偏向“锁定”,并在图表上以双配色 EMA(low, 10) 趋势线的形式显示当前状态。每次状态切换时,都会在图表上打印 “Positive” 或 “Negative” 标签,并实时触发四通道提醒。MT4 与 MT5 构建版本在相同数据上生成的视觉效果和逻辑输出完全一致。 MT5 版本请查看: RSI Turn Finder MT5 更多作者产品: 查看所有产 品 想查看实盘示例和最新工具,请访问我的个人主页并发送好友请求,以免错过更新! 工作原理 RSI 穿越 + 动能确认 “Positive” 正向拐点只会在收盘完成的 K 线上,同时满足以下四个条件时触发: 前一根 K 线上的 RSI 低于正向阈值 当前 K 线上的 RSI 高于正向阈值(向上穿越事件) 当前 K 线上的 RSI 高于负向阈值(区间保护) EMA(cl
FREE

Trex – 趋势识别与入场信号指标 Trex 是一款强大而简洁的趋势跟随指标,旨在帮助交易者以高可视化方式识别市场趋势和精确的入场点。 Trex 基于布林带和移动平均线的斜率分析,并结合智能外部过滤器,尽可能减少错误信号,提高整体交易准确性。 该指标专注于趋势交易,避免不必要的复杂性,适合初学者和专业交易者使用。 如何找到更好、更专业的工具: 加入 Koala Trading Solution 频道 在 MQL5 社区中获取所有 Koala 产品的最新消息 我最优秀的指标,已被100多位交易者信赖 Market Structure Break Out 下载 MT4 下载 MT5 主要功能 趋势识别系统
Trex 会自动识别当前市场趋势,并在图表上直接显示清晰的趋势线和入场信号。 高级信号过滤
内置外部过滤器有助于避免低质量和虚假信号,提高交易信心。 实时交易仪表盘
用户友好的仪表盘显示:
实时信号状态
实时信号的 ATH 盈利
回撤
用于实时决策的重要交易信息 提醒与通知
当新的趋势入场信号出现时,可立即收到提醒,帮助您根据趋势方向轻松进场交易。 简洁清晰的设计
Tr
FREE
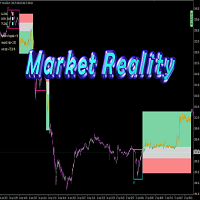
Hello, As you know more than 90% of people in the financial markets are losers, the most important reason is the lack of a proper fixed system and risk management. I want to introduce you to an indicator that is the result of my 8 years of experience, which shows you the reality of the market. My human dignity does not allow me to guarantee the future, but the table below shows the past statistics of this indicator and its performance which really the market past is the only way to find out the
FREE
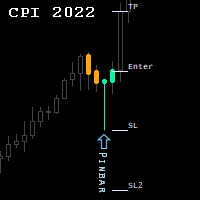
Candlestick Patterns Indicator.
NEW! FREE Candlestick Patterns Expert Advisor > https://www.mql5.com/en/market/product/105634?source=Site +Profile
The Indicator draws colored candlestick patterns, their description and future levels of Stop Loss / Take Profit. Combined with other market analysis, can greatly improve trading results. Indicator can be highly customized by the user including change of colors, fonts, levels, candle sizes etc...
developed, tested and optimized on " VantageMarke
FREE

TCL Trend Radar is a multi-timeframe trend dashboard for MetaTrader 4. It applies a three-condition algorithm (Moving Average cross plus Directional Movement Index plus Average Directional Index gate) to grade the trend on every standard timeframe and displays the result on a single panel. How It Works For each timeframe the indicator computes three things: the relationship between a Fast and a Slow Moving Average, the Directional Movement Index (DMI) for trend direction, and the Average Directi
FREE

-- 简单而有效。 反转指标 - 是什么?
一种结合超级趋势逻辑与指数曲线技术的趋势跟随叠加指标。它能识别趋势方向,在图表上绘制动态通道,并在趋势反转时发送实时警报。
工作原理
该指标通过ATR与超级趋势因子计算指数基准线。当价格收盘突破该基准线时,确认趋势反转。绿色箭头标记买入趋势启动,红色箭头标记卖出趋势启动。
功能特性:
基于ATR的指数趋势基准线与动态通道 绿色/红色趋势线及填充通道 趋势反转时的买入/卖出箭头信号 内置警报:弹窗、推送通知、邮件、声音 重复警报防护(每根K线仅触发一次警报) 完全可定制:颜色、线条粗细、箭头尺寸、通道宽度 无延迟的简洁图表叠加层
输入参数:
指数速率、超级趋势因子、ATR周期、通道宽度 开关控制:通道填充、箭头、各警报类型 所有视觉元素支持全色系定制
最佳适用场景:任意品种、任意周期。适用于外汇、指数、大宗商品及加密货币图表。
FREE
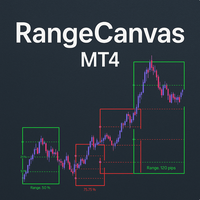
Daily Range Boxes : The indicator draws rectangular boxes around each day's high and low prices, creating a clear visual boundary for the daily trading range. Color-Coded Logic : Green boxes when the current price (or close) is above the daily open Red boxes when the current price is below the daily open Percentage Level Lines : Inside each box, it draws three horizontal lines at: 25% of the daily range 50% of the daily range (midpoint) 75% of the daily range Range Information : Each box displa
FREE

VWAP and Moving Average A combination of Supertrend and Moving Average to create a converging trade setup Input parameters: signal mode: set it to true if you want to plug it into STAT (Signal Tester and Trader) arrow shift: distance between fast EMA line to arrow on chart turn on moving average signal for converging setup VWAP period MA period MA averaging method MA pricing method upper level limit ( VWAP ) lower level limit ( VWAP ) You can find the best setting for 4 hour EURUSD on this v
FREE

RSI Divergence same as Tradingview
Get RSI Divergence Pro for early Signals & RiskTool Description:
RSI Divergence is a technical indicator for MetaTrader that plots the Relative Strength Index in a separate window and automatically detects and draws regular bullish and bearish divergence between price and RSI. Ported from a TradingView Pine Script version, so the calculation and pivot logic match what many traders already use on TradingView.
A bullish divergence is marked when price makes a
FREE

Round Numbers Levels indicator for MT4 Round Numbers indicator is a simple but useful indicator to draw 00 and 50 price levels in your chart.
These levels act as supports and resistances, and therefore should be taken into account when trading.
These levels can be used as profit targets or entry points.
Inputs of the indicator are:
TGridColor00: color to be used for xx00 levels GridStyle00: line style to be used for xx00 levels GridWidth00: line width to be used for xx00 levels GridColor50:
FREE

Precision Trend Filter is an adaptive noise-filtering trend indicator that identifies real market direction while ignoring false moves and choppy price action.
The indicator uses a proprietary filtering algorithm with ATR-based dynamic thresholding to separate genuine trend shifts from random market noise. The result is a clean, color-coded trend line that holds flat during consolidation and tracks price aggressively during real trends.
Key Features
- Color-changing trend line: green for
FREE
Algorithm EA,or double hedge EA is your tool by using a double hedging mechanism. The EA open a trade in a trending market - no matter which direction.You can set also Tp and SL, but it is not needed,because of basket profit and amounth of opened position,which you can preselect and fit to your deposit.Min deposit is about 1000 $,0.01 Lot recomended.
This EA uses a hedging technology In case the market moves in the unfavorable direction, the EA starts hedging your trade by placing an opposite o
FREE

Product Type: Indicator
Platform: MetaTrader 4
Category: Trend / Signal Indicator SSB Indicator — Non-Repainting Buy/Sell Signal Indicator with Live Stats Panel SSB Indicator is a signal-based tool that plots clear, non-repainting Buy and Sell arrows directly on the chart, along with a live on-chart statistics panel so you can track performance in real time. Key Features: Non-repainting Buy/Sell arrow signals Automatic Win/Loss tracking with a live statistics panel Win rate displayed with simple
FREE

该实用程序允许您在策略测试器中手动测试您的策略。在可视化图表上一键交易。
该实用程序的最新版本为交易者提供了手动测试其交易策略的高级功能。借助策略测试器,您现在可以在模拟环境中评估交易策略的有效性。此功能允许您分析交易技术的表现并对其进行改进以提高您的交易技能。 此外,策略测试器提供了一种便捷高效的方式来执行交易,在可视化图表上一键交易。此功能使您能够以所需的价格水平快速进入和退出交易,而无需在不同屏幕之间切换。 借助策略测试器中提供的完整功能,您可以有效且高效地模拟和完善您的交易策略、分析结果并优化您的交易技能。 MT5 版本
详细描述 +DEMO +PDF 如何购买
如何安装
如何获取日志文件 如何测试和优化 Expforex 的所有产品 警告:此面板供策略测试人员使用! 对于实时图表上的一键交易,您可以下载我们的实用程序 VirtualTradePad for MetaTrader 4 和 VirtualTradePad for MetaTrader 5 。 结合我们 EA 通用面板 EAPADPRO 的优点和 VirtualTradePad交易
FREE

部分关闭和跟踪 - 辅助 EA。在回滚期间关闭部分头寸(关闭部分手数)。 当价格首先向盈利方向移动,然后又回来时,EA 会在部分平仓中关闭盈利头寸。 Exp Trail Partial Close PRO for MT5 如何购买
如何安装
如何获取日志文件 如何测试和优化 Expforex 的所有产品 EA 监控仓位。 如果价格向利润方向移动,则 ea 建立远距离回滚价格的第一水平。 如果价格继续朝着利润方向移动,这个利润水平会继续修改这个回滚水平。 如果价格回落指定的点数,则 ea 关闭部分头寸。 EA 设置下一个价格水平,在该价格水平上将关闭头寸的下一部分。 当部分仓位关闭时,EA 包括止损的 TrailingStop。 只要整个头寸将被关闭,EA 就会继续工作。 您可以在策略测试器中测试“EA 交易”,并在可视模式下使用我们的 EAPADPRO 工具栏进行交易! 例子 买 1 2.00 1.29667 0.00000 0.00000 修改 1 2.00 1.29667 1.29667 0.00000 关闭 1 0.40 1.30174 1.2966
FREE
Summary of the Expert Advisor This EA will trade using standard MT4 indicators such as Moving Averages, MACD, RSI, Bollinger Bands, and so on. The EA was made so that these indicators can be mixed or matched so a number of possibilities can be traded with. Each indicator can be enabled or disabled and many settings are adjustable for each indicator. There are also other features included like multiple time frame capability and money management. As a result, many different trading strategies can
FREE

Trend Pulse Trader is a simple trend-following Expert Advisor for MetaTrader 4.
It trades in the direction of the moving average trend, confirms entries with RSI, and manages every trade with volatility-based Stop Loss and Take Profit.
HOW IT WORKS
- Trend direction: Fast MA compared with Slow MA on the last closed bar
- Confirmation: RSI must be above (buy) or below (sell) a configurable level
- Stop Loss and Take Profit are calculated from ATR, so they adapt to market volatility
- Optional AT
FREE

ATC Trading Sessions 在您的图表上将悉尼、东京、伦敦和纽约时段绘制为覆盖每个时段高点和低点的框,并添加一个小面板,显示每个市场的实时状态。 时段交易时间以每个市场自身的当地时间设置,欧洲、美国和澳大利亚的夏令时自动应用。无论您的经纪商使用什么时区,框全年保持正确。
此工具也是 All In One Trade Management Panel MT4 的一部分,与仓位工具、交易管理和绩效分析一起。 主要功能: 从时段高点到时段低点的时段框,每个框上显示名称和以点表示的范围。
开盘时段的框随着价格创出新高或新低而增长。
一个面板,显示每个时段是开盘还是收盘、距其收盘或开盘的时间以及开盘时段的范围。
每个时段的 ON/OFF 开关。您的选择会为每个图表记住。
每个时段可调整的开盘和收盘时间。时段可以跨越午夜。
经纪商 GMT 偏移自动检测,或可手动设置。 输入: 时段开盘和收盘时间,格式为 HH:MM,每个以市场的当地时间表示(默认悉尼 07:00-16:00,东京 09:00-18:00,伦敦 08:00-17:00,纽约 08:00-17:00)
绘制
FREE

Forex Trade Manager MT4 simplifies managing open orders in MetaTrader 4. If you open a new order, the manager automatically sets Stop Loss and Take Profit. When price will move, then the program could move Stop Loss to Break Even (stop loss = open price) or continuously moving Stop Loss (Trailing Stop) to protect your profits. Forex Trading Manager is able to control orders for only current symbols (where EA works) or for all opened orders (regardless symbol) and hide the Stop Loss and Take Prof
FREE

这种用于从无穷远衡量货币强弱的创新指标是长期交易的黄牛和交易者不可或缺的助手。 分析货币强弱的系统早已被世界领先的交易者所熟知并在市场上使用。 没有这种分析,任何套利交易都是不完整的。 我们的指标很容易确定基础货币相对于彼此的强弱。 它显示所有或当前货币对的折线图,允许即时分析和搜索最强的入口点。 该指标直观,允许您快速找到并切换到任何一对,具有可放置在地下室和主图表上的移动面板。 通知货币强度变化的计时器模式使交易者有机会在手机上收到通知。
使用货币功率计无穷大指示器的几种策略:
1. 使用货币强度的线性显示图表搜索交叉点作为新兴趋势的信号 2. 在趋势反转信号出现后,向强势货币方向反弹 3. 使用货币强度发散分析扭转当前趋势 4. 使用其他无限指标向强势货币方向交易
FREE
Introduction This indicator detects volume spread patterns for buy and sell opportunity. The patterns include demand and supply patterns. You might use each pattern for trading. However, these patterns are best used to detect the demand zone (=accumulation area) and supply zone (=distribution area). Demand pattern indicates generally potential buying opportunity. Supply pattern indicates generally potential selling opportunity. These are the underlying patterns rather than direct price action. T
FREE

Daily Open Level is a powerful indicator for XAUUSD and all pairs.
It draws the Daily Open price with high accuracy and shows you the daily bias:
- Price ABOVE Daily Open = BUY bias only - Price BELOW Daily Open = SELL bias only
Features: - Daily Open line with price label - Buy/Sell bias dashboard on chart - Distance from Daily Open in points - Alert on cross - Works on all timeframes for Gold and Forex
Best used on M15 and H1 for intraday trading.
FREE
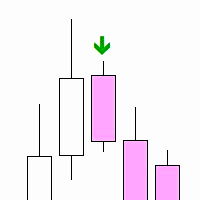
"Inside Bar PA" is a technical indicator designed to determine the inner bars on the chart. An internal bar is a bar or candle, the maximum and minimum of which are completely contained in the previous bar. This may signal a potential reversal or continuation of the trend, depending on the context.
Features: Automatic detection of internal bars. Visual marking of internal bars with arrows on the chart. The ability to adjust the distance of the mark from the bar. How to use: Attach the indicato
FREE

GAMBLERS Games Changer – 20 Pairs in One, Prove it! Is trading gambling??? Yes, if you realize that forex and capital market trading almost entirely resembles gambling. Within seconds, you can become wealthier—or lose everything just as quickly. This undeniable fact sparks endless debates. Some argue trading is just normal commerce with profit and loss, but statistics reveal that over 95% of traders suffer massive losses , while only about 5% manage consistent wins—mostly dominated by globa
FREE

This indicator uses binary codes to predict price movement within the "multiverse and mini-verse" of price. (Due to the coding instruction to capture every momentum, it leaves static lines in DEMO TESTING mode. At the end of testing click on the indicator to open and click OK. It will adjust and remove broken and static lines) It also draws lines at entry price levels on the chart. Just open your positions accordingly at these price levels. You will get many trading opportunities each day with
FREE
YOU CAN NOW DOWNLOAD FREE VERSIONS OF OUR PAID INDICATORS . IT'S OUR WAY OF GIVING BACK TO THE COMMUNITY ! >>> GO HERE TO DOWNLOAD
This system is an Heiken Ashi system based on RSI calculations . The system is a free open source script originally published on TradingView by JayRogers . We have taken the liberty of converting the pine script to Mq4 indicator . We have also added a new feature which enables to filter signals and reduces noise on the arrow signals.
Background
HEIKEN ASHI
Th
FREE

This tool is designed to measure the distance between two points on a chart and much more.
List of measured values:
Distance in points Profit (with and without spread) Time difference Percentage price change Slope angle Number of bars (various variations) Ratio of distance in points to the reference value Features:
Snap to OHLC prices Automatic color profile setting based on chart background color Various types of pointers to choose from Display of values of selected points on th
FREE

DCA Gold EA Are you ready to take your gold trading to the next level? Look no further than the DCA GOLD EA, your trusted partner for seamless and profitable gold trading in the world's most exciting markets. Unlock the Power of Dollar-Cost Averaging Dollar-Cost Averaging (DCA) is a proven investment strategy, and now you can apply it to the dazzling world of gold trading. With DCA GOLD EA, you can effortlessly invest a fixed amount of money at regular intervals, regardless of gold's current
FREE
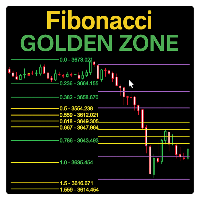
Fibonacci Sessions 指标是一款强大的交易工具,专为精准剥头皮和日内策略而设计。它会自动绘制纽约、伦敦和亚洲交易时段的关键斐波那契水平,为交易者提供主要市场时段的价格动态清晰视图。每个交易时段都会突出显示独特的“黄金区域”,这是价格最常反应的地方。这为反转、突破和趋势延续交易创造了高度可靠的区域。该指标直观展示了价格如何经常从一个黄金区域移动到另一个黄金区域,帮助交易者捕捉持续性的机会。该指标针对 XAUUSD 的 M5 时间框架进行了优化,同时在其他外汇货币对和全球指数上也表现出色。无论您交易的是黄金、外汇还是指数,这个基于交易时段的斐波那契指标都会为您提供额外优势,帮助识别高概率交易区域。主要功能:自动绘制亚洲、伦敦和纽约时段斐波那契水平;清晰显示每个时段的黄金区域;识别价格从一个黄金区域到另一个黄金区域的重复走势;优化用于 XAUUSD M5 时间框架;适用于外汇和全球指数;适合剥头皮交易者和日内交易者。 红线:极限盈利目标位 黄线:黄金区域(高概率反应区) 其他彩色线条:基于交易时段的斐波那契水平
FREE

ControlPoints 指标
用途: 识别控制点(CP)—— 图表上的局部极值(分形)。上控制点为局部高点(按 high),下控制点为局部低点(按 low)。在图表上以菱形标记显示。 No-Repaint: 指标不重绘。位于第 i 根K线的 CP 仅当窗口 [i − 左侧K线数, i + 右侧K线数] 内的所有K线都收盘后才被确认。正在形成的(当前)K线永远不参与评估。确认后其值不再重新计算。 CP 判定逻辑 上 CP: 在范围 [i − 左侧K线数 .. i + 右侧K线数](其中 j ≠ i)内,high[i] 严格大于所有 high[j]。 下 CP: 在同一范围内(其中 j ≠ i),low[i] 严格小于所有 low[j]。 同一根K线可以同时是上 CP 和下 CP。 参数 参数 类型 默认 说明 1 左侧K线数 int 2 候选K线左侧需有多少根已收盘K线的 high 更低(上 CP)或 low 更高(下 CP)。最小为 1。 2 右侧K线数 int 2 候选K线右侧需有多少根已收盘K线确认该极值。它决定 CP 出现的延迟:第 i 根K线上的点只有
FREE
这是免费产品,欢迎您使用以满足您的需求!
如果您喜欢这个指标,请留下简短的好评!非常感谢!
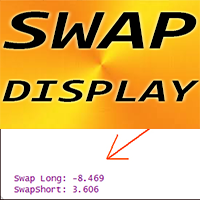
点击这里查看高质量的交易机器人和指标! .................................................................................... MT4 外汇指标 SWAP 显示,出色的辅助交易工具。 Click here to MT5 version! .................................................................................... - SWAP 显示指标显示其所连接的外汇对的多头和空头交易的当前 SWAP。 - 可以在图表的任何角落找到 SWAP 显示值. - 也可以设置颜色和字体大小。 - 每个交易者在保持交易超过 1 天时都应该知道 SWAP。 这是仅在此 MQL5 网站上提供的原创产品。
FREE
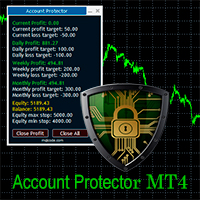
The Expert Advisor is designed to protect the account, fix profit (loss) and display current information about the account. Trading account protection is carried out by closing all open orders in the terminal and/or closing all charts. When running the Expert Advisor with default parameters, it will only display your account information and will be reduced in size. Next, you can set the conditions under which your trading account will be protected. Profit and loss limits can be set for daily pro
FREE

Fer Goldhunter is a sophisticated MetaTrader 4 Expert Advisor designed to capture market trends while offering robust recovery mechanisms. It merges a triple EMA trend-following strategy with an optional smart Grid system, fully protected by daily risk limits.
Key Features: Trend Following Core: Uses a Triple EMA System (Fast, Slow, Slowest) to identify strong market direction, ensuring trades are aligned with the dominant trend . ADX Advanced Filtering: Avoids flat markets using a b
FREE

Kumo Forge Pro 是一款适用于 MetaTrader 4 的非重绘自适应一目均衡表交易系统。它远超标准一目均衡表指标,新增了自适应波动率引擎(可根据实时市场状况自动缩放转换线、基准线和先行跨度 B 的周期)、0–110 分的 9 因子共振评分引擎、五种独立信号类型(TK 交叉、基准线反弹、云层边缘反弹、迟行线突破和云层突破)、动量脉冲引擎、具有三种止损模式和三个止盈级别的智能 TP/SL 系统,以及包含多时间周期对齐面板的 22–28 行综合大盘。每个信号仅在确认的 K 线收盘时触发,不会重绘。 查看 MT5 版本: Kumo Forge Pro MT5 查看更多产品: 全部产 品 欢迎访问我的主页查看实时示例和新工具,并发送好友申请,第一时间获取更新!
工作原理 自适应一目均衡表引擎 核心引擎通过可配置的回望窗口(默认:50 根 K 线)测量 ATR(14) 相对于其最高值和最低值,生成 0.0 至 1.0 的波动率比率。每个一目均衡表周期——转换线(9)、基准线(26)和先行跨度 B(52)——根据该比率和自适应强度参数(默认:0.4,即周期可拉伸 ±40%)进
FREE

显示当前主要市场交易时段和开始下一个交易时段的剩余时间。
市场
纽约 伦敦 法兰克福 东京 西德尼 另外 1 个会议 自定义名称、开始和结束时间
时钟时间
格林威治标准时间/世界标准时间 本地(来自计算机) 经纪人(服务器时间) 设置上的默认时间是格林威治标准时间。 更改为本地时间或经纪人时间后,需要根据选择的时间类型手动调整每个会话的打开和关闭时间。 每个市场开 和 收市 时间可以调整
图形设置 每个会话都可以单独显示或隐藏。 这将包括: 会话名称,在打开的栏上 开盘价格线,将在交易结束前绘制 背景颜色 会话背景颜色有 2 种模式
第一条,用作分隔符 完整的会议期间,从开始到结束
* 会话颜色会在重叠时混合。 这将在图表上创建一种新的特定颜色,希望有助于轻松发现历史数据上的重叠 * 在图表上绘制太多会话可能会造成混淆 * 图表上之前可见的时段可以按天数进行限制。 增加天数将增加在图表上启动指标的时间,具体取决于使用的时间范围 * 自动对比度校正功能将在设置为开时尝试调整与图表背景颜色相关的颜色
FREE

EZ Risk Reward Ratio is a simple to use MT4 indicator that allows the user to automatically change the Risk Reward Ratio of an open trade simply by dragging the Take Profit or Stop Loss lines to desired positions on any chart. Risk to reward ratio is displayed in whichever corner you choose and can be changed by dragging TP and SL lines.
First, place the EZ Risk Reward Ratio indicator on the MT4 chart. Second, open a trade on the MT4 chart. EZ Risk Reward Ratio works on any currency pair and o
FREE
M1Arrows is a MT4 trend arrows Indicator
* Smart Scalper Setup (M1) :: Signal 5 Main 20 + Signal 20 Main 80 + Fibonacci ZigArcs 20
(Screenshot1) Add the indicator with first setting,
then add it again to the same graph with other settings.
You can add as many as you want, but 2 M1Arrows in just one graph is enought
Never open orders againt the slow setting trend
Do not open more than 3 orders per slow setting trend
It will work better in Europe/USA markets, * M15 Day Trade Setup: Signal 20 ma
FREE
Time your Entry and Exits with Average True Range (ATR) Trailing Stops ATR Trailing Stops are primarily used to protect capital and lock in profits on individual trades but they can also be used, in conjunction with a trend filter, to signal entries. The indicator will help make your calculation of stop loss easier as it will be visually aiding you in choosing where to put your stoploss level on the chart by calculating the current value of ATR indicator. For those who are unfamiliar with ATR, i
FREE

时区时钟是一个小巧的 MT4 指标,看它一眼就能回答一个问题:经纪商时间转换成我的本地时间是多少? 它在图表上是这样的 LOCAL 23:58:43 | SERV 15:58:43 | 10-02 SERV 是终端服务器时间, LOCAL 是你自己的时钟,末尾的 MM-DD 是服务器日期。当你准备用本地时间去描述交易或者选择一段时间进行交易时,这个小工具很有用。 功能 本地时间 服务器时间 服务器日期 时间精确到秒 文本颜色和字体大小都是可以根据自己的喜好进行调节的 显示的时钟可以用鼠标左键抓取并移动到任何地方 参数
LocalOffsetHours - 要加到服务器时间上以得到本地时间的小时数
ShowSeconds - true 显示 hh:mm:ss,false 显示 hh:mm
ShowDate - 在末尾附加服务器日期,格式为 MM-DD
TextColor - 文本颜色(clrWhite)
FontSize - 字体大小,单位为磅(11)
ScreenCorner - 0 左上,1 右上,2 左下,3 右下
X_Distance - 距角落的水平偏移,单位
FREE
MetaTrader 市场 - 在您的交易程序端可以直接使用为交易者提供的自动交易和技术指标。
MQL5.community 支付系统 提供给MQL5.com 网站所有已注册用户用于MetaTrade服务方面的事务。您可以使用WebMoney,PayPal 或银行卡进行存取款。
