
Color Day - MetaTrader 5脚本

- 显示:
- 1580
- 等级:
- 已发布:
-
 需要基于此代码的EA交易或指标吗?请在自由职业者服务中订购
进入自由职业者服务
需要基于此代码的EA交易或指标吗?请在自由职业者服务中订购
进入自由职业者服务
Color Day 指标使用不同颜色绘制出牛市和熊市的交易日。
如果每日收盘价高于开盘价,颜色就是蓝色的(可以在设置中自定义)。
input color UP = Blue; // 牛市交易日的颜色
如果每日收盘价低于开盘价,颜色就是红色的(可以在设置中自定义)。
input color DN = Red; // 熊市交易日的颜色
把指定天数的开盘价,收盘价和开盘时间:
CopyTime(NULL,PERIOD_D1,0,Days+1,tm);
      CopyOpen(NULL,PERIOD_D1,0,Days+1,op);
      CopyClose(NULL,PERIOD_D1,0,Days+1,cl);
复制到对应的数组中:
datetime tm[];
double op[];
double cl[];
在图表上安装指标之前,设置数组的维度:
int OnInit()
  {
//--- 指标缓冲区的映射
   Comment("");
   ArrayResize(tm,Days);
   ArrayResize(op,Days);
   ArrayResize(cl,Days);
//---
   return(INIT_SUCCEEDED);
  }
把数组单元的数值赋给变量并确定每日收盘时间 time1:
datetime time0=tm[i];
      datetime time1=time0+3600*24;
      double dopen=op[i];
      double dclose=cl[i];
使用 PutRect() 函数:
void PutRect(string name,datetime t1,double p1,datetime t2,double p2,color clr)
  {
   ObjectDelete(0,name);
//--- 使用提供的坐标创建长方形
   ObjectCreate(0,name,OBJ_RECTANGLE,0,t1,p1,t2,p2);
//--- 设置长方形的颜色
   ObjectSetInteger(0,name,OBJPROP_COLOR,clr);
//--- 启用 (true) 或者禁用 (false) 长方形的填充模式
   ObjectSetInteger(0,name,OBJPROP_FILL,true);
  }
日期的颜色依赖于价格变化的方向:
if(dclose<dopen) PutRect("Rect"+(string)dopen,time0,dopen,time1,dclose,DN);
      if(dclose>dopen) PutRect("Rect"+(string)dopen,time0,dopen,time1,dclose,UP);
循环迭代在 Days 参数中指定的天数:
for(int i=0;i<=Days;i++)
     {
      CopyTime(NULL,PERIOD_D1,0,Days+1,tm);
      CopyOpen(NULL,PERIOD_D1,0,Days+1,op);
      CopyClose(NULL,PERIOD_D1,0,Days+1,cl);

      datetime time0=tm[i];
      datetime time1=time0+3600*24;
      double dopen=op[i];
      double dclose=cl[i];

      if(dclose<dopen) PutRect("Rect"+(string)dopen,time0,dopen,time1,dclose,DN);
      if(dclose>dopen) PutRect("Rect"+(string)dopen,time0,dopen,time1,dclose,UP);
当从图表上删除指标时,使用 DeleteObjects() 函数:
void DeleteObjects()
  {
   for(int i=ObjectsTotal(0,0,OBJ_RECTANGLE)-1;i>=0;i--)
     {
      string name=ObjectName(0,i,0,OBJ_RECTANGLE);
      if(StringFind(name,"Rect",0)>=0) ObjectDelete(0,name);
     }
  }
删除图表上创建的对象:
void OnDeinit(const int reason)
  {
   Comment("");
   DeleteObjects();
  }
设置:
input int   Days = 11;  // 用于计算的天数
input color UP = Blue;  // 牛市交易日的颜色
input color DN = Red;   // 熊市交易日的颜色
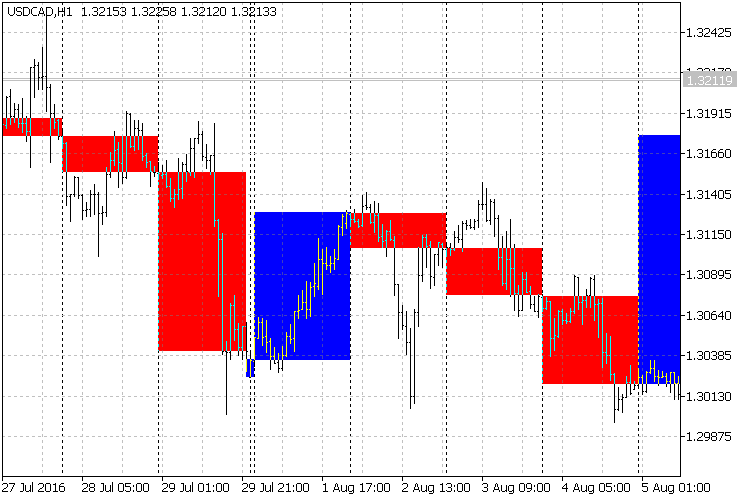
图 1. 图表上的指标
提示:
- Color Day 指标 — 可视化交易助手。
由MetaQuotes Ltd译自俄语
原代码: https://www.mql5.com/ru/code/16383
ColorJSatl_Digit
平滑过的快速数字过滤器 JSatl,并且有颜色来指示移动方向,以价格标签的形式显示了最近的数值,可以近似到所需的小数点位数。
 Exp_JSatl_Digit_System
基于 JSatl_Digit_System 指标信号的交易系统。