
开发先进的 ICT 交易系统:在指标中实现订单区块

1.0:概述
欢迎并感谢您阅读本文。今天,您将学习如何基于聪明钱概念和内圈交易者(ICT)的订单区块理论开发指标。
1.1:订单区块创建基础知识
订单区块是图表上可能等待成交的挂单的区域。
这通常发生在大型市场参与者(如金融机构)想要进入重要头寸,但缺乏足够的流动性来一次执行整个订单而不影响市场时。根据供需的基本规律,执行部分订单会推高价格(在买入的情况下),积极寻找能够提供完成交易所需流动性的卖家。
由于机构参与者无法在不引起重大价格变动的情况下一次性执行全部订单,因此他们将订单分成更小的部分。这使他们能够在完全进入头寸之前完成交易,而价格不会大幅波动。
根据这一概念,我们可以将价格图上的这些区域识别为供需严重失衡的区域(无论是买入还是卖出)。下面,我们将探索三种识别这些区域的方法以及如何在代码中实现它们。
1.1.1:基于价格行为的逻辑(基础级别)
在深入研究订单区块背后的逻辑之前,让我们先简单回顾一下烛形的组成部分,这对于理解其机制至关重要。
一根蜡烛图由四个价格点组成:
| 价格 | 描述 |
|---|---|
| High | 蜡烛图时间框架内达到的最高价格 |
| Low | 蜡烛图时间框架内达到的最低价格 |
| Open | 蜡烛图开盘价 |
| Close | 蜡烛图收盘价 |
让我们看看图表上的一个例子,以便更好地理解这一点:

首先,根据订单区块理论,第一个重要因素是识别市场不平衡。这种不平衡在图表上通常表现为同一方向上的多个连续烛形序列,表明了一种明显的趋势。
例子:连续 4 根烛形呈上升趋势
在这种情况下,我们将关注由四个连续看涨蜡烛形成的上升趋势,遵循以下规则:
| 烛形 | 描述 |
|---|---|
| 前一根烛形 | 该烛形在 4 根连续上涨烛形之前。它通常收于上涨活动起始水平以下。 |
| 第一根烛形 | 标志着向上运动的开始。其收盘价高于前一根烛形的开盘价。 |
| 第二、第三和第四根烛形 | 这些蜡烛延续了上涨势头,每根蜡烛的收盘形都高于前一根烛形的收盘价。 |
- 向上运动条件:要成为有效的走势,四根烛形必须连续看涨。第一根烛形开始呈现不平衡状态,随后的烛形也证实了这一点。
- 订单区块标识:订单区块位于包含前一根烛形和第一根看涨烛形的区域内,代表买家控制的区域。
下面,我们可以看到一个图形示例,其中显示了四根连续的看涨烛形,清楚地表明了价格不平衡。

根据连续烛形识别订单区块的规则:
| 方面 | 看涨订单区块 | 看跌订单区块 |
|---|---|---|
| 烛形条件 | 烛形 1、2、3 和 4 必须全部为看涨。每个收盘价都高于其开盘价。 | 烛形 1、2、3 和 4 必须全部为看跌。每个收盘价均低于其开盘价。 |
| 烛形 2 的极值验证 | 烛形 2 的最低价必须高于烛形 1 主体的中点。 (例外:锤子) | 烛形 2 的最高点必须低于烛形 1 主体的中点。 (例外:锤子) |
| 烛形 2 主体条件 | 烛形 2 的主体部分至少应超过烛形 1 的最高点 40%。 | 烛形 2 的主体部分至少有 40% 必须低于烛形 1 的最低价。 |
| 烛形 3 的极值验证 | 烛形 3 的最低价必须高于烛形 2 主体的 25%。 | 烛形 3 的最高点必须低于烛形 2 主体的 25%。 |
| 烛形 3 主体条件 | 烛形 3 的主体部分的一半必须超过烛形 2 的最高价。 | 烛形 3 的主体部分有一半必须低于烛形 2 的最低价。 |
规则的目的:
这些标准旨在确保 4 根烛形的模式足够强大,可以验证订单区块并确认区域内的挂单尚未填写。
1.1.2:基于价格行为的逻辑和指标(中级)
在这种更进阶的方法中,我们不仅依赖于价格行为,还应用指标来验证走势的强度,特别是交易量指标。
策略原则
如前所述,重大的市场波动往往始于相对较低的交易量,一旦执行了主要订单,交易量就会急剧增加。成交量激增通常跨越 2 或 3 个烛形,标志着订单区块的形成。
我们可以将这个逻辑分解为两个主要场景:
案例 1:交易量增加的订单区块
在这种情况下,当交易量开始大幅上升时,订单区块就会形成。条件如下:
- 运动开始:它以一根低成交量的烛形开始,标志着积累的开始。
- 交易量增加:在下一个烛形上,成交量大幅增加,表明订单已执行。这种增长可能会持续 2 至 3 个连续的烛形。
- 订单区块确认:订单区块位于交易量开始增加且挂单被认为已经完成的区域内。
看涨示例:

看跌示例:

案例 2:订单区块出现单笔交易量激增
在这种情况下,当在关键烛形(即第一根烛形)中观察到明显的成交量峰值时,即可识别订单区块。订单区块模式通过价格行为和交易量分析进行验证,由 3 个连续的烛形组成 - 看涨或看跌。
规则:
| 方面 | 看涨订单区块 | 看涨订单区块 |
|---|---|---|
| 烛形 1 上的成交量飙升 | 烛形 1 的成交量必须是三者中最大的,并且其成交量必须超过前一个烛形和烛形 2。 | 烛形 1 的成交量必须是三者中最大的,并且其成交量必须超过前一个烛形和烛形 2。 |
| 检查烛形 2 的极值 | 烛形 2 的最低价必须高于烛形 1 主体的中点,表明订单区块累积区域保持未受影响。 (例外:如果烛形 1 是锤子) | 烛形 2 的最高点必须低于烛形 1主体的中点,表明订单区块累积区域保持未触及。 (例外:如果烛形 1 是倒锤形) |
| 烛形 2 主体 60% 条件 | 烛形 2 的主体的 60% 必须延伸到烛形 1 的最高点之上,表明看涨势头的延续。 | 烛形 2 的主体的 60% 必须低于烛形 1 的最低价,表明看跌势头的延续。 |
| 检查烛形 3 的极值 | 烛形 3 的最高价必须高于烛形 2 的开盘价,以确认持续的看跌势头。 | 烛形 3 的最低价必须低于烛形 2 的开盘价,以确认持续的看涨势头。 |
看涨示例:

看跌示例:

2.0:开发订单区块指标
2.1:配置输入和指标参数
最后,在介绍了大量的理论之后,我们将进入你们很多人可能一直在等待的部分 —— 将我们迄今为止学到的所有内容进行编码。
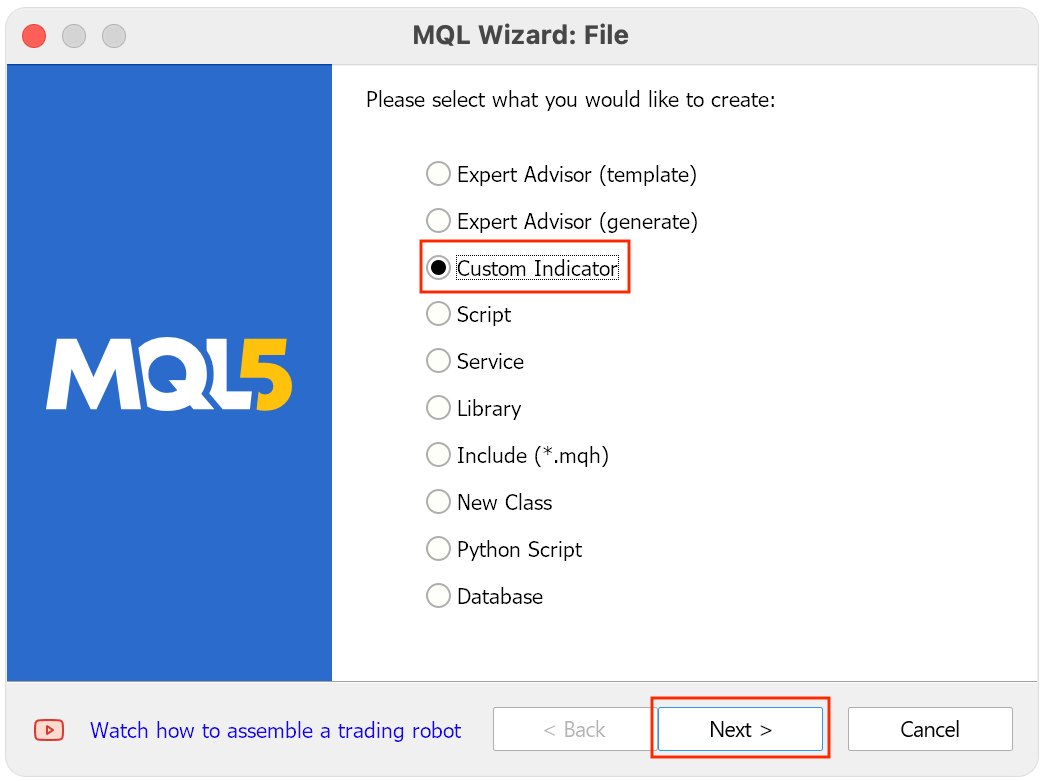
1.我们首先创建一个“自定义指标”类型的新程序:
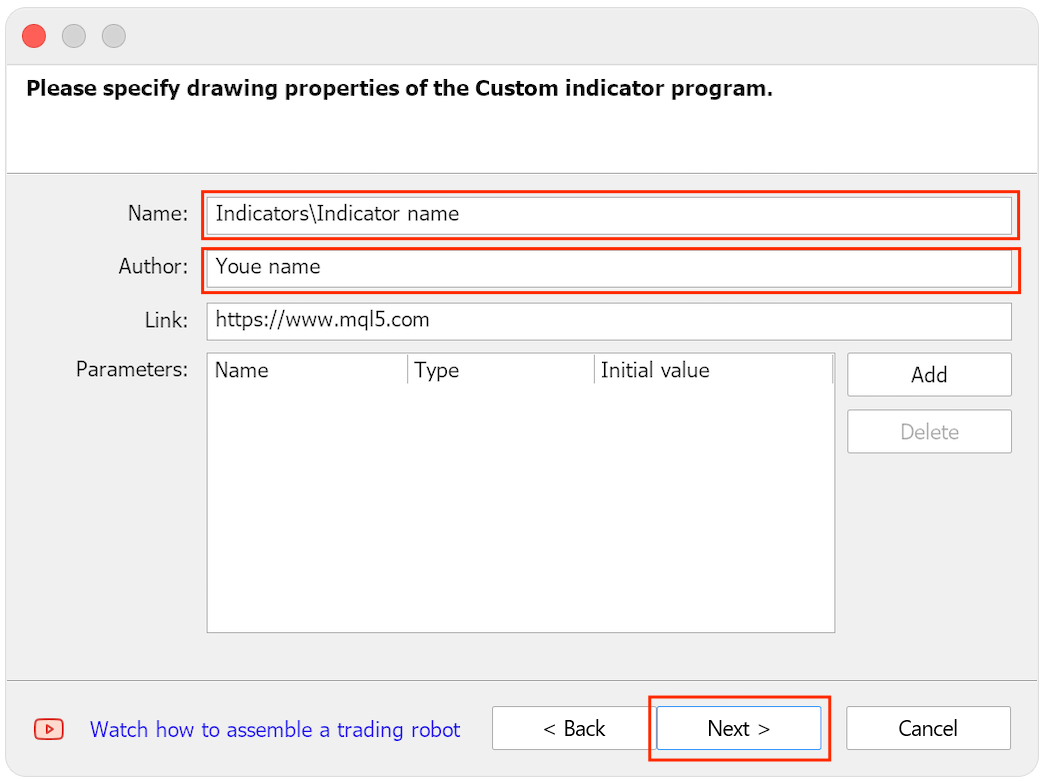
2.接下来我们写下指标的名称和作者的名字。
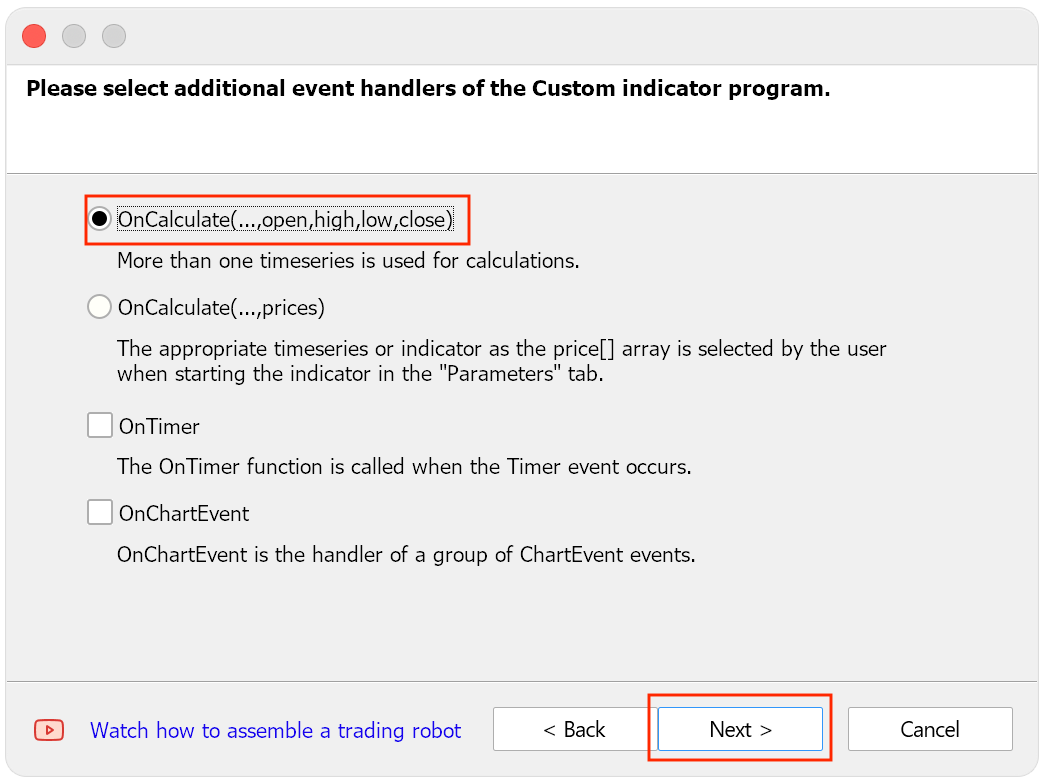
3.然后我们选择 “OnCalculate()” 进行后续计算。
4.按“完成”即可完成。
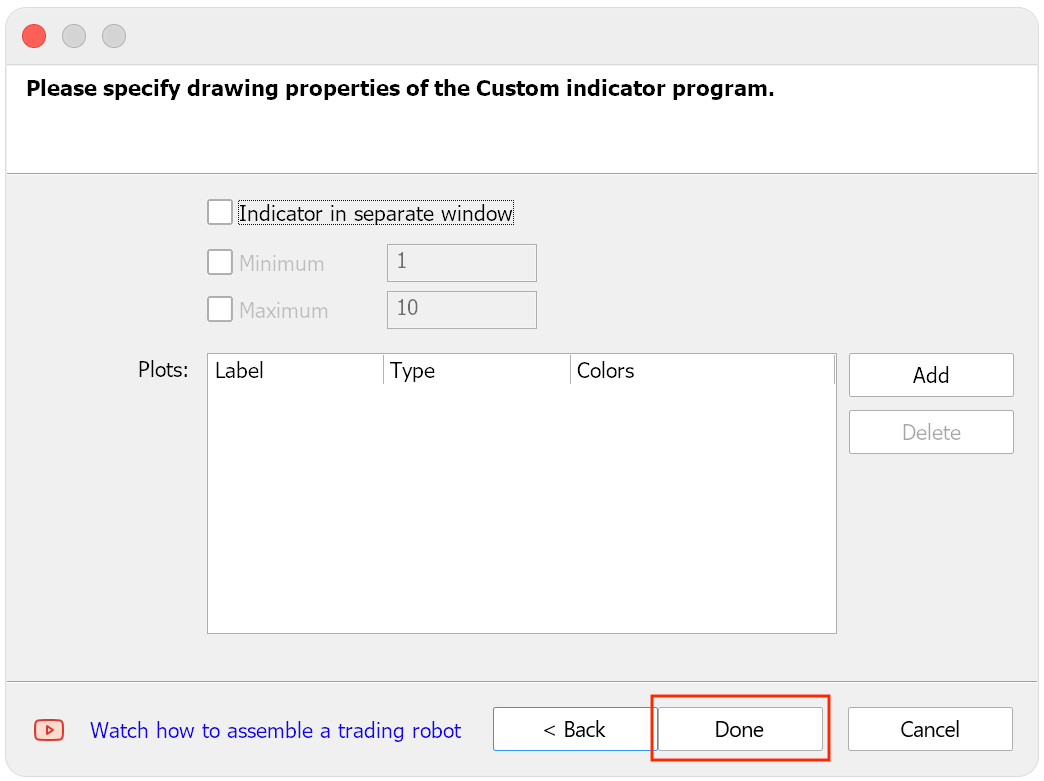
在这个阶段,我们还没有定义任何绘图。
indicator_buffers
indicator_plots
为了避免错误:“没有为 indicator00 定义指标图”
我们在顶部添加以下占位符代码:
#property  indicator_buffers 1
#property  indicator_plots 1
这将消除警告,允许我们继续进行配置和逻辑实现。
让我们首先配置输入参数:
Colors for bullish and bearish order blocks:
这些设置允许用户选择直观地表示看涨和看跌订单区块的颜色,从而更容易一目了然地区分它们。
Rectangle customization options:
这些选项控制用于标记订单块的矩形的显示方式:
- Border width:设置矩形边框的厚度。
- On the background:定义矩形是出现在烛形后面还是前面。
- Selectable:允许用户启用或禁用单击和移动图表上的矩形的功能。
Order Block search range:
此参数定义指标将从当前烛台往回搜索多少个柱形来查找有效的订单区块。调整此项可使指标适应不同的策略或时间框架。
通过分组来组织输入参数:
输入是可调整的参数,用户可以在程序外部修改。为了增强可读性和组织性,我们使用以下概念:
sinput 使用上述关键字可以让我们更好地组织参数,通过使用属性将参数分组为类别:
group
这不仅改善了代码的结构,而且还使用户更容易识别与指标的特定方面相关的不同参数集,例如设置矩形或分析订单区块。
sinput group "--- Order Block Indicator settings ---"
input          int  Rango_universal_busqueda = 500; // Universal range for searching order blocks
input          int  Witdth_order_block = 1;         // Width of the order block lines

input          bool Back_order_block = true; // Enable object to be drawn in the background
input          bool Fill_order_block = true; // Enable fill for the order block rectangle

input          color Color_Order_Block_Bajista = clrRed;   // Assign red color for bearish order block
input          color Color_Order_Block_Alcista = clrGreen; // Assign green color for bullish order block
2.2:创建关键结构和函数
在本节中,我们将定义指标中管理订单区块的主要结构和函数。这将使我们能够存储和组织每个订单区块的关键信息,并使用动态数组有效地管理数据。
1.用于存储最后一根烛形时间的变量
首先,我们将创建一个变量来存储处理的最后一根烛形的时间。这对于避免同一烛形上的订单区块重复以及确保随时间推移的正确跟踪是必要的。
datetime tiempo_ultima_vela;
2.ATR 指标的处理程序:
第二步是创建指标处理程序:
ATR (Average True Range)
这将帮助我们衡量市场波动并补充指标的逻辑。该处理程序在最开始就被初始化,以便可以用于订单区块的计算。
int atr_i;
3.创建用于存储订单区块数据的结构
现在我们将创建一个结构来存储每个订单区块的相关数据。这个结构非常重要,因为它包含有关时间、价格、区块名称以及是否得到缓解的信息。此外,我们将创建一个动态数组来存储所有检测到的订单区块。
struct OrderBlock
{
   datetime time1;      // Time of the candle prior to the first candle of the order block
   double price1;       // Upper price level of the order block (level 1)
   double price2;       // Lower price level of the order block (level 2)
   string name;         // Name of the order block
   bool mitigated;      // Status of the order block (true if mitigated, false if not)
};
结构字段描述
OrderBlock 结构由以下字段组成:
-
time1:此字段存储订单区块的第一个烛形之前的烛形时间。了解区块何时形成并比较时间是很有用的。
-
price1:表示订单区块的最高价或第一个关键价格。如果出现看涨订单区块,这将是最高价格。
-
price2:表示订单区块的最低价格或第二关键价格。这是出现看涨订单区块时的最低价格。
-
name:将存储一个唯一的名称,用于识别图表上的订单区块。该名称将用于清楚地标记该块并使其在视觉上可识别。
-
mitigated:指示订单区块是否已被缓解。如果订单区块被缓解(即价格触及或超过区块水平),则该值为 true,否则为 false。
4.动态数组来存储订单区块
最后,我们将创建一个包含所有已识别的订单区块的动态数组。这些数组将允许我们在内存中存储多个区块并动态管理它们,并根据需要随时间打开或关闭订单块。
OrderBlocks ob_bajistas[];
OrderBlocks ob_alcistas[];
OnInit() 函数:
OnInit() 函数负责初始化指标的所有元素,并执行检查以确保指标开始工作之前一切正常。下面我们将一步一步解释代码中发生的事情。
1.初始化变量
一开始,设置变量的初始值:
"tiempo_ultima_vela" 即 0。这个变量很重要,因为它将存储最后处理的烛形的时间,这将避免重复并正确管理指标流。
tiempo_ultima_vela = 0; 然后启动指标处理程序:
"ATR" (Average True Range) ATR 周期为 14 个烛形。然后, ATR 将用于衡量市场波动性,并有助于订单区块的逻辑。
atr_i = iATR(_Symbol, PERIOD_CURRENT, 14);
2.检查输入参数
初始化后,代码检查变量的值是否已改变:
Rango_universal_busqueda
不到 40。此变量定义指标搜索订单区块的范围。如果这个范围太小,可能会影响指标的准确性和有效性,因此会显示警告消息并且指标停止,返回 INIT_PARAMETERS_INCORRECT 值。
if (Rango_universal_busqueda < 40)
{
   Print("Search range too small");
   return (INIT_PARAMETERS_INCORRECT);
}
此检查允许您确保搜索范围的大小适合指标正常工作,并避免可能影响其操作的不正确设置。
3.检查 ATR 指标的初始化
下一步是检查 ATR 指标处理程序的初始化是否正确。
如果:
"atr_i" 这意味着 :
INVALID_HANDLE 这意味着尝试创建指标时发生了错误,因此显示并返回错误消息:
INIT_FAILED 这将会终止该指标。
if (atr_i == INVALID_HANDLE)
{
   Print("Error copying data for indicators");
   return (INIT_FAILED);
}
4.动态数组的大小调整
存储看跌和看涨订单区块的动态数组会根据需要调整大小,而其初始大小设置为 0。这确保了程序启动时两个数组都是空的,可以存储新的订单区块。
ArrayResize(ob_bajistas, 0);
ArrayResize(ob_alcistas, 0);
使用动态数组对于控制检测到的订单区块的数量非常重要,因为它允许这些数组根据需要增大或缩小。
初始化成功完成
如果所有检查和初始化均完成且没有错误,则函数:
OnInit() 返回:
INIT_SUCCEEDED 这意味着指标已正确初始化并准备开始在图表上运行。
return (INIT_SUCCEEDED);
完整代码:
int OnInit()
  {
//--- indicator buffers mapping
   tiempo_ultima_vela = 0;
   atr_i = iATR(_Symbol,PERIOD_CURRENT,14);

   if(Rango_universal_busqueda < 40)
     {
      Print("Search range too small");
      return (INIT_PARAMETERS_INCORRECT);
     }

   if(atr_i== INVALID_HANDLE)
     {
      Print("Error copying data of indicators");
      return(INIT_FAILED);
     }

   ArrayResize(ob_bajistas,0);
   ArrayResize(ob_alcistas,0);


//---
   return(INIT_SUCCEEDED);
  }
现在我们将代码添加到指标的去初始化事件中以释放内存:
void OnDeinit(const int reason)
  {
//---
  Eliminar_Objetos();

  ArrayFree(ob_bajistas);
  ArrayFree(ob_alcistas);

  }
Eliminar_Objetos();
这将是我们稍后用来删除我们创建的任何矩形的函数。
检查新烛形的外观
此代码的目的是通过确保指标仅在新烛形打开时执行而不是每次价格变化时执行来优化指标。每次价格变化时运行指标会浪费计算机资源,特别是当我们分析多种资产或使用多个指标时。
为此,需要检查最后处理的烛形的时间。如果检测到新的烛形,则指标处理被激活。下面是代码各个部分的描述。
1.初始化
我们有一个布尔变量:
"new_vela" 它起到了触发器的作用。默认值为 false,表示没有开设新的烛形。
bool new_vela = false; // We assign the trigger that tells us whether a new candle has opened to false
2.检查新烛形的出现
下一步是检查最后处理的烛形的时间:
tiempo_ultima_vela
检查它是否与图表上当前烛形的时间不同。函数:
iTime() 返回指定烛形的开启时间,在本例中为最近的烛形(索引为 0)。如果时间不匹配,则意味着出现了新的烛形。
if(tiempo_ultima_vela != iTime(_Symbol, PERIOD_CURRENT, 0)) // Check if the current time is different from the stored time
{
    new_vela = true; // If it doesn't match, set the new candle indicator to true
    tiempo_ultima_vela = iTime(_Symbol, PERIOD_CURRENT, 0); // Update the last processed candle time
}
此代码块执行两项任务:
- 检查是否已形成新的烛形。
- 使用新烛形的时间更新 last_sail_time 变量以供将来使用。
执行主代码
如果变量:
new_vela
是 true,这意味着一根新的烛形已经打开。在这种情况下,我们可以执行处理订单区块的主要指标代码,或任何其他适当的逻辑。通过执行此检查,我们避免在每次价格变动时执行代码,而仅当图表上出现新的烛形时才执行。
if(new_vela == true)
{
   // Here we will place the main code of the indicator that will run only when a new candlestick opens
}
创建数组来存储 K 线图、交易量和 ATR 数据
此块代码包括存储有关烛形、报价交易量和 ATR 的关键信息的数组。这些数据对于价格行为分析和订单区块识别是必要的。
1.声明数组
我们声明 double、datetime 和 long 类型的数组来存储相应的值:
double openArray[];  // Stores Open price of candlesticks
double closeArray[]; // Stores Close price of candlesticks
double highArray[];  // Stores High price of candlesticks
double lowArray[];   // Stores Low price of candlesticks
datetime Time[];     // Stores the time of each candlestick
double atr[];        // Stores ATR values, which indicator market volatility
long Volumen[];      // Stores tick volume, representing the number of transactions in each candlestick
2.将数组设置为时间序列
我们使用 ArraySetAsSeries() 函数使数组充当时间序列。这意味着索引 0 将代表最新的烛形,从而更容易访问最新的烛形数据:
ArraySetAsSeries(openArray, true);
ArraySetAsSeries(closeArray, true);
ArraySetAsSeries(highArray, true);
ArraySetAsSeries(lowArray, true);
ArraySetAsSeries(Time, true);
ArraySetAsSeries(Volumen, true);
ArraySetAsSeries(atr, true);
3.复制蜡烛图和 ATR 数据
然后我们使用函数 CopyOpen、CopyClose、CopyHigh、CopyLow、CopyTime 和 CopyTickVolume 将烛形和报价量数据复制到所需的数组中。CopyBuffer 也用于获取 ATR 值:
int copiedBars = CopyOpen(_Symbol, PERIOD_CURRENT, 0, (Rango_universal_busqueda * 2), openArray);
if(copiedBars < 0)
{
    Print("Error copying data from Open: ", GetLastError());
}
CopyClose(_Symbol, PERIOD_CURRENT, 0, (Rango_universal_busqueda * 2), closeArray);
CopyHigh(_Symbol, PERIOD_CURRENT, 0, (Rango_universal_busqueda * 2), highArray);
CopyLow(_Symbol, PERIOD_CURRENT, 0, (Rango_universal_busqueda * 2), lowArray);
CopyTime(_Symbol, PERIOD_CURRENT, 0, (Rango_universal_busqueda * 2), Time);
CopyTickVolume(_Symbol, PERIOD_CURRENT, 0, (Rango_universal_busqueda * 2), Volumen);
CopyBuffer(atr_i, 0, 0, (Rango_universal_busqueda * 2), atr);
4.错误处理
当复制数据时,我们检查复制的柱数是否为负数,如果为负数则表示出现错误。在这种情况下,为了帮助调试,使用 GetLastError() 函数显示错误消息。
准备编写订单区块检测逻辑
在实现订单区块检测逻辑之前,我们将进行一些必要的准备:
-
检测先前的看涨烛形:我们将创建一个函数来识别在模式的第一个烛形之前是否有看涨烛形。如果找到,我们将把第一根烛形的值分配给最接近的烛形,以便我们从运动的开始绘制订单区块。
-
绘制矩形:我们实现了一个特殊的函数来绘制矩形,以在图表上直观地表示订单区块。
-
数组管理:我们将开发函数将检测到的订单区块添加到相应的数组中。这包括:
- 检查重复:该函数可让您确保我们尝试添加的订单区块之前未被记录过。因此只会添加新的订单区块。
-
订单区块缓解:我们将创建一个函数来检查订单区块是否已被缓解。
-
订单区块移除:我们将添加一个函数来将订单区块标记为已删除,以保持我们的通知整洁干净。
通过这些函数,我们可以开始将订单区块添加到数组中,并确保只注册新块。从现在开始,由于代码量的原因,我们不会提供逐行解释,而是提供每个相关部分的简要描述。
1.函数
//+------------------------------------------------------------------+
//|     Functions to Manage and Add Values to the Arrays             |
//+------------------------------------------------------------------+
void AddIndexToArray_alcistas(OrderBlocks &newVela_Order_block_alcista)
  {
   if(!IsDuplicateOrderBlock_alcista(newVela_Order_block_alcista))  // Here we check if the structure we are about to add already exists in the array
     {
      int num_orderblocks_alcista = ArraySize(ob_alcistas);  // We assign the variable "num_orderblocks_alcista" the current size of the ob_alcistas array
      ArrayResize(ob_alcistas, num_orderblocks_alcista + 1); // Resize the array by increasing its size by 1 to make space for a new order block
      ob_alcistas[num_orderblocks_alcista] = newVela_Order_block_alcista; // Assign the new order block to the new index (last position) in the array
     }
  }

bool IsDuplicateOrderBlock_alcista(const OrderBlocks &newBlock)
  {
   for(int i = 0; i < ArraySize(ob_alcistas); i++) //Start a loop to go through all positions of the ob_alcistas array
     {
      if(ob_alcistas[i].time1 == newBlock.time1 &&
         ob_alcistas[i].name == newBlock.name
        ) // Check if both time1 and name of the order block already exist in the array
        {
         return true; // If they do, return true (i.e., it is a duplicate)
         break; // Exit the loop
        }
     }
   return false; // If no duplicate is found, return false
  }

// This would be the same logic but for bearish order blocks
void AddIndexToArray_bajistas(OrderBlocks &newVela_Order_block_bajista)
  {
   if(!IsDuplicateOrderBlock_bajista(newVela_Order_block_bajista))
     {
      int num_orderblocks_bajistas = ArraySize(ob_bajistas);
      ArrayResize(ob_bajistas, num_orderblocks_bajistas + 1);
      ob_bajistas[num_orderblocks_bajistas] = newVela_Order_block_bajista;
     }
  }

bool IsDuplicateOrderBlock_bajista(const OrderBlocks &newBlock)
  {
   for(int i = 0; i < ArraySize(ob_bajistas); i++)
     {
      if(ob_bajistas[i].time1 == newBlock.time1 &&
         ob_bajistas[i].name == newBlock.name
        )
        {
         return true; // Duplicate found
         break;
        }
     }
   return false; // No duplicate found
  }
现在我们已经实现了帮助我们检查订单区块是否重复并将其添加到动态数组的函数,现在是时候解释如何在图表上绘制这些订单区块了。
为此,我们将使用两个关键价格点:
-
Price 1:如果出现看涨订单区块,该价格将代表矩形的底部。对于看跌订单区块,这将是上方的平行边。
-
Price 2:在看涨订单区块中,该价格将对应于矩形的上平行边。在看跌订单区块中,这将是矩形的底部。
看涨示例:

看跌示例:

现在让我们继续演示订单区块中的缓解函数。
//+------------------------------------------------------------------+
//|             Functions for Order Blocks                           |
//+------------------------------------------------------------------+
datetime  mitigados_alcsitas(double price, double &openArray[], double &closeArray[], double &highArray[], double &lowArray[], datetime &Time[], datetime start, datetime end)
  {
   int startIndex = iBarShift(_Symbol,PERIOD_CURRENT,start); // Using iBarShift we find the index of the candle by passing the "start" time
   int endIndex = iBarShift(_Symbol, PERIOD_CURRENT, end);   // Using iBarShift we find the index of the candle by passing the "end" time
   NormalizeDouble(price,_Digits); // Normalize the price we will work with

   for(int i = startIndex - 2 ; i >= endIndex + 1 ; i--) // Start a loop from start (time1 of the order block) to end (time[1])
     {
      //terminated by endIndex which will be time[0] + 1 = time[1]  --> We are searching for mitigation from past to present (backward)
      NormalizeDouble(lowArray[i],_Digits);
      NormalizeDouble(openArray[i],_Digits);
      NormalizeDouble(highArray[i],_Digits);
      NormalizeDouble(openArray[i],_Digits);
      //Normalizamos todas laas variable

      if(price > lowArray[i] || price > openArray[i] || price > closeArray[i] || price > highArray[i]) // Check if OHLC closed below price
        {
         return Time[i]; //If mitigation is found, return the time of the candle where it happened
         Print("el orderblock tuvo mitigaciones", TimeToString(end));
        }
     }

   return 0; //If no mitigation was found, return 0
  }

// the same in the bearish case but changing something
// instead of the price closing below the price
datetime  mitigado_bajista(double price, double &openArray[], double &closeArray[], double &highArray[], double &lowArray[], datetime &Time[], datetime start, datetime end)
  {

   int startIndex = iBarShift(_Symbol,PERIOD_CURRENT,start);
   int endIndex = iBarShift(_Symbol, PERIOD_CURRENT, end);
   NormalizeDouble(price,_Digits);
   for(int i = startIndex - 2 ; i >= endIndex + 1 ; i--)
     {
      NormalizeDouble(lowArray[i],_Digits);
      NormalizeDouble(openArray[i],_Digits);
      NormalizeDouble(highArray[i],_Digits);
      NormalizeDouble(openArray[i],_Digits);
      if(highArray[i] > price || closeArray[i] > price || openArray[i] > price || lowArray[i] > price)
        {

         return Time[i]; // returns the time of the candle found
         Print("el orderblock tuvo mitigaciones", TimeToString(end));

        }
     }

   return 0; // not mitigated so far
  }

datetime esOb_mitigado_array_alcista(OrderBlocks &newblock, datetime end)
  {
   int endIndex = iBarShift(_Symbol, PERIOD_CURRENT, end);
   NormalizeDouble(newblock.price2,_Digits);

   for(int i = 0 ; i <  endIndex -2  ; i++)
     {

      double low = NormalizeDouble(iLow(_Symbol,PERIOD_CURRENT,i),_Digits);
      double close = NormalizeDouble(iClose(_Symbol,PERIOD_CURRENT,i),_Digits);
      double open = NormalizeDouble(iOpen(_Symbol,PERIOD_CURRENT,i),_Digits);

      if((newblock.price2 >= low || newblock.price2 >= open) || newblock.price2 >= close)
        {
         newblock.mitigated = true;


         return iTime(_Symbol,PERIOD_CURRENT,i); // returns the time of the found candle
        }
     }

   return 0; // not mitigated so far
  }

datetime esOb_mitigado_array_bajista(OrderBlocks &newblock, datetime end)
  {

   int endIndex = iBarShift(_Symbol, PERIOD_CURRENT, end);
   NormalizeDouble(newblock.price2,_Digits);

   for(int i = 0 ; i<  endIndex -2  ; i++)
     {

      double high = NormalizeDouble(iHigh(_Symbol,PERIOD_CURRENT,i),_Digits);
      double close = NormalizeDouble(iClose(_Symbol,PERIOD_CURRENT,i),_Digits);
      double open = NormalizeDouble(iOpen(_Symbol,PERIOD_CURRENT,i),_Digits);

      if((high >= newblock.price2 || close >= newblock.price2) || open >= newblock.price2)
        {
         newblock.mitigated = true;
         // returns the time of the found candlestick
         return iTime(_Symbol,PERIOD_CURRENT,i);
        }
     }

   return 0; // not mitigated so far
  }
这些函数负责检查订单区块的状态:
-
缓解检查函数:该函数检查订单区块的缓解情况并用于评估添加的结构。
-
缓解激活函数:第二个函数包含“array”关键字,用于激活订单区块的缓解状态。
接下来我们将研究绘制矩形和查找最近的看涨或看跌烛形的函数。
确定最近的看涨或看跌烛形的函数非常重要。其目的是确保在检测订单区块时正确检测相应的烛形,特别是在订单区块在强劲走势开始时形成的情况下。这将避免在运动中间或结束时出现错误检测,从而降低分析的有效性。
看涨示例:

此处即为该函数:
//+------------------------------------------------------------------+
//|  Functions to find the nearest bullish or bearish candle         |
//+------------------------------------------------------------------+
int FindFurthestAlcista(datetime start, int numVelas)
  {
   int startVela = iBarShift(_Symbol, PERIOD_CURRENT, start); // Function to find the furthest bullish candle in a consecutive sequence
// Initialize variables
   int furthestVela = 0;
   int counter_seguidas = 0;

   for(int i = startVela  + 1; i <= startVela + numVelas ; i++)  // Since the candle at "start" is already known to be bullish, we skip it (+1)
     {
      //then it is obvious that the candle at time 1 is bullish (in this function), that's why we increase +1, then we check that i is less than or equal to the index of startVela + num candles
      //here num candles would be the number of candles to search for
      double Close = NormalizeDouble(iClose(_Symbol,PERIOD_CURRENT,i),_Digits); //we get the open by index
      double Open = NormalizeDouble(iOpen(_Symbol,PERIOD_CURRENT,i),_Digits);  //we get the close by index

      if(Close > Open || Close == Open)  // we check if it's a bullish candle (close > open), that is, the close must be greater than the open
        {
         counter_seguidas++; // if this is true, we increase a variable by 1, which we will use later
        }
      else
         if(Open > Close)
           {
            furthestVela = startVela  + 1 + counter_seguidas; //if the found candle is not bullish, it is obviously bearish, therefore we assign the index of the previous candle to the one that started the bullish move
            // startVela: is the candle we passed, then we add 1 because as we said before, we will draw the order block one candle before the bullish move (i.e., bearish candle)
            // to this we add the counter of consecutive candles

            break; // exit the loop
           }
     }

//we check if the body of the candle before the move is more than 30% larger than the candle that starts the move; if it is, we revert to the normal value
   double body1 = NormalizeDouble(iClose(_Symbol,PERIOD_CURRENT,(furthestVela -1)),_Digits) - NormalizeDouble(iOpen(_Symbol,PERIOD_CURRENT,(furthestVela -1)),_Digits);;
   double body_furtles =  NormalizeDouble(iOpen(_Symbol,PERIOD_CURRENT,furthestVela),_Digits) -  NormalizeDouble(iClose(_Symbol,PERIOD_CURRENT,furthestVela),_Digits);

   if(body_furtles > (1.3 * body1))
      furthestVela--;

   return furthestVela; // return the index of the found candle
  }

// Function to search for the furthest bearish candle with consecutive bearish candles
int FindFurthestBajista(datetime start, int numVelas)
  {
   int startVela = iBarShift(_Symbol, PERIOD_CURRENT, start); // Index of the initial candle
   int furthestVela = 0; // Initialize variable
   int counter_seguidas = 0; // Counter of consecutive bearish candles

   for(int i = startVela + 1; i <= startVela + numVelas; i++)
     {
      double Close = NormalizeDouble(iClose(_Symbol, PERIOD_CURRENT, i), _Digits);
      double Open = NormalizeDouble(iOpen(_Symbol, PERIOD_CURRENT, i), _Digits);

      // If the candle is bearish
      if(Close < Open || Close == Open)
        {
         counter_seguidas++; // Increase the counter of consecutive bearish candles
        }
      // If the candle is bullish, we stop
      else
         if(Close > Open)
           {
            // Return the candle where the bearish sequence is interrupted by a bullish one
            furthestVela = startVela + 1 + counter_seguidas;
            break;
           }
     }

   return furthestVela;
  }
现在我们只需要创建一个绘制矩形的函数:
 void RectangleCreate(long chart_ID, string name, const int sub_window, datetime time1, double price1, datetime time2, double price2, color clr, int width, bool fill, bool back , ENUM_LINE_STYLE style , bool select = false)
  {
   ResetLastError(); // reset the error

 // check and create rectangles
   if(!ObjectCreate(chart_ID, name, OBJ_RECTANGLE, sub_window, time1, price1, time2, price2))
     {
      Print(__FUNCTION__, ": Falo al crear el rectangulo ! Error code = ", GetLastError()  , "El nombre del rectangulo es  : " , name); //if creation fails, print the function + error code and rectangle name
     }

  // set the properties of the rectangles
   ObjectSetInteger(chart_ID, name, OBJPROP_COLOR, clr);
   ObjectSetInteger(chart_ID, name, OBJPROP_STYLE, STYLE_SOLID);
   ObjectSetInteger(chart_ID, name, OBJPROP_WIDTH, width);
   ObjectSetInteger(chart_ID, name, OBJPROP_FILL, fill);
   ObjectSetInteger(chart_ID, name, OBJPROP_BACK, back);
   ObjectSetInteger(chart_ID, name, OBJPROP_SELECTABLE, select);
   ObjectSetInteger(chart_ID, name, OBJPROP_SELECTED, select);
   ObjectSetInteger(Chart_ID, name, OBJPROP_STYLE ,style);
  }
一旦所有这些函数准备就绪,我们将进入下一部分。
2.3:订单块检测逻辑
我们为该系统开发的逻辑如下:
- 使用上面描述的逻辑检测订单区块。
- 为结构分配值。
- 向数组添加用于存储订单块的结构。
- 检查订单区块的缓解情况。
- 绘制订单区块。
- 提醒
首先,我们创建结构来存储订单区块值:
- 我们创建 4 个变量,它们将具有 OrderBlocks 结构的形式。
- 2 个用于保存看涨订单区块(指标和价格行动订单区块)。
- 2 个用于保存看跌订单区块(指标和价格行动订单区块)。
OrderBlocks  newVela_Order_block_alcista;
OrderBlocks  newVela_Order_block_volumen;
OrderBlocks newVela_Order_Block_bajista;
OrderBlocks newVela_Order_Block_bajista_2;
添加这些结构后,我们已经有了用于存储订单区块值的变量。
现在我们只需使用逻辑来检测订单区块。那么,我们开始吧。
我们从逻辑开始:
- 我们需要在 K 线范围内搜索订单区块并为其分配索引,这类似于按照我们在逻辑中设置的条件搜索 K 线形态。
- 为此,我们将使用 “for” 循环。
代码如下:
for(int i = Rango_universal_busqueda  ; i  > 5  ; i--)
   {

//checking errors
if(i + 3> ArraySize(highArray)  || i + 3 > ArraySize(atr))
continue;
if(i < 0)
continue;

//--------Variable Declaration--------------------------------------------//

// Update candle indices
int one_vela = i ; // central candlestick
int  vela_atras_two = i +2;
int vela_atras_one = one_vela +1;
int two_vela = one_vela - 1;
int tree_vela = one_vela - 2;
int four_vela = one_vela -3;

NormalizeDouble(highArray[vela_atras_one],_Digits);
NormalizeDouble(lowArray[vela_atras_one ], _Digits);
NormalizeDouble(closeArray[vela_atras_one ],_Digits);
NormalizeDouble(openArray[vela_atras_one ],_Digits);

NormalizeDouble(highArray[two_vela],_Digits);
NormalizeDouble(lowArray[two_vela], _Digits);
NormalizeDouble(closeArray[two_vela],_Digits);
NormalizeDouble(openArray[two_vela],_Digits);

NormalizeDouble(highArray[tree_vela],_Digits);
NormalizeDouble(lowArray[tree_vela], _Digits);
NormalizeDouble(closeArray[tree_vela],_Digits);
NormalizeDouble(openArray[tree_vela],_Digits);

NormalizeDouble(highArray[one_vela],_Digits);
NormalizeDouble(lowArray[one_vela], _Digits);
NormalizeDouble(closeArray[one_vela],_Digits);
NormalizeDouble(openArray[one_vela],_Digits);

// Calculate average body size of previous candles
double body1 = closeArray[one_vela] - openArray[one_vela];
double body2 = closeArray[two_vela] - openArray[two_vela];
double body3 = closeArray[tree_vela] - openArray[two_vela];

// Volume condition
long Volumen_one_vela = Volumen[one_vela];
long Volumen_two_vela = Volumen[two_vela];
long volumen_vela_atras_one = Volumen[vela_atras_one];
- 基本上,在这段代码中,我们创建了一个循环,该循环将从烛形的最大值开始移动,该最大值为:
(Rango_universal_busqueda)
结束于索引 6:
i > 5 如果 i > 5
我们从 i 的值中减去 1。
- 我们对将要使用的蜡烛图的 OHCL 进行了大规模归一化。
- 我们将烛形主体指定为:收盘价 - 开盘价。
- 我们获得了分时报价值,这仅适用于峰值情况:
//Volume
long Volumen_one_vela = Volumen[one_vela];
long Volumen_two_vela = Volumen[two_vela];
long volumen_vela_atras_one = Volumen[vela_atras_one];
现在我们再添加一个标准,那就是 atr,我们主要通过分析它来观察某个方向上的强劲价格走势。
- 在下面显示的代码片段中,您可以看到基本逻辑条件和 atr 指标:
//Boolean variables to detect if the case is met (only Price Action)
bool esVelaCorrecta_case_normal =false;
bool  esVela_Martillo = false;

//Here we check that 4 consecutive bullish candles have formed with close > open
if(
   closeArray[one_vela] > openArray[one_vela] &&
   closeArray[two_vela] > openArray[two_vela] &&
   closeArray[tree_vela] > openArray[tree_vela] &&
   closeArray[four_vela] > openArray[four_vela]
)
  {

   esVelaCorrecta_case_normal =true; // if true, assign true to "esVelaCorrecta_case_normal"
  }
else
   esVelaCorrecta_case_normal =false; // otherwise assign false

bool fuerte_movimiento_alcista =false; // create a variable that activates only if a strong bullish movement occurs

// Check if a movement of 6 consecutive bullish candles was created
if(
   closeArray[one_vela + 2] > openArray[one_vela + 2] &&
   closeArray[one_vela + 1] > openArray[one_vela +1] &&
   closeArray[one_vela] > openArray[one_vela] &&
   closeArray[two_vela] > openArray[two_vela] &&
   closeArray[tree_vela] > openArray[tree_vela] &&
   closeArray[four_vela] > openArray[four_vela]
)
  {
   fuerte_movimiento_alcista = true; // if true assign true to "fuerte_movimiento_alcista"
  }

//verificamos si es vela martillo
if(openArray[one_vela] - lowArray[one_vela] > closeArray[one_vela] - openArray[one_vela]) // check if lower wick is larger than the candle body
  {
   esVela_Martillo = true; // if so set "esVela_Martillo" to true
  }

bool atr_case = false;

if(atr[vela_atras_two] > atr[one_vela] && atr[two_vela] > atr[one_vela] && atr[two_vela] > atr[vela_atras_two] && closeArray[one_vela] > openArray[one_vela]
   && closeArray[four_vela] > openArray[four_vela] && closeArray[tree_vela] > openArray[tree_vela])
   atr_case = true;  // in this code we look for ATR to first fall in one candle
//then rise, and candles 1, 3, 4 must be bullish; second candle not necessary for this case

//Verification for normal case
if((esVelaCorrecta_case_normal == true && ((lowArray[two_vela] > ((body1 *0.5)+openArray[one_vela]) && ((body2 * 0.4)+openArray[two_vela]) > highArray[one_vela]) || esVela_Martillo == true)
    && lowArray[tree_vela] > ((body2 * 0.25) +openArray[two_vela])) || fuerte_movimiento_alcista == true || atr_case == true)
  {
   int furthestAlcista = FindFurthestAlcista(Time[one_vela],20); // call function to find previous bullish candles before "one_vela"
   if(furthestAlcista > 0) // whether or not found, will be > 0 since it returns previous candle index if none found
     {

      datetime time1 = Time[furthestAlcista];     //assign time of furthestAlcista candle to time1
      double price2 = openArray[furthestAlcista]; //assign open of furthestAlcista as price2 (usually drawn on a bearish candle)
      double price1 = lowArray[furthestAlcista];  //assign low of furthestAlcista as price1

      //assign mentioned variables to the structure
      newVela_Order_block_alcista.price1 = price1;
      newVela_Order_block_alcista.time1 = time1;
      newVela_Order_block_alcista.price2 = price2;

      case_OrderBlockAlcista_normal = true; //if all true, activate normal bullish case
     }
   else
      case_OrderBlockAlcista_normal =false;

  }
//versión bajista

bool case_OrderBlockBajista_normal = false;
bool case_OrderBlockBajista_volumen = false;

//---------------Conditions for Order Blocks--------------------//
//+------------------------------------------------------------------+
//| Conditions For Bearish Order Block case_normal                   |
//+------------------------------------------------------------------+
if(closeArray[one_vela] < openArray[one_vela]  &&
   closeArray[two_vela] < openArray[two_vela]  &&
   closeArray[tree_vela] < openArray[tree_vela]  &&
   closeArray[one_vela-3]< openArray[one_vela-3]
  )
  {
   esVelaCorrecta_case_normal =true;
  }
else
   esVelaCorrecta_case_normal =false;

bool a = false;

if(atr[vela_atras_two] > atr[one_vela] && atr[two_vela] > atr[one_vela] && atr[two_vela] > atr[vela_atras_two] && esVelaCorrecta_case_normal)
   a= true;

bool fuerte_movimiento_bajista =false;

if(
   closeArray[one_vela + 2] < openArray[one_vela + 2] &&
   closeArray[one_vela + 1] < openArray[one_vela +1] &&
   closeArray[one_vela] < openArray[one_vela] &&
   closeArray[two_vela] < openArray[two_vela] &&
   closeArray[tree_vela] < openArray[tree_vela] &&
   closeArray[one_vela - 3] <= openArray[one_vela - 3]
)
  {
   fuerte_movimiento_bajista = true;
  }

// Verification for normal bearish case
if((esVelaCorrecta_case_normal == true && highArray[two_vela] < ((body1 *0.70)+closeArray[one_vela]) && ((body2 * 0.4)+closeArray[two_vela]) < lowArray[one_vela] && highArray[tree_vela] < highArray[two_vela])
   || a == true || fuerte_movimiento_bajista == true
  )
  {
   int furthestBajista = FindFurthestBajista(Time[one_vela], 20);
   if(furthestBajista != -1)
     {

      datetime time1 = Time[furthestBajista];
      double price1 = closeArray[furthestBajista];
      double price2 = lowArray[furthestBajista];

      newVela_Order_Block_bajista.price1 = price1;
      newVela_Order_Block_bajista.time1 = time1;
      newVela_Order_Block_bajista.price2 = price2 ;

     }
   else
      case_OrderBlockBajista_normal =false;
  }
//+------------------------------------------------------------------+
让我们用适当的注释论来讨论每个函数。因此,我们正在寻找识别某些模式,当我们找到它们时,我们就会激活布尔变量。
接下来,我们检查 one_candle 之前的看涨烛形,即运动开始的烛形。
最后,我们为订单区块分配价格和时间值。
现在我们讨论成交量的情况,我们将研究成交量峰值和成交量上升。
//condition orderblock volume --------------------------------//
if(Volumen_one_vela  > Volumen_two_vela && Volumen_one_vela > volumen_vela_atras_one)
  {
   VolumenCorrecto = true; //here we check the volume peak
  }
else
   VolumenCorrecto = false;

//so that the bullish candle behind is bearish and 2 bullish
if(closeArray[one_vela] > openArray[one_vela]  &&
   closeArray[two_vela] > openArray[two_vela])
  {
   VelaCorrecta_casevolumen = true;
  }

//consecutive case
bool case_vol_2 = false;
if(Volumen[one_vela] > volumen_vela_atras_one && Volumen[two_vela] > Volumen[one_vela] && openArray[tree_vela] < closeArray[tree_vela] && openArray[four_vela] < closeArray[four_vela])
   case_vol_2 = true;

//here we verify that the highlights do not mitigate the order block
if((VolumenCorrecto == true && VelaCorrecta_casevolumen == true
    && ((lowArray[two_vela] > ((body1 * 0.5)+openArray[one_vela]) && ((body2 *0.6)+openArray[two_vela]) > highArray[one_vela]) || esVela_Martillo == true)
    && highArray[tree_vela] > openArray[two_vela]) || case_vol_2 == true)
  {
//I already explained all this above, it is literally the same, we look for the closest bullish trend and assign a value to the one before it
   int furthestAlcista = FindFurthestAlcista(Time[one_vela],20);
   if(furthestAlcista > 0)
     {

      datetime time1 = Time[furthestAlcista];
      double price2 = openArray[furthestAlcista];
      double price1 = lowArray[furthestAlcista];

      newVela_Order_block_volumen.price1 = price1;
      newVela_Order_block_volumen.time1 = time1;
      newVela_Order_block_volumen.price2 = price2;

      case_orderblock_vol= true;
     }
   else
      case_orderblock_vol =false;

  }
//Bearish version
//+------------------------------------------------------------------+

//+------------------------------------------------------------------+
//| Condition for Bullish Order Block Case case_Volumen              |
//+------------------------------------------------------------------+

bool VelaCorrecta_casevolumen = false;
bool VolumenCorrecto;
//condition orderblock volume --------------------------------//
//by peak volume
if(Volumen_one_vela  > Volumen_two_vela && Volumen_one_vela > volumen_vela_atras_one)
  {
   VolumenCorrecto = true;
  }
else
   VolumenCorrecto = false;
//we look here for 2 consecutive bearish candles
if(closeArray[one_vela] < openArray[one_vela]  &&
   closeArray[two_vela] < openArray[two_vela])
  {

   VelaCorrecta_casevolumen = true; //we set the variable "VelaCorrecta_casevolumen" to true
  }
//we look for an increasing volume in addition to the 3rd candle and 4th candle being bearish
bool case_vol_2 = false;
if(Volumen[one_vela] > volumen_vela_atras_one && Volumen[two_vela] > Volumen[one_vela] && openArray[tree_vela] > closeArray[tree_vela] && openArray[four_vela] > closeArray[four_vela])
   case_vol_2 = true;

if((VolumenCorrecto == true && VelaCorrecta_casevolumen == true && highArray[two_vela] < ((body1 * 0.5)+closeArray[one_vela]) && ((body2 *0.5)+closeArray[two_vela]) < lowArray[one_vela]) || case_vol_2 == true)   // verificamos si se cumple
  {
// the peak volume case or increasing volume case
   int furthestBajista = FindFurthestBajista(Time[one_vela],20); //we look for the bearish candle closest to the 1st candle

   if(furthestBajista > 0)
     {
      //if this is true, which as I said before it will always be, we assign the candle values
      //to the structure variables to draw the rectangles
      datetime time1 = Time[furthestBajista];
      double price1 = closeArray[furthestBajista];
      double price2 = lowArray[furthestBajista];

      newVela_Order_Block_bajista_2.price1 = price1;
      newVela_Order_Block_bajista_2.time1 = time1;
      newVela_Order_Block_bajista_2.price2 = price2 ;

      case_OrderBlockBajista_volumen = true;
     }
   else
      case_OrderBlockBajista_volumen = false;
  }
//+------------------------------------------------------------------+
现在我们已经实现了订单区块的检测,我们需要将它们添加到数组中,以便稍后可以在图表上显示它们。
在这段代码中,我们将执行以下操作:
- 我们将变量 “mitigated” 初始化为 false。
- 我们根据订单区块的类型设置其名称,并根据 one_sail 设置时间。
- 最后,我们将订单区块添加到动态数组中。
if(case_OrderBlockAlcista_normal == true
   && mitigados_alcsitas(newVela_Order_block_alcista.price2,openArray,closeArray,highArray,lowArray,Time,newVela_Order_block_alcista.time1,Time[0]) == 0)  //we verify that the order block has not been mitigated
  {
   newVela_Order_block_alcista.mitigated = false; //we activate the order block status as unmitigated = false
   newVela_Order_block_alcista.name =  "Order Block Alcista normal" + TimeToString(newVela_Order_block_alcista.time1) ;  //we assign the name "Normal Bullish Order Block" + the time of one_Vela
   AddIndexToArray_alcistas(newVela_Order_block_alcista); //we add to the array to then check if they are being mitigated and draw them

  }
//the same would be for the volume case
if(case_orderblock_vol == true
   && mitigados_alcsitas(newVela_Order_block_volumen.price2,openArray,closeArray,highArray,lowArray,Time,newVela_Order_block_volumen.time1,Time[0]) == 0)
  {
   newVela_Order_block_volumen.mitigated = false;
   newVela_Order_block_volumen.name =  "Order Block Alcista vol" + TimeToString(newVela_Order_block_volumen.time1) ;
   AddIndexToArray_alcistas(newVela_Order_block_volumen);

  }

  }

//--- Bearish version

if(case_OrderBlockBajista_normal == true  && mitigado_bajista(newVela_Order_Block_bajista.price2,openArray, closeArray, highArray, lowArray, Time, Time[0],newVela_Order_Block_bajista.time1) == 0
  ) //we check if the bearish order block was not mitigated and the normal case is true
  {
   newVela_Order_Block_bajista.mitigated = false; //we initialize the state of the order block as unmitigated = false
   newVela_Order_Block_bajista.name = ("Order Block Bajista ")+ TimeToString(newVela_Order_Block_bajista.time1) ; //we assign the name as "Bearish Block Order" + the time of the 1st candle
   AddIndexToArray_bajistas(newVela_Order_Block_bajista); //we add the structure to the array
  }

if(case_OrderBlockBajista_volumen == true   && mitigado_bajista(newVela_Order_Block_bajista_2.price2, openArray,closeArray,highArray,lowArray,Time,Time[0],newVela_Order_Block_bajista_2.time1)== 0
  )//we check if the bearish order block was not mitigated and the volume case is true
  {
   newVela_Order_Block_bajista_2.mitigated = false; //we initialize the state of the order block as unmitigated = false
   newVela_Order_Block_bajista_2.name = ("Order Block Bajista ") + TimeToString(newVela_Order_Block_bajista_2.time1) ; //we assign the name as "Bearish Block Order" + the time of the 1st candle
   AddIndexToArray_bajistas(newVela_Order_Block_bajista_2); //we add the structure to the array

  }
  }
//+------------------------------------------------------------------+
现在我们可以继续绘制和验证缓解措施。
2.4:可视化:颜色和检查订单区块缓解
在本节中,我们将研究如何更新订单区块、绘制它们并激活它们的缓解状态。
- 我们将通过迭代 “ob_bullish” 和 “ob_bearish” 数组来绘制它们,正如我们已经说过的,它们存储了有关订单块的信息。
- 我们将使用 “ObjectMove” 移动对象,因为我们不想重新绘制所有内容,因为这会降低程序的效率并消耗更多的计算机资源。
现在我们已经完成所有这些,让我们看看我为满足这些要求而准备的代码:
for(int i = 0; i < ArraySize(ob_alcistas); i++) //We iterate through all the indexes of the array where the order blocks information is stored
  {
   datetime mitigadoTime = esOb_mitigado_array_alcista(ob_alcistas[i],ob_alcistas[i].time1); //we call the function that will tell us if index i has been mitigated or not. If it is, we activate its state to true

   if(ob_alcistas[i].mitigated == false)  //we verify that it has not been mitigated
     {
      if(mitigadoTime == 0) //We condition that the order block has not been touched by the price
        {

         if(ObjectFind(ChartID(),ob_alcistas[i].name) < 0) //we check if the object exists in the graph with ObjectFind
           {
            RectangleCreate(ChartID(), ob_alcistas[i].name, 0, ob_alcistas[i].time1, ob_alcistas[i].price1,
                            Time[0], ob_alcistas[i].price2,Color_Order_Block_Alcista, Witdth_order_block, Fill_order_block, Back_order_block,STYLE_SOLID); //  we create the rectangle with the data

           }
         else
            ObjectMove(ChartID(),ob_alcistas[i].name,1,Time[0],ob_alcistas[i].price2);     //on the contrary, if the object exists, the only thing we will do is update it to the current time using anchor point 1
        }
     }
  }

// Draw all order blocks from the orderBlocks array
for(int i = 0; i < ArraySize(ob_bajistas); i++)
  {
   datetime mitigadoTime = esOb_mitigado_array_bajista(ob_bajistas[i],ob_bajistas[i].time1);

   if(ob_bajistas[i].mitigated == false)
     {

      if(mitigadoTime == 0)
        {

         if(ObjectFind(ChartID(),ob_bajistas[i].name) < 0)
           {
            RectangleCreate(ChartID(), ob_bajistas[i].name,0, ob_bajistas[i].time1, ob_bajistas[i].price1,
                            Time[0], ob_bajistas[i].price2,Color_Order_Block_Bajista,Witdth_order_block,Fill_order_block,Back_order_block,STYLE_SOLID);

           }
         else
            ObjectMove(ChartID(),ob_bajistas[i].name,1,Time[0],ob_bajistas[i].price2);

        }
     }

  }
//+------------------------------------------------------------------+
- 订单块检测在 for 循环内执行,并按照以下条件执行:
new_vela == true - 在循环外绘制一个矩形,但也有条件:
new_vela == true 2.5:实施订单区块缓解和对象移除提醒
在本节中,我们将研究如何在订单块放宽时实现提醒,并创建我们在开始时提到的函数:
Eliminar_Objetos()
我们先来了解一下逻辑的定义:
- 我们需要调用以下函数:
esOb_mitigado_array_bajista
esOb_mitigado_array_alcista
当我们检测到订单区块被缓解时,我们会返回缓解烛形的时间,并将订单区块状态设置为 true,这相当于订单区块被缓解。
因此,为了确定订单区块是否被缓解,我们将使用它的状态:
mitigated
现在,查看订单块的结构,我们看到它有价格、时间、状态和名称:
struct OrderBlocks
{
 datetime time1;
 double price1;
 double price2;
 string name;
 bool mitigated;

};
从这个结构中,我们特别感兴趣的是提醒的两个变量:
 string name;
 bool mitigated;
- mitigated:这个布尔变量让我们知道订单区块是否已被缓解。
- name:使用此参数,我们检查缓解的订单区块之前是否已被缓解。
我们还需要:
- 两个数组;这些数组将是字符串类型并且也是动态的,因为随着更多订单区块得到缓解,我们将更新它们的大小。
- 向字符串数组添加条目的函数。
- 一个函数,用于检查我们作为订单块名称传递的字符串是否已经存在于数组中。
好的,我已经集成了缺少的函数和数组:
- 我们进入程序的全局部分,在其中写入:
string pricetwo_eliminados_oba[];
string pricetwo_eliminados_obb[];
这些就是我们需要的数组。
然后我们将创建以下函数:
  bool Es_Eliminado_PriceTwo(string pName_ob , string &pArray_price_two_eliminados[])
  {
   bool a = false; // we create the variable "a" and initialize it to false
     for(int i = 0 ; i < ArraySize(pArray_price_two_eliminados) ; i++) // we traverse all the indices of the array passed as a reference
     {
      if(pName_ob == pArray_price_two_eliminados[i]) // we will compare all the positions in the array with the variable "pName_ob"
      { // if the comparison is identical the variable "a" becomes true
       a = true;
        break; // we exit the loop
      }
     }
  return a; //we return the value of "a"
 }

 //function to add values and assign a new size to the array passed by reference
 void Agregar_Index_Array_1(string &array[], string pValor_Aagregar) {
    int num_array = ArraySize(array);
    if (ArrayResize(array, num_array + 1) == num_array + 1) {
        array[num_array] = pValor_Aagregar;
    } else {
      Print("Error resizing array");
    }
}
- 这些函数将帮助我们确保当订单区块被缓解时,它之前还没有被缓解过,以避免大量的警报垃圾。
现在我们转到 OnCalculate() 内部的部分来完成提醒编程:
- 我们首先创建一个循环,遍历订单区块数组的所有索引。
- 我们使用 if() 检查订单块的状态,并验证订单块的名称不在我们存储缓解订单区块名称的字符串数组中。
- 如果所有这些都属实,我们会向用户发出警报,告知订单区块已被解除。
- 我们将订单块的名称添加到字符串数组中以避免重复。
- 我们通过 break 退出循环来结束。
// Loop through the order blocks
for(int i = 0; i < ArraySize(ob_alcistas); i++)
  {
   if(ob_alcistas[i].mitigated == true && Es_Eliminado_PriceTwo(ob_alcistas[i].name, pricetwo_eliminados_oba) == false)
     {
      Alert("El order block alcista esta siendo mitigado: ", TimeToString(ob_alcistas[i].time1));

      Agregar_Index_Array_1(pricetwo_eliminados_oba, ob_alcistas[i].name);

      break;
     }
  }

// Loop through the order blocks
for(int i = 0; i < ArraySize(ob_bajistas); i++)
  {
   if(ob_bajistas[i].mitigated == true && Es_Eliminado_PriceTwo(ob_bajistas[i].name, pricetwo_eliminados_obb) == false)
     {

      Alert("El order block bajista esta siendo mitigado: ", TimeToString(ob_bajistas[i].time1));

      Agregar_Index_Array_1(pricetwo_eliminados_obb, ob_bajistas[i].name);

      break;
     }
  }
//+------------------------------------------------------------------+
现在我们已经完成了提醒,让我们继续删除对象:
bool  ObjectDelete(
   long    chart_id,     // chart identifier
   string  name          // object name
   );
接下来我们需要当前图表 ID:
ChartID() 订单区块名称:
name
考虑到所有这些,我们需要循环遍历所有订单块位置,然后调用:
ObjectDelete() 要删除我们创建的所有对象:
  void Eliminar_Objetos()
  {

  for(int i = 0 ; i < ArraySize(ob_alcistas) ; i++) // we iterate through the array of bullish order blocks
  {
   ObjectDelete(ChartID(),ob_alcistas[i].name); // we delete the object using the name of the order block
  }
  for(int n = 0 ; n < ArraySize(ob_bajistas) ; n++) // we iterate through the array of bearish order blocks
  {
  ObjectDelete(ChartID(),ob_bajistas[n].name);  // we delete the object using the name of the order block
  }

 }
此时,我们已经完成了指标的工作,但我们仍然需要更改函数:
OnInit() y OnDeinit()
为了正确处理我们添加的新变量和数组。
到:
OnDeinit() 我们还确保通过删除图形对象并释放存储订单区块数据的动态数组的内存来释放指标所使用的资源。
同样重要的是,如果我们正确地初始化了 ATR 处理程序,则要确保它被正确释放,以避免在关闭指标时出现内存泄漏或错误。我们的做法如下:
if(atr_i != INVALID_HANDLE)
    IndicatorRelease(atr_i);
最终实现
OnDeinit() 如下:
 void OnDeinit(const int reason)
  {
//---
  Eliminar_Objetos();

  ArrayFree(ob_bajistas);
  ArrayFree(ob_alcistas);
  ArrayFree(pricetwo_eliminados_oba);
  ArrayFree(pricetwo_eliminados_obb);

  if(atr_i  != INVALID_HANDLE) IndicatorRelease(atr_i );

  }

//---

int OnInit()
  {
//--- indicator buffers mapping
  tiempo_ultima_vela = 0;
     atr_i = iATR(_Symbol,PERIOD_CURRENT,14);

     if(Rango_universal_busqueda < 40)
     {
      Print("Search range too small");
      return (INIT_PARAMETERS_INCORRECT);
     }

      if( atr_i== INVALID_HANDLE)
     {
      Print("Error copying data for indicators");
      return(INIT_FAILED);
     }

  ArrayResize(ob_bajistas,0);
  ArrayResize(ob_alcistas,0);
  ArrayResize(pricetwo_eliminados_oba,0);
  ArrayResize(pricetwo_eliminados_obb,0);

//---
   return(INIT_SUCCEEDED);
  }
3.0:结论
在本文中,您学习了如何:
- 根据“聪明钱”和“内圈交易者”概念创建指标。
- 配置提醒。
- 在图表上绘制矩形。
我们的最终结果:

如果您已经做到了这一点,我真诚地感谢您学习更高级的交易概念的热情和耐心。编程提供了广泛的可能性,从时期的高潮和低谷等基本概念到智能交易机器人的创建。我邀请您继续探索更多文章,以在这个迷人的编程世界中前进。
如果你能与可能需要的人分享这篇文章,我会非常高兴。
为了感谢您的阅读,我准备了一个文件,其中包括我们在这里讨论的指标的所有代码。此外,我想提到的是,这个系列并没有就此结束,我计划开发更多的部分。以下是未来文章的可能概述:
第二部分:
- 集成此指标的缓冲区和绘图(买入和卖出信号缓冲区)。
- 一旦触发信号,就实施止盈 (TP) 和止损 (SL) 水平(两条线用于 TP,两条线用于 SL)。
- 介绍一种检测订单区块的新型先进方法(基于订单簿)。
如果我获得足够的支持,我计划创建第三部分,我们将使用我们开发的指标缓冲区构建一个 EA 交易。
本文由MetaQuotes Ltd译自西班牙语
原文地址: https://www.mql5.com/es/articles/15899
注意: MetaQuotes Ltd.将保留所有关于这些材料的权利。全部或部分复制或者转载这些材料将被禁止。
本文由网站的一位用户撰写,反映了他们的个人观点。MetaQuotes Ltd 不对所提供信息的准确性负责,也不对因使用所述解决方案、策略或建议而产生的任何后果负责。

您好、
我刚刚在策略测试器中 测试了我的 EA,EURUSD H4 1/1/2025-2/1/2025,在运行结束时观察到 Block Order 指标有两个问题。
首先,它在 2/3/2025 日选择了一个区块订单,而该日期在测试窗口之外;其次,它将区块文本放在了图表移动区域。
欣赏
科达角
这是您第一个指标的英文翻译版本。 我决定需要用英文理解您的许多代码注释,并重新考虑了谷歌翻译,因为 DeepL 没有给我留下深刻印象。我首先将所有 // 注释改为 #/#,以便谷歌翻译 // 行注释,然后将文本文件转换为 MS Word 文档,输入到翻译中。翻译完成后,我打开新文档并将其保存为文本文件,重新命名后开始对新源代码进行语法处理。 我估计翻译完成了 90% 的工作,但它确实添加了需要手动转换的空格和字符。 经过几天的工作,它编译成功了,没有出现任何错误。令人惊讶的是,它第一次尝试就成功了!我将它与你原来的 1000 条指标进行了比较,结果完全相同。
这是您第一个指标的英文翻译版本。 我决定需要用英文理解您的许多代码注释,并重新考虑了谷歌翻译,因为 DeepL 没有给我留下深刻印象。我首先将所有 // 注释改为 #/#,以便谷歌翻译 // 行注释,然后将文本文件转换为 MS Word 文档,输入到翻译中。翻译完成后,我打开新文档并将其保存为文本文件,重新命名后开始对新源代码进行语法处理。 我估计翻译完成了 90% 的工作,但它确实添加了需要手动转换的空格和字符。 经过几天的工作,它编译成功并没有出现错误。 令人惊讶的是, 它第一次尝试就成功了!我将它与你原来的 1000 条指标进行了比较,结果完全相同。
不幸的是,您的指标似乎在结构上存在缺陷,对交易毫无用处,因为它是根据计算时未知的未来变量进行计算的,下面的代码用粗体标出了这一点。
for( int i = Universal_search_range ; i > 5 ; i--) {
// 错误检查
if( i + 3 > ArraySize(highArray) || i + 3 > ArraySize(atr))
continue ;
if( i < 0) continue;
// 更新蜡烛图指数
one_candle = i ;// 中央蜡烛图
candle_behind_two = i +2;
candle_behind_one = one_candle +1;
two_candle = one_candle - 1;
three_candle = one_candle - 2;
four_candle = one_candle -3;
// 计算前几根蜡烛的平均成交量
body1 = MathAbs(closeArray[one_candle] - openArray[one_candle]);
body2 = MathAbs(closeArray[two_candle] - openArray[two_candle]);
body3 = MathAbs(closeArray[three_candle] - openArray[three_candle]);
不幸的是,您的指标似乎在结构上存在缺陷,对交易毫无用处,因为它是根据计算时未知的未来变量进行计算的,正如下面粗体代码中强调的那样。
for( int i = Universal_search_range ; i > 5 ; i--) {
// 错误检查
if( i + 3 > ArraySize(highArray) || i + 3 > ArraySize(atr))
continue ;
if( i < 0) continue;
// 更新蜡烛图指数
one_candle = i ;// 中央蜡烛图
candle_behind_two = i +2;
candle_behind_one = one_candle +1;
two_candle = one_candle - 1;
three_candle = one_candle - 2;
four_candle = one_candle -3;
// 计算前几根蜡烛的平均成交量
body1 = MathAbs(closeArray[one_candle] - openArray[one_candle]);
body2 = MathAbs(closeArray[two_candle] - openArray[two_candle]);
body3 = MathAbs(closeArray[three_candle] - openArray[three_candle]);
你好,CapeCoddah,我认为情况并非如此,因为例如,在所示的第一个循环中,该指标使用数组串联进行所有计算(尽管这并不常见,通常不使用数组串联),该循环用于检测订单块、所做的是从 "Universal_search_range "蜡烛图(请记住,在系列中蜡烛图 0 是最近的)到蜡烛图 6,因此在任何时候都不会使用未来的蜡烛图,如果是这种情况,那么 two_candle 或其他指数将导致值小于 0,从而超出范围。因此,蜡烛图 four_candle = one_candle - 3 将是最接近 0 的蜡烛图,如果循环结束时 i = 6,那么 four_candle = 3,因此考虑到当前蜡烛图为 0,我可以说我在任何时候都没有使用未来蜡烛图。我知道,这个名字听起来可能会令人困惑,但我这样做是因为这样更容易理解,因为在获取订单区块时,one_vela 就像是中心烛。因此,如果我在寻找强势走势,我会评估其后的蜡烛(在系列中,这将是减法)。