逐步说明如何通过 CSV 文件组织 MetaTrader 4 与 Matlab 之间的数据数组交换。
简介
众所周知,与包括 MQL 4 在内的任何编程语言相比,Matlab 环境的计算能力相当优秀。Matlab 提供的大量数学函数允许用户在执行复杂的计算时完全无视所做运算的理论基础。
但是,交易终端与 Matlab 之间的实时交互代表着一个非平凡任务。本文中,我提出了一种通过 CSV 文件组织 MetaTrader 4 与 Matlab 之间数据交换的方式。
1.交互工作
假设每根新条柱入场时,MetaTrader 4 必须向 Matlab 发送关于之前 100 个条柱的数据,并收到这些数据的处理结果。
要解决这一问题,我们需要在 MetaTrader 4 中创建一个指标,用于将数据写入到文本文件并从 Matlab 创建的另一个文本文件中读取处理结果。
MetaTrader 4 必须在每根条柱入场时创建其数据文件。它还必须尝试读取每一次跳动时的结果。为了不在 Matlab 更新结果之前读取结果,在创建我们的输出文件之前,我们要删除包含该结果的文件。在这种情况下,只有在 Matlab 完成其计算并创建了新文件之后,读取操作方可成功。
Matlab 每一秒都必须分析一次 MetaTrader 4 中创建的文件属性,并在其创建时间发生变动时开始进行处理。处理完成后,将重新创建 MetaTrader 4 在开始数据记录之前所删除的文件。MetaTrader 4 成功删除该文件,加载新数据并等待响应。
2.创建输出数据文件
很多文章里都详细介绍过如何将数据另存为一个文件,所以这里就不赘叙了。我要说明的是,我们会将数据写入 7 个列中:“DATE”、“TIME”、“HI”、“LOW”、“CLOSE”、“OPEN”、“VOLUME”。分隔符是“;”。条柱优先顺序是从前期到后期,即包含零条柱特性的行必须是最后一个被记录的。文件中有一行包含列名称。此文件名由符号名和时间框架构成。
#property indicator_chart_window
extern int length = 100;   // The amount of bars sent to be processed
double ExtMap[];           // Chart buffer
string nameData;
int init()
{
   nameData = Symbol()+".txt";         // name of the data file to be sent
   return(0);
}
int start()
{
   static int old_bars = 0;   // remember the amount of bars already known
   if (old_bars != Bars)      // if a new bar is received
   {
      write_data();                             // write the data file
   }
   old_bars = Bars;              // remember how many bars are known
   return(0);
}
//+------------------------------------------------------------------+
void write_data()
{
  int handle;
  handle = FileOpen(nameData, FILE_CSV|FILE_WRITE,';');
  if(handle < 1)
  {
    Comment("Creation of "+nameData+" failed. Error #", GetLastError());
    return(0);
  }
  FileWrite(handle, ServerAddress(), Symbol(), Period());                  // heading
  FileWrite(handle, "DATE","TIME","HIGH","LOW","CLOSE","OPEN","VOLUME");   // heading
  int i;
  for (i=length-1; i>=0; i--)
  {
    FileWrite(handle, TimeToStr(Time[i], TIME_DATE), TimeToStr(Time[i], TIME_SECONDS),
                      High[i], Low[i], Close[i], Open[i], Volume[i]);
  }
  FileClose(handle);
  Comment("File "+nameData+" has been created. "+TimeToStr(TimeCurrent(), TIME_SECONDS) );
  return(0);
}
当然,并不是所有这些数据都是必要的,但获得一个有意义的文件总是比一组带未知数据的列来的好。
3.创建图形用户界面 (GUI)
现在,文件准备就绪。让我们启动 Matlab。
我们应开发一个应用程序,用于从文件中读取文本数据,处理结果并将结果记录到另一个文件中。我们必须创建一个 GUI 以指定文件名,查看图表和启动处理。现在就开始吧。
要创建 GUI,在控制台中输入“guide”或按 Matlab 主面板上的相应按钮,以启动“快速启动向导”。在显示的对话框中,选择“新建 GUI”-->“空白 GUI(默认)”。现在我们会看到一个界面,我们要在这个界面中用空白表单来创建 GUI。在此表单中,我们将放上以下对象:“Edit Text”、“Push Button”、“Static Text”、“Axes”、“Push Button”。结果如下所示:
现在我们应针对各个对象调用可视属性生成器并设置这些属性,如下所示:
Static Text :HorizontalAlignment – left, Tag – textInfo, String - Info.
Edit Text:HorizontalAlignment – left, Tag – editPath, String – Path select .
Push Button:Tag – pushBrowse, String – Browse.
Axes:Box – on, FontName – MS Sans Serif, FontSize – 8, Tag - axesChart.
Push Button:Tag – pushSrart, String – Start.
通过更改“Tag”(标签)属性,我们为各个对象选择一个唯一名称。通过更改其他属性,我们修改外观。
一切准备就绪后,按“运行”以启动界面,确认保存界面文件和 M 文件,指定保存的文件名(例如“FromTo”),然后按“保存”。之后,GUI 将启动并进入工作状态。Matlab 生成作为我们未来程序基础的 M 文件,并在内置编辑器中打开此文件。
如果外观在某些方面不符合您的要求,关闭正在运行的 GUI,用编辑器修改对象的设置。例如,我所用的设置不能正确显示 MS Sans Serif 字体。所以我必须将其更改为“Sans Serif”。
4.构建用户界面
可在 M 文件编辑器中用 Matlab 语言对界面行为进行编程。Matlab 生成的框架程序显示用户在处理界面对象时要调用的一系列函数。这些函数为空,因此 GUI 不会进行任何操作。我们的任务是在函数中填入必要的内容。
4.1 对浏览按钮进行编程
首先,我们需要访问 MetaTrader 4 生成的一个文件,因此我们从一个函数开始说起,这个函数是通过按“浏览”按钮来调用的。
这个函数的名称由按钮名称(通过“Tag”(标签)属性设置)和后缀“_Callback”组成。在文件文本中找到函数“pushBrowse_Callback”,或按工具栏上的“显示函数”按钮并在列表中选择“pushBrowse_Callback”。
Matlab 编程语言的语法与 C 语言及类似语言中的传统编码规则有所不同。尤其是以下几点:前者无需用大括号标示函数主体或指定要传递到函数中的数据类型;数组(向量)指数从 1 开始;注释字符用的是“%”。因此,上述整个绿色文本并不是一个程序,而是 Matlab 开发人员为了便于我们掌握情况才作出的注释。
我们需要创建一个对话框,以输入该文件的全名。为此,我们要使用函数“uigetfile”:
% --- Executes on button press in pushBrowse.
function pushBrowse_Callback(hObject, eventdata, handles)
[fileName, filePath] = uigetfile('*.txt'); % receive and the path from the user
if fileName==0          % if it is canceled
    fileName='';        % create an empty name
    filePath='';        % create an empty path
end
fullname = [filePath fileName] % form a new name
set(handles.editPath,'String', fullname); % write in the editPath
这里的“handles”指的是一种用于存储我们 GUI 中所有对象的描述符的结构,包括所在表单的描述符。此结构在函数之间传递,以允许函数访问这些对象。
“hObject”是调用了函数的对象的描述符。
“set”用于针对特定值设置对象值,它可使用以下语法:set(object_descriptor, object_property_name, property_value)。
您可使用以下函数找出对象属性的值:property_value = get(object_descriptor, object_descriptor_name)。
但别忘了,名称就是一个字符串类型的值,所以它必须用单引号引起来。
关于对象及其属性,我们还有最后一个必须要注意的事项。我们用于放置 GUI 元素的表单,本身就是一个放置在“root”对象内的对象(是其后代对象)。它也有一组可修改的属性。可从界面编辑器的主工具栏调用工具“对象编辑器”以查看这些属性。顾名思义,对象“root”就是图形对象层次结构的根,它没有祖先对象。
现在我们来看一看最终会得到什么结果。现在我们按下 M 文件编辑器主工具栏上的“运行”按钮,以启动我们的 GUI。试着单击“浏览”,并选择我们的文件。文件打开了吗?然后关闭正在运行的 GUI,继续下一步。
4.2 对开始按钮、图表绘制进行编程
现在我们将通过调用一个函数来分配“开始”按钮,此函数将从文件中读取数据并在图表中显示它们。
首先我们要创建这个函数。我们需要“handles”对象描述符的结构作为输入内容。获得对象的访问权限后,我们就能够读取这些对象并设置其属性。
% data reading, chart drawing, processing, storage
function process(handles)
fullname = get(handles.editPath, 'String'); % read the name from editPath
data = dlmread(fullname, ';', 2, 2);    % read the matrix from file
info = ['Last update: ' datestr(now)];  % form an informative message
set(handles.textInfo, 'String',info);   % write info into the status bar

high = data(:,1);   % it is now high where the first column of the data matrix is
low = data(:,2);    % d low -- the second
close = data(:,3);  % --/--
open = data(:,4);   %
len = length(open); % the amount of elements in open

axes(handles.axesChart); % make the axes active
hold off; % clean axes off before adding a new chart
candle(high, low, close, open); % draw candlesticks (in the current axes)
set(handles.axesChart,'XLim',[1 len]); % set limits for charting
一些说明:
“dlmread”从文本文件中读取带分隔符的数据,并采用以下语法:dlmread(full_file_name, separator, skip_strings, skip_columns);
“length(qqq)” - 矩阵 qqq 的较大尺寸;
“now” - 当前时间和日期;
“datestr(now)” - 将时间和日期转换成一个文本;
此外您还必须注意,Matlab 提供了包括理论和示例在内的海量帮助信息。
把我们的函数放在程序末尾(这样便于查找),并将其调用添加到“pushStart_Callback”:
% --- Executes on button press in pushStart.
function pushStart_Callback(hObject, eventdata, handles)
process(handles);
按“运行”启动它,选择一个文件,按“开始”,之后就只需等结果出来。
4.3 将路径保存到一个文件
现在一切都好,就是按“浏览”后要不停得点鼠标选择文件有些麻烦。让我们试试在选择路径后保存它。
我们从读取开始。存储路径的文件名由 GUI 名称和后缀“_saveparam”组成,其扩展名为“.mat”。
创建 GUI 表单后会立即执行函数“FromTo_OpeningFcn”。尝试从文件中读取路径的操作就添加在这里。如果尝试失败,将使用默认值。
% --- Executes just before FromTo is made visible.
function FromTo_OpeningFcn(hObject, eventdata, handles, varargin)
guiName = get(handles.figure1, 'Name'); % get the name of our GUI
name = [guiName '_saveparam.mat']       % define the file name
h=fopen(name);                          % try to open the file
if h==-1                                % if the file does not open
    path='D:\';                         % the default value
else
    load(name);                         % read the file
    fclose(h);                          % close the file
end
set(handles.editPath,'String', path);   % write the name into object "editPath"
函数“FromTo_OpeningFcn”的其他字符串将保持不变。
让我们按以下方式修改函数“pushBrowse_Callback”:
% --- Executes on button press in pushBrowse.
function pushBrowse_Callback(hObject, eventdata, handles)
path = get(handles.editPath,'String'); % read the path from object editPath
[partPath, partName, partExt] = fileparts(path);    % divide the path into parts
template = [partPath '\*.txt'];                     % create a template of parts
[userName, userPath] = uigetfile(template);         % get the user name and the path from the user
if userName~=0                                      % if "Cancel" is not pressed
    path = [userPath userName];                     % reassemble the path
end
set(handles.editPath,'String', path);               % write the path into object "editPath"
guiName = get(handles.figure1, 'Name');             % get to know the name of our GUI
save([guiName '_saveparam.mat'], 'path');           % save the path
4.4 数据处理
我们来做一个示范流程,用一个四阶多项式函数插入列“OPEN”。
在我们的函数“process”的末尾添加以下代码:
fitPoly2 = fit((1:len)',open,'poly4'); % get the polynomial formula
fresult = fitPoly2(1:len); % calculate Y values for X=(from 1 to len)
hold on; % a new chart has been added to the old one
stairs(fresult,'r'); % plot stepwise by color - 'r'- red
现在尝试启动并按下“开始”。
如果得出的结果与上述结果大致相同,那就可以将数据另存为一个文件了。
4.5 将数据另存为文件
保存数据不会比读取数据更复杂。唯一要“讲究”的就是向量“fresult”必须要倒数,即方向是从最后一个到第一个。这是为了便于在 MetaTrader 4 中读取文件,从零条柱开始,直至文件结果。
让我们用以下代码补充函数“process”:
[pathstr,name,ext,versn] = fileparts(fullname); % divide the full name
                                                % of the file into parts
newName = [pathstr '\' name '_result' ext];     % re-compose the new file name
fresult = flipud(fresult);  % turn vector fresult
dlmwrite(newName, fresult);    % write in the file
现在,请确保这个包含结果的文件已创建,位于初始文件所在之处,文件名不变,只是添加了后缀“_result”。
4.6 定时器控件
这是工作中最难的一部分。我们必须创建一个定时器,用于每秒检查一次 MetaTrader 4 生成的文件。如果时间发生变动,必须启动函数“process”。定时器的停止和启动都将用“开始”按钮来控制。当 GUI 打开时,我们将删除之前创建的所有定时器。
让我们将以下代码放入函数“FromTo_OpeningFcn”中,以此创建一个定时器:
timers = timerfind; % find timers
if ~isempty(timers) % if timers are available
    delete(timers); % delete all timers
end
handles.t = timer('TimerFcn',{@checktime, handles},'ExecutionMode','fixedRate','Period',1.0,'UserData', 'NONE');
上述代码必须紧跟在之前插入内容的后面,即放在字符串“handles.output = hObject;”和“guidata(hObject, handles);”的前面。
创建 GUI 之后,通过执行此代码,Matlab 将检查定时器的可用性,删除现有定时器并创建新的定时器。此定时器将每秒调用一次函数“checktime”,并将描述符“handles”的列表传递到此函数中。除了“handles”之外,此定时器会将其自己的描述符以及包含调用时间和理由的结构传递到此函数中。我们不能影响这个过程,但在对这个要被定时器调用的函数进行编码时,我们必须考虑到这个过程。
您可根据需要定位此函数自身的位置。让它自己在 Matlab 状态栏中编写它被调用的时间:
% function called by the timer
function checktime(obj, event, handles)
set(handles.textInfo,'String',datestr(now));
定时器在创建之初处于停止状态,现在您应该启动它。让我们找到函数“pushStart_Callback”。我们对此函数中的调用“process(handles)”进行注释,并将定时器管理方式写入此函数中:
% --- Executes on button press in pushStart.
function pushStart_Callback(hObject, eventdata, handles)
% process(handles);
statusT = get(handles.t, 'Running'); % Get to know the timer status
if strcmp(statusT,'on')     % If it is enabled -
    stop(handles.t);        % disable it
    set(hObject,'ForegroundColor','b'); % change color of pushStart marking
    set(hObject,'String',['Start' datestr(now)]); % change the button top marking
end
if strcmp(statusT,'off')    % If it is disabled -
    start(handles.t);       % enable it
    set(hObject,'ForegroundColor','r');% change color of pushStart marking
    set(hObject,'String',['Stop' datestr(now)]); % change the button top marking
end
现在让我们检查是否一切正常。尝试用“开始”按钮启用和禁用此定时器。如果启用了定时器,路径输入字段上方的时钟必须能够正常工作。
关闭 GUI 时,可使用“X”按钮更确切地删除此定时器。如果想要这么做,可在函数“figure1_CloseRequestFcn”的开头添加
stop(handles.t) ; % stop the timer
delete(handles.t); % delete the timer
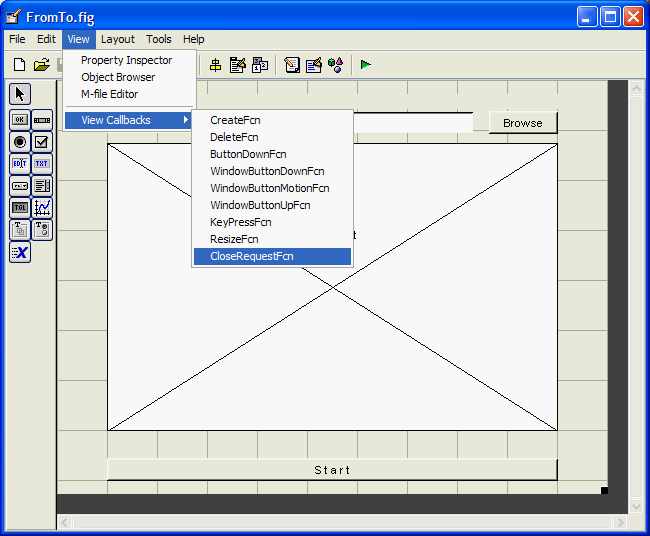
。此函数将在 GUI 关闭时被调用。您可从 GUI 编辑器中访问此函数:

但请注意,现在如果您在尚未关闭正在运行的 GUI 之前按下了此编辑器的“运行”按钮,将创建一个新的定时器,但旧的定时器不会被删除。每次这样的操作都会生成一个新定时器。您可使用 Matlab 控制台中的命令“delete(timerfind)”清除这些“未清算的”定时器。
现在,如果一切正常,我们将创建一个函数来检查从 MetaTrader 4 做所的最近一次文件修改的时间:
% function to be called by the timer
function checktime(obj, event, handles)
filename = get(handles.editPath, 'String'); % get to know the file name
fileInfo = dir(filename);        % get info about the file
oldTime = get(obj, 'UserData');  % recall the time
if ~strcmp(fileInfo.date, oldTime) % if the time has changed
    process(handles);
end
set(obj,'UserData',fileInfo.date); % save the time
set(handles.pushStart,'String',['Stop ' datestr(now)]); % override the time
函数“dir(full_file_name)”返回返回一个包含文件信息(文件名、日期、字节数、是否是目录)的结构。有关上一个文件的创建时间的信息将存储在定时器对象的“Userdata”属性中。此对象的描述符被传递到函数“checktime”中,并被命名为 obj。
现在,在更改 MetaTrader 4 创建的文件时,我们的程序将覆盖结果。您可通过手动修改文件(例如删除最近的字符串)和跟踪结果图表或文件中的变动来验证这一点。当然,这时必须要按“开始”按钮。
如果在程序操作期间创建了一个包含图表副本的额外窗口,则在函数“process”开头添加以下字符串:
set(handles.figure1,'HandleVisibility','on');
5.在 MetaTrader 4 中绘制结果
现在让我们返回到 MetaTrader 4。我们必须用一个可从文件中读取结果并将其绘制在图表中的函数来补充我们的指标。该程序的行为将如下所示:
1.如果收到一个新条柱:删除旧的结果文件,擦除图表,并保存数据文件。
2.如果此结果文件是可读文件:读取此文件,绘制一个图表,删除结果文件。
这里我不再详述以下代码的工作原理,因为其他文章里介绍过从文件中读取数据和绘制指标的相关内容。我注意的只是当结果文件被放入图表后,此处的结果文件就将被删除。所以,如果您看到多条读取错误消息,不必担心。
两种情况下会出现读取错误:
1.接收到新条柱后就出现读取错误,因为此时尚未创建结果文件。
2.已读取结果并绘制完图表后就出现读取错误,因为结果文件已被删除,以确保不会重新读取相同的数据。
因此程序几乎一直会保持其“读取错误”状态。:)
#property indicator_chart_window
#property indicator_buffers 1
#property indicator_width1 2
#property indicator_color1 Tomato
extern int length = 100;   // The amount of bars to be sent for processing
double ExtMap[];           // Chart buffer
string nameData;
string nameResult;

int init()
{
   nameData = Symbol()+".txt";         // the name of the data file to be sent
   nameResult = Symbol()+"_result.txt";// the name of the received file containing results
   SetIndexStyle(0, DRAW_LINE);
   SetIndexBuffer(0, ExtMap);
   return(0);
}
int deinit()
  {
   Comment("");
   return(0);
  }
int start()
{
   static int attempt = 0;    // the amount of attempts to read the result
   static int old_bars = 0;   // remember the amount of the known bars

   if (old_bars != Bars)      // if a new bar has income
   {
      FileDelete(nameResult);                   // delete the result file
      ArrayInitialize( ExtMap, EMPTY_VALUE);    // empty the chart
      write_data();                             // save the data file

      old_bars = Bars; return(0);               // nothing should be done this time
   }
   //
   int handle_read = FileOpen(nameResult,
                              FILE_CSV|FILE_READ,
                              ';'); // try to open the result file
   attempt++;                       // count the attempt to open

   if(handle_read >= 0)             // if the file has opened for reading
   {
      Comment(nameResult+". Opened with attempt #"+ attempt); // opening report
      read_n_draw(handle_read);  // read the result and draw a chart
      FileClose(handle_read);    // close the file
      FileDelete(nameResult);    // delete the result file
      attempt=0;                 // zeroize the amount of attempts to read
   }
   else                          // if we cannot open the result file
   {
      Comment( "Failed reading "+nameResult+
               ". Amount of attempts: "+attempt+
               ". Error #"+GetLastError()); //Report about failed reading
   }
   old_bars = Bars;              // remember how many bars are known
   return(0);
}
//+------------------------------------------------------------------+
void read_n_draw(int handle_read)
{
   int i=0;
   while ( !FileIsEnding(handle_read))
   {
      ExtMap[i] = FileReadNumber(handle_read);
      i++;
   }
   ExtMap[i-1] = EMPTY_VALUE;
}


void write_data()
{
  int handle;
  handle = FileOpen(nameData, FILE_CSV|FILE_WRITE,';');
  if(handle < 1)
  {
    Comment("Failed creating "+nameData+". Error #", GetLastError());
    return(0);
  }
  FileWrite(handle, ServerAddress(), Symbol(), Period());                  // header
  FileWrite(handle, "DATE","TIME","HIGH","LOW","CLOSE","OPEN","VOLUME");   // header
  int i;
  for (i=length-1; i>=0; i--)
  {
    FileWrite(handle, TimeToStr(Time[i], TIME_DATE), TimeToStr(Time[i], TIME_SECONDS),
                      High[i], Low[i], Close[i], Open[i], Volume[i]);
  }
  FileClose(handle);
  Comment("File "+nameData+" has been created. "+TimeToStr(TimeCurrent(), TIME_SECONDS) );
  return(0);
}
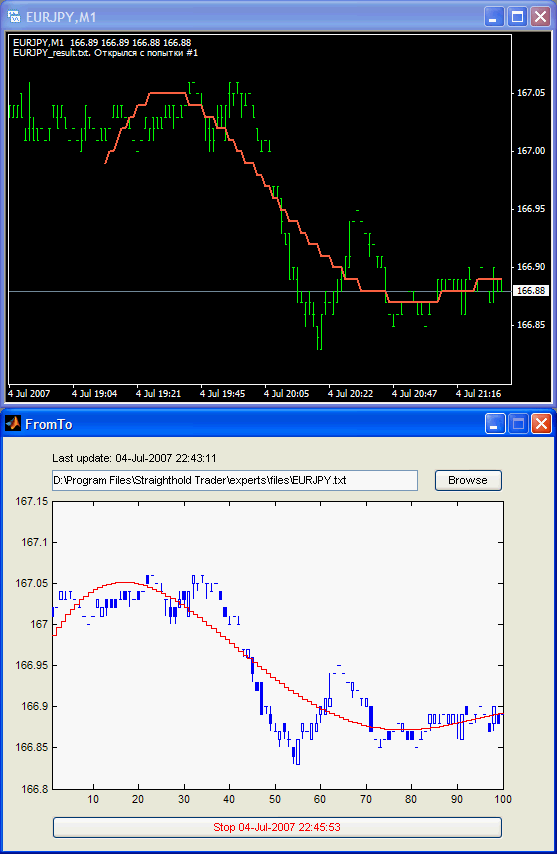
以下是我的最终结果。我希望我没犯任何错误,以便您可以重现这个结果。

总结
本文中,我介绍了一种通过 CSV 文件组织 MetaTrader 4 与 Matlab 之间的交互的方式。此方法既不是独一无二的方法,也不是最佳的方法。它的价值在于它可帮助交换数据数组,而无需去学会使用除 MetaTrader 4 和 Matlab 之外的任何编程工具。
本文由MetaQuotes Ltd译自俄文
原文地址: https://www.mql5.com/ru/articles/1489
注意: MetaQuotes Ltd.将保留所有关于这些材料的权利。全部或部分复制或者转载这些材料将被禁止。
本文由网站的一位用户撰写,反映了他们的个人观点。MetaQuotes Ltd 不对所提供信息的准确性负责,也不对因使用所述解决方案、策略或建议而产生的任何后果负责。
 MT4TerminalSync - MetaTrader 4 终端的同步系统
 终端 MetaTrader 4 中的测试程序:应该了解

