ATR Scanner Pro MT5
- Göstergeler
- Sürüm: 1.40
- Güncellendi: 9 Haziran 2024
- Etkinleştirmeler: 15

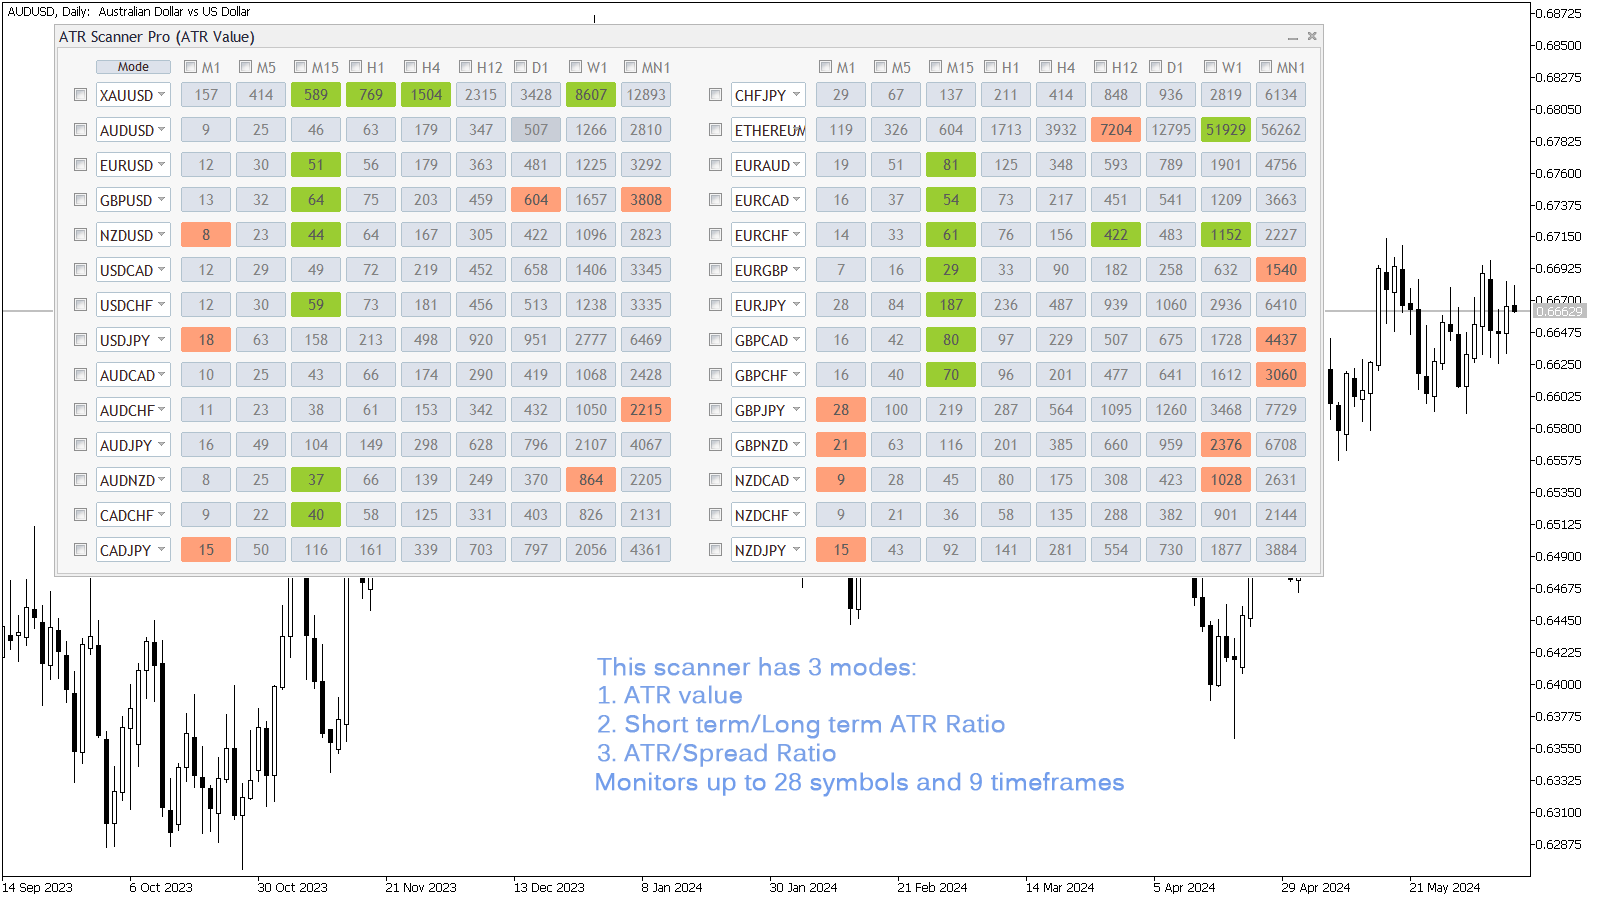
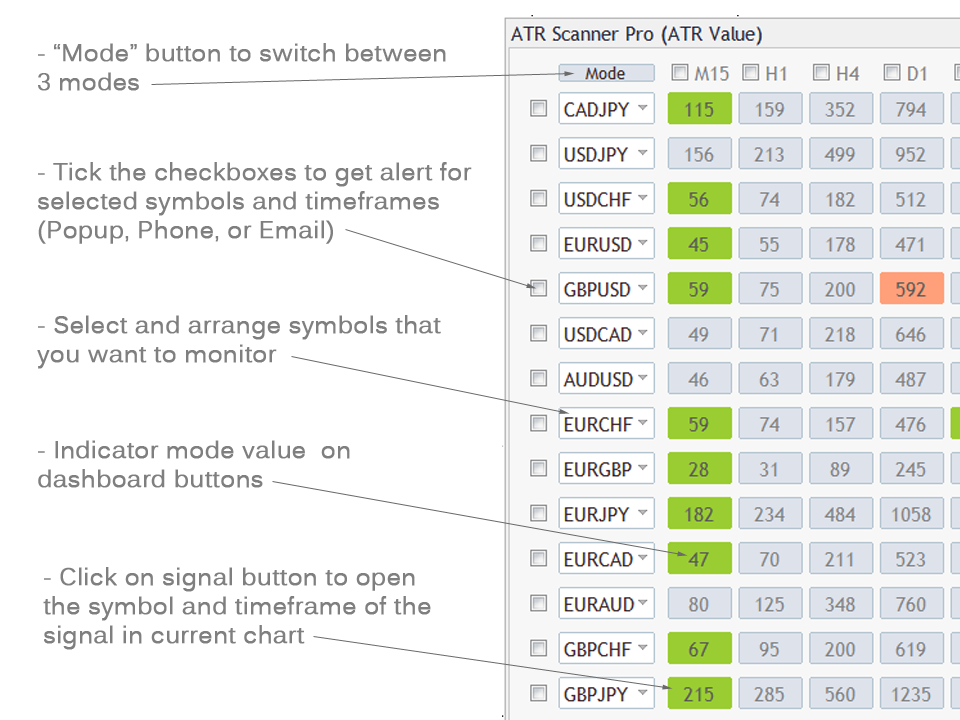
ATR Scanner Pro is a multi symbol multi timeframe volatility scanner that monitors and analyzes Average True Range indicator value in up to 28 symbols and 9 timeframes in 3 modes :
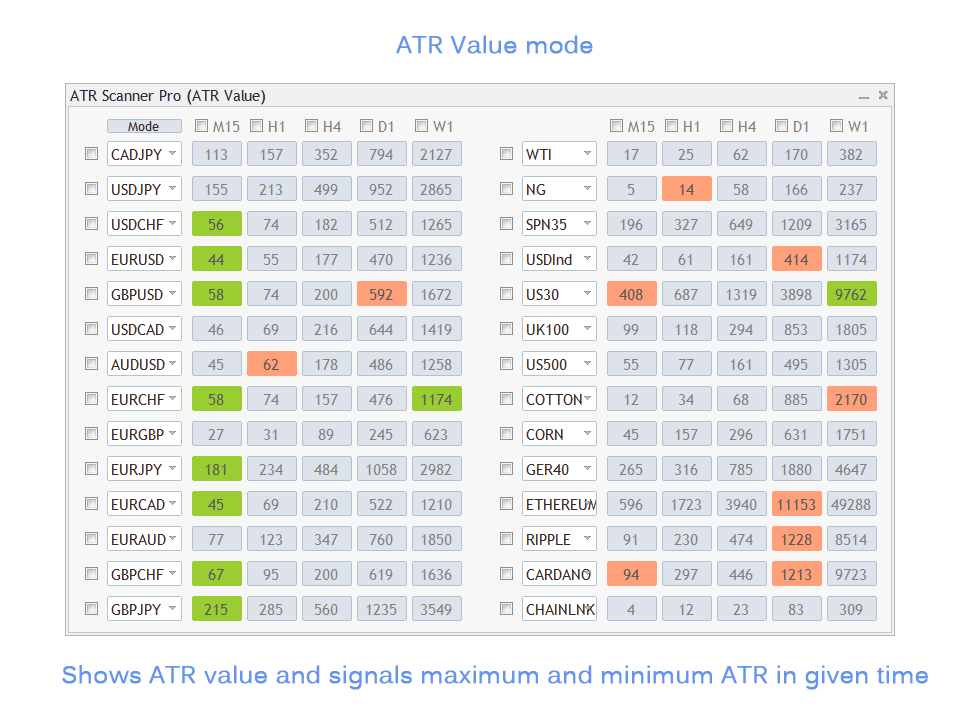
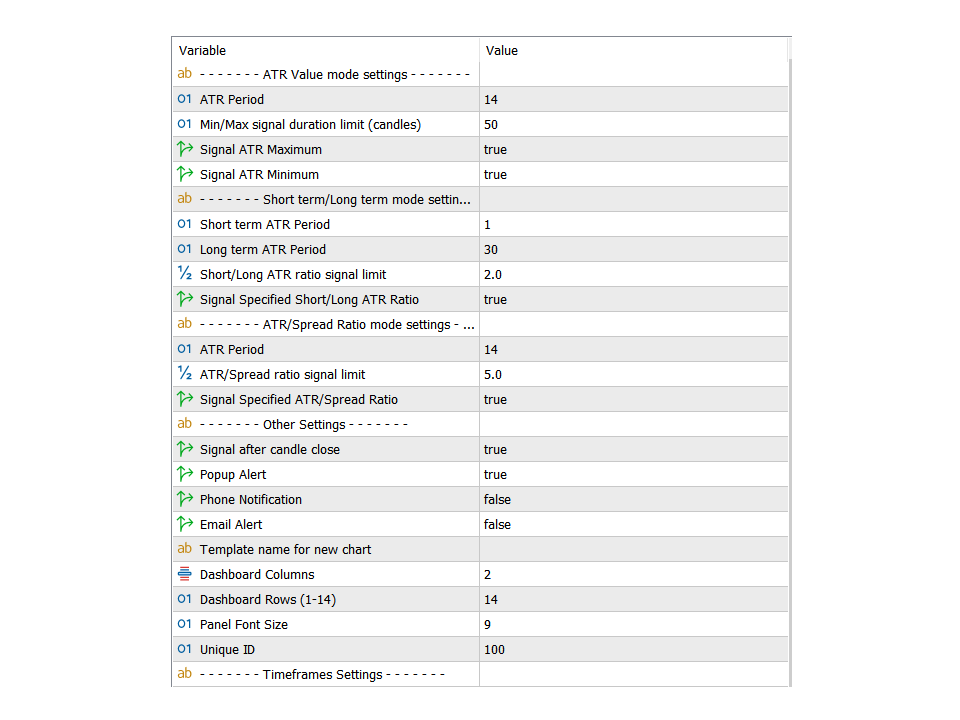
- ATR value: As a volatility dashboard it shows the ATR indicator value in all pairs and timeframes and signals when the ATR value reaches a maximum or minimum in a given duration.
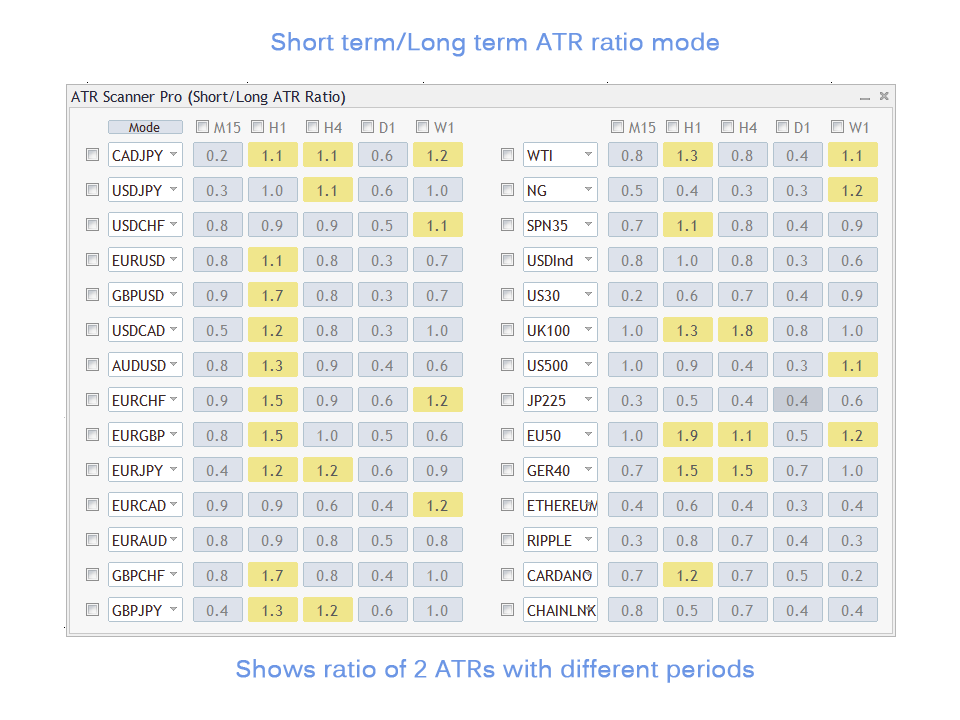
- Short term ATR/Long term ATR ratio: It shows ratio of 2 ATRs with different periods. It's useful in detecting short term volatility and explosive moves.
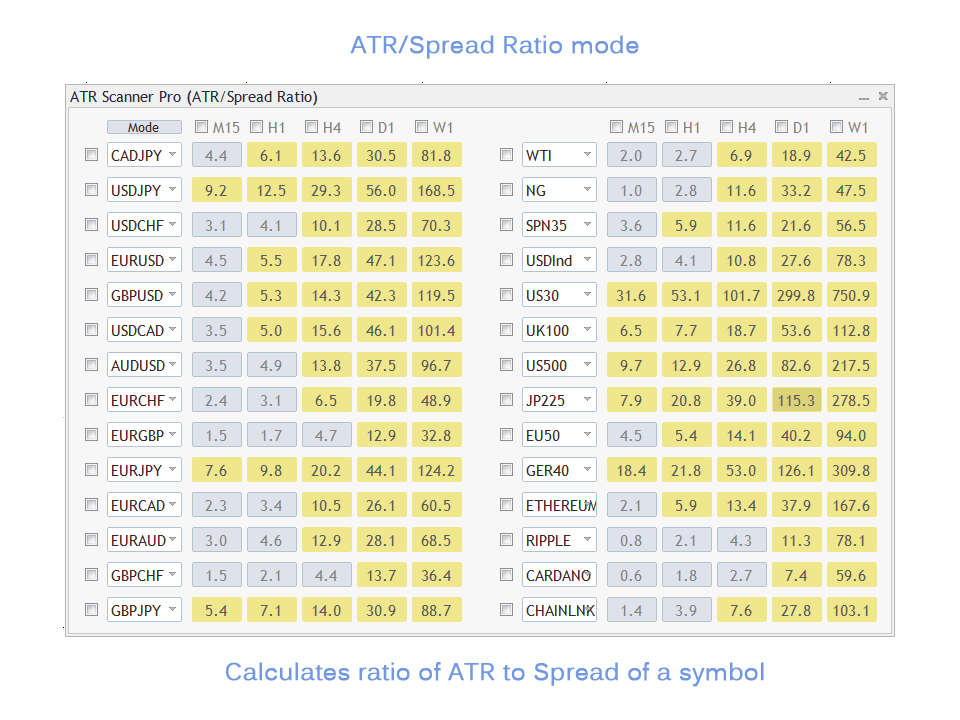
- ATR Value/Spread ratio: Shows the ratio of ATR and symbol spread useful in choosing a symbol to trade considering money management especially when we are trading in lower timeframes. (scalping)
ATR Scanner Pro features:
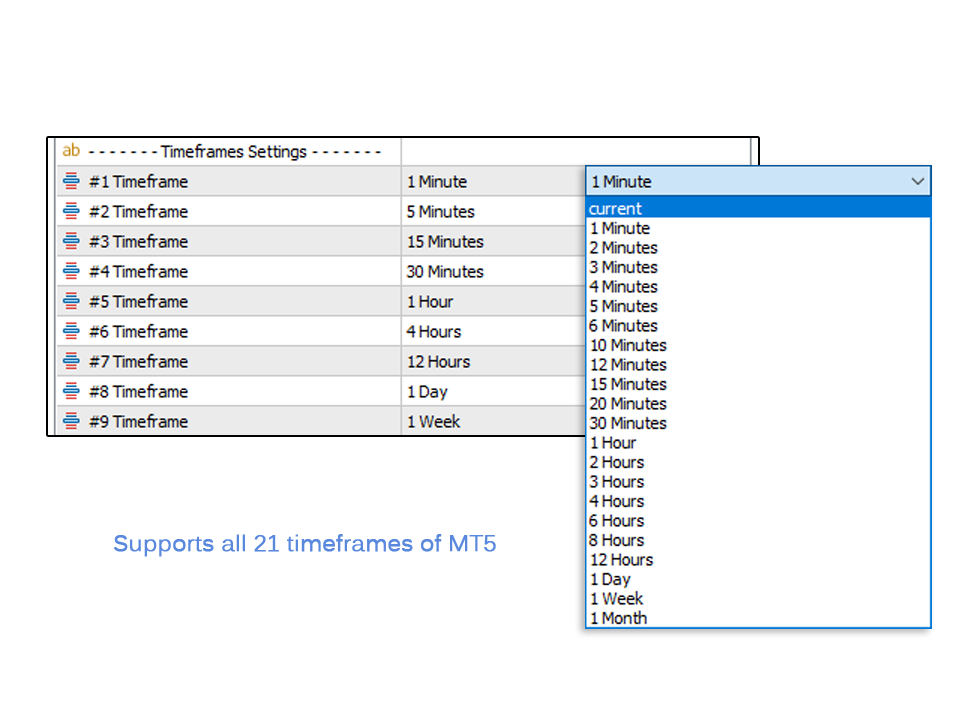
- Monitors 28 customizable instruments and 9 timeframes at the same time.
- Supports all 21 timeframes of the MT5 platform.
- Popup, email, and phone notification alerts for selected symbols and timeframes.
- Quick review of signals in the same chart by clicking on signal buttons.
Notes
- If you want to monitor more than 28 instruments you can load the indicator on another chart with different "Unique ID" in the settings and set different symbols for it.
- The symbols that you want to add to the ATR dashboard must be visible in the MetaTrader market watch window. The first time you run the indicator or load a new symbol in the dashboard it might take a few seconds to update its data and show signals.
If you trade strong price moves or any type of consolidation breakouts, you may want to try the Reward Multiplier.
Kullanıcı değerlendirmeye herhangi bir yorum bırakmadı
You can decrease the number of displayed instruments on the dashboard. In the settings under the "Other settings" section, set the "Dashboard columns" and "Dashboard rows" to the desired numbers.
Additionally, the settings description blog provides further tips to enhance the dashboard's performance.
Regards