ATR Scanner Pro MT5
- Indicadores
- Versión: 1.40
- Actualizado: 9 junio 2024
- Activaciones: 15

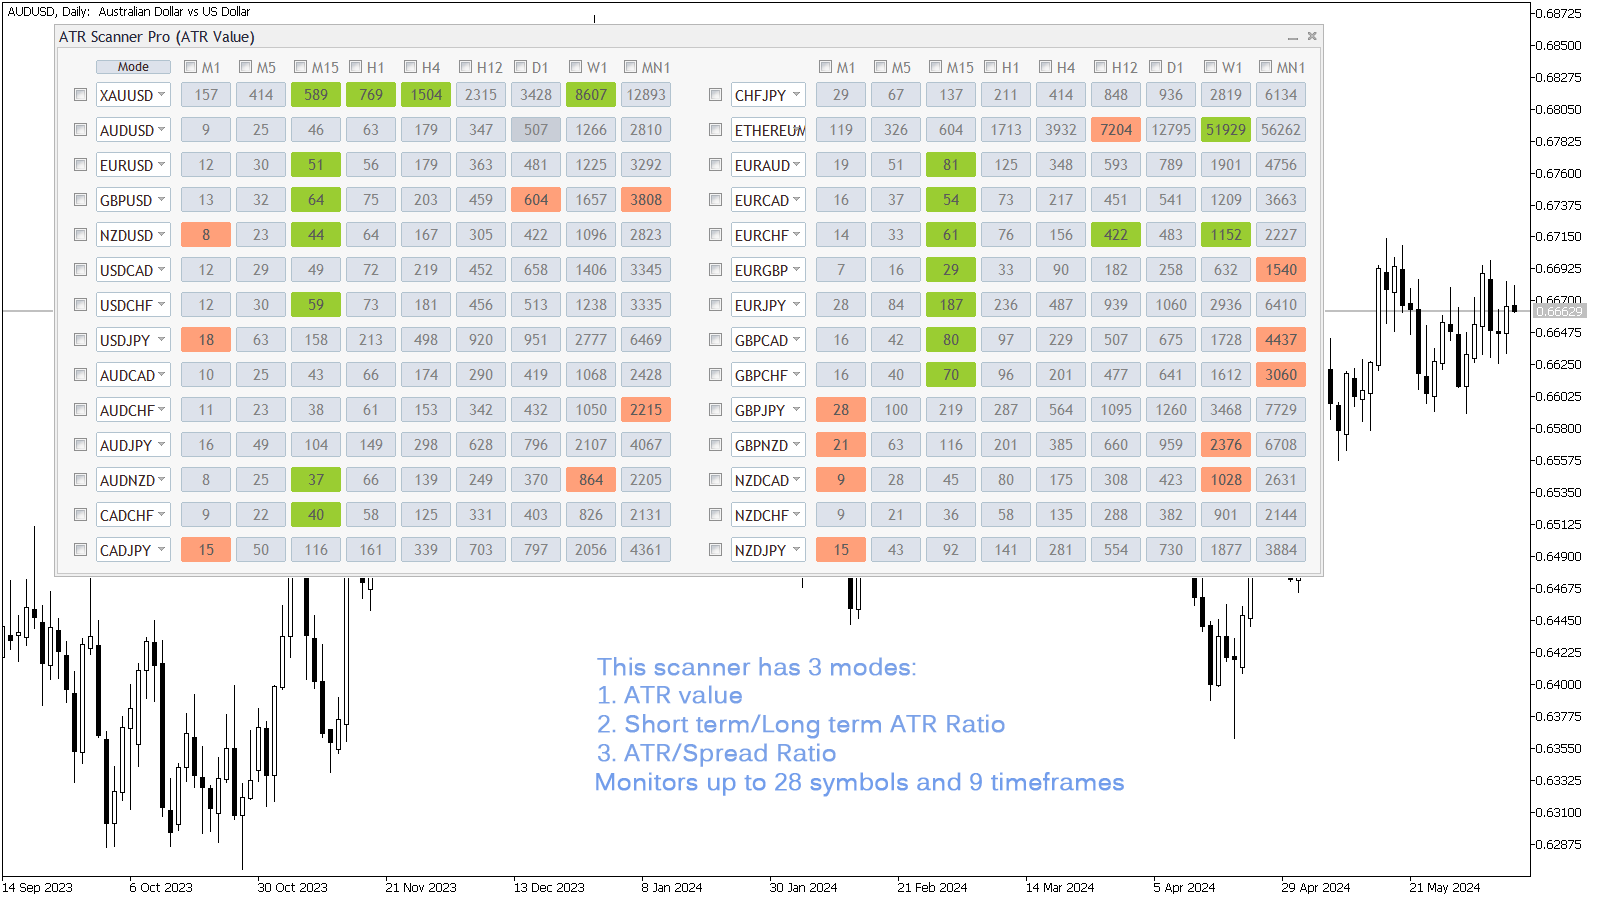
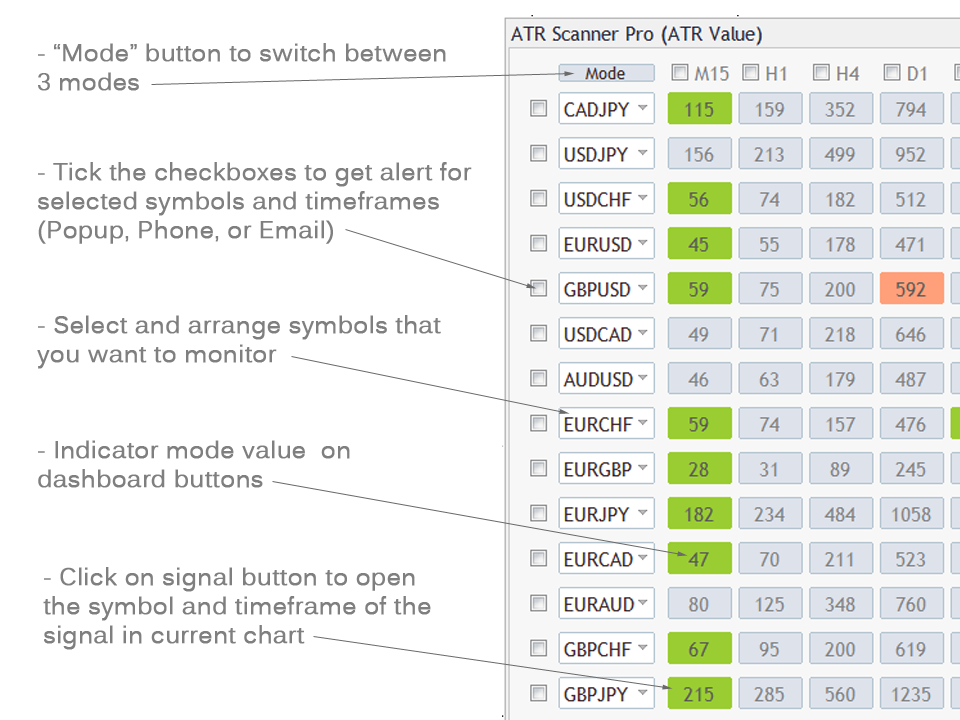
ATR Scanner Pro es un escáner de volatilidad multi símbolo multi timeframe que monitoriza y analiza el valor del indicador Average True Range en hasta 28 símbolos y 9 timeframes en 3 modos :
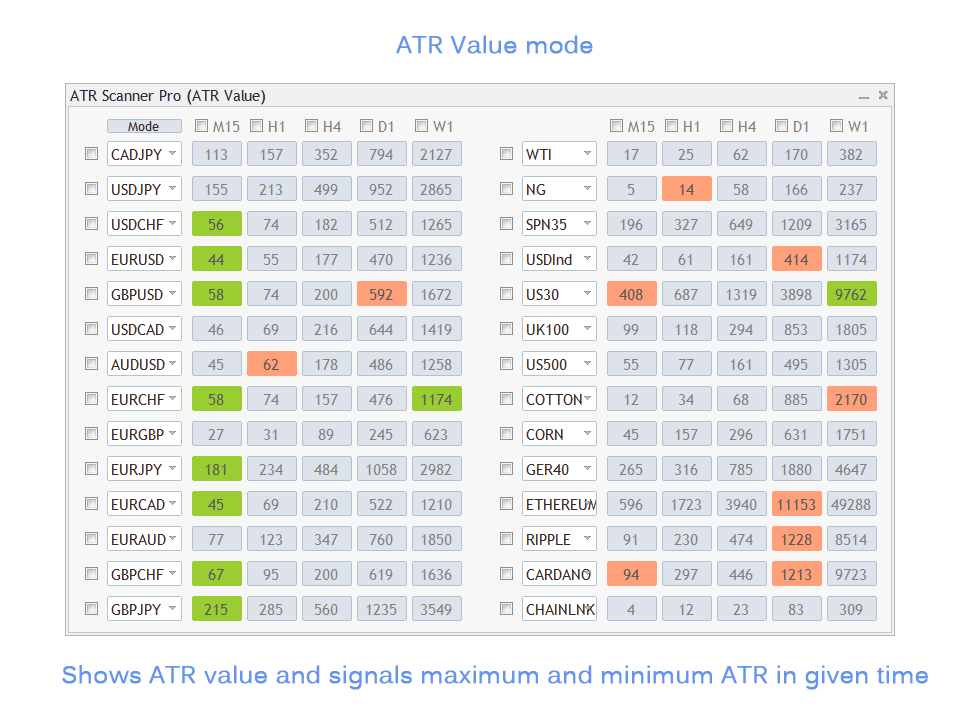
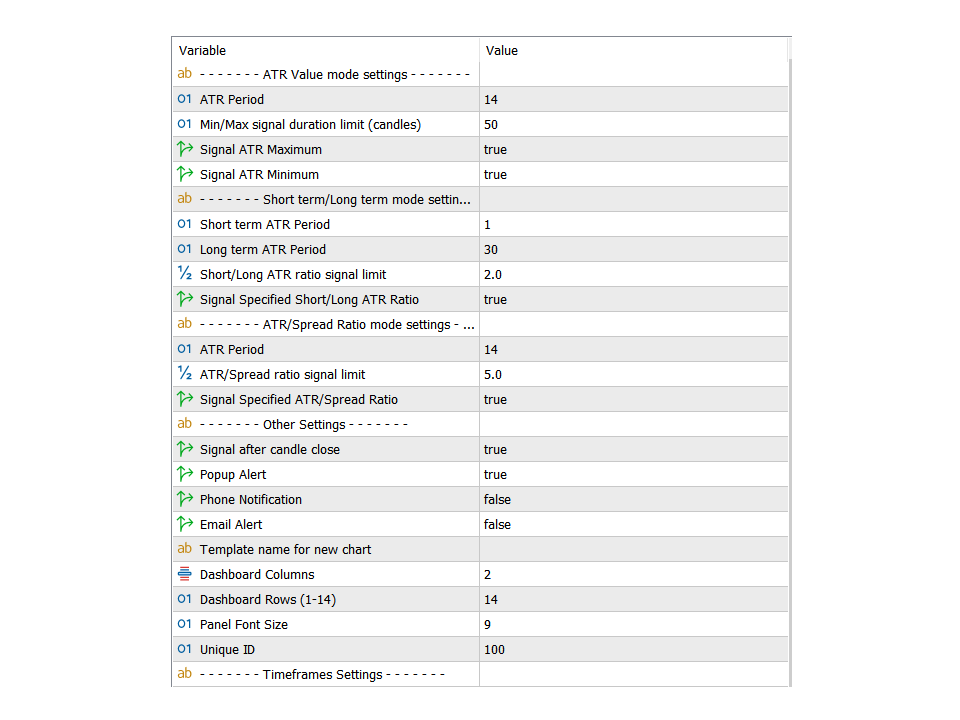
- Valor ATR: Como panel de volatilidad muestra el valor del indicador ATR en todos los pares y plazos y señala cuando el valor ATR alcanza un máximo o un mínimo en una duración determinada.
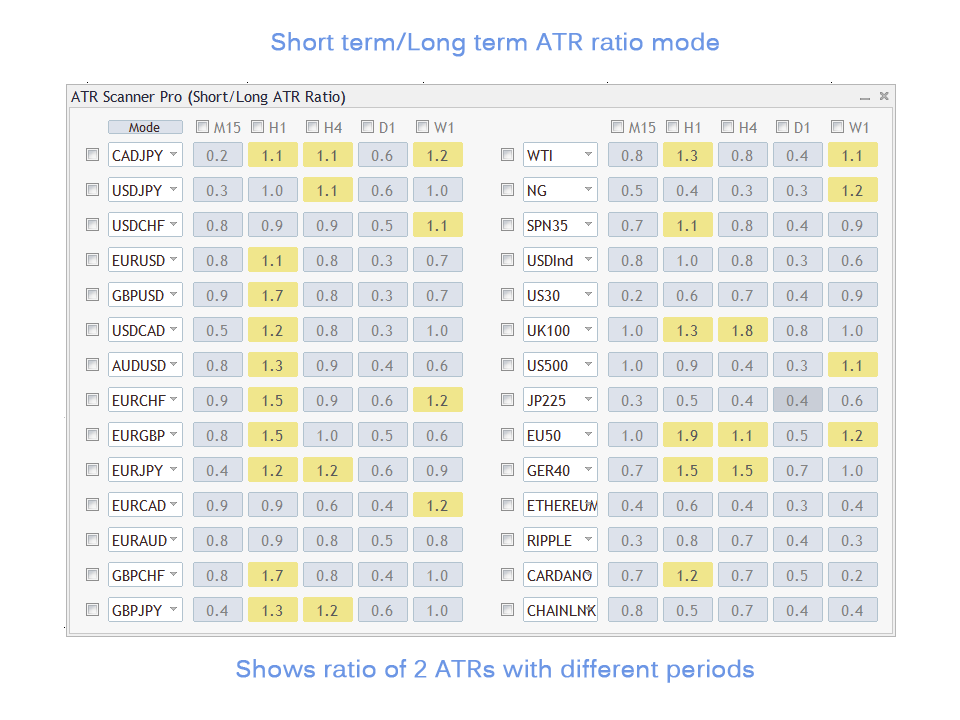
- Relación ATR corto plazo/ATR largo plazo: Muestra la relación de 2 ATRs con diferentes periodos. Es útil para detectar volatilidad a corto plazo y movimientos explosivos.
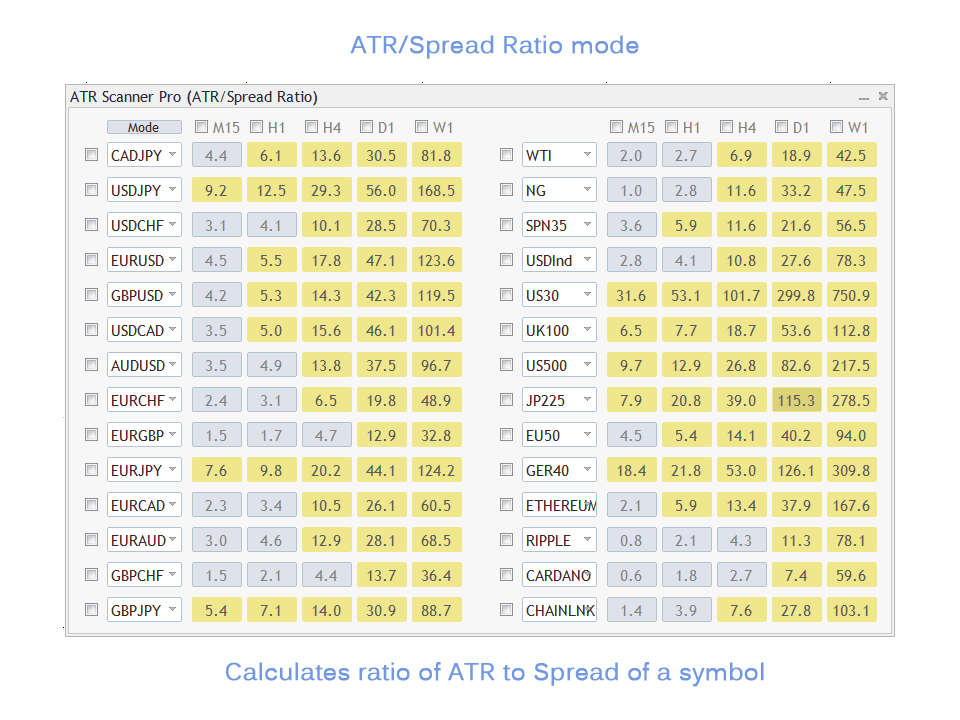
- Ratio ATRValue/Spread: Muestra el ratio de ATR y spread del símbolo útil para elegir un símbolo para operar teniendo en cuenta lagestión monetaria especialmente cuando operamos en timeframes inferiores. (scalping)
Características de ATR Scanner Pro:
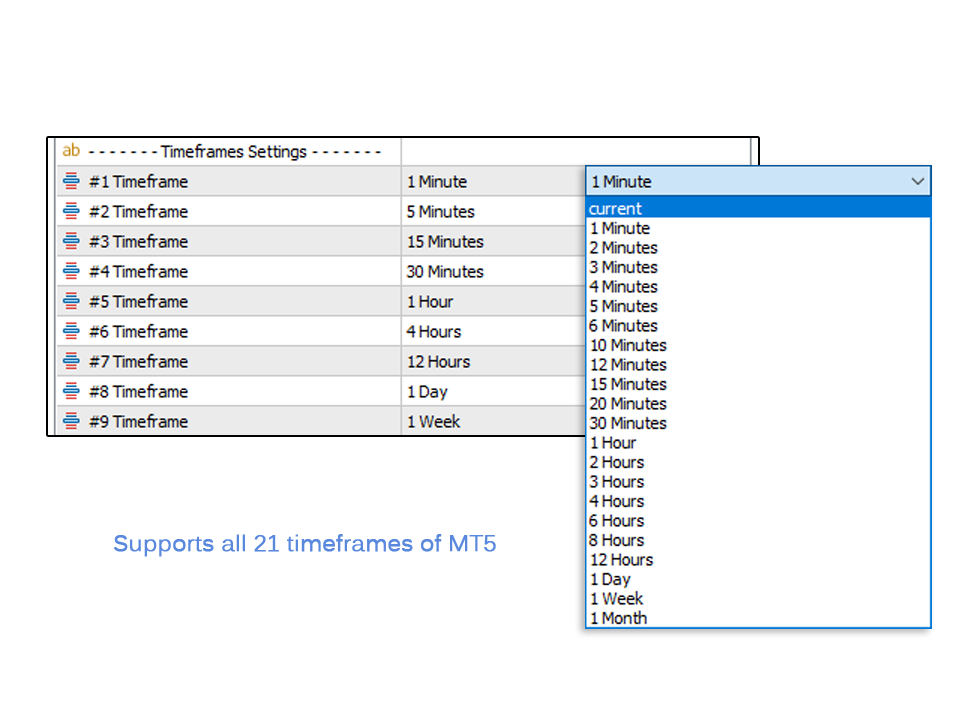
- Monitoriza 28 instrumentos personalizables y 9 timeframes al mismo tiempo.
- Soporta los 21 timeframes de la plataforma MT5.
- Alertas emergentes, por correo electrónico y por teléfono para los símbolos y plazos seleccionados.
- Revisión rápida de las señales en el mismo gráfico haciendo clic en los botones de señal.
Notas
- Si desea supervisar más de 28 instrumentos, puede cargar el indicador en otro gráfico con diferente "ID único" en la configuración y establecer diferentes símbolos para él.
- Los símbolos que desea añadir al tablero ATR deben ser visibles en la ventana de vigilancia del mercado MetaTrader. La primera vez que ejecute el indicador o cargar un nuevo símbolo en el tablero de instrumentos que puede tardar unos segundos para actualizar sus datos y mostrar señales.
Si usted opera con fuertes movimientos de precios o cualquier tipo de rupturas de consolidación, es posible que desee probar el Reward Multiplier.
El usuario no ha dejado ningún comentario para su valoración
You can decrease the number of displayed instruments on the dashboard. In the settings under the "Other settings" section, set the "Dashboard columns" and "Dashboard rows" to the desired numbers.
Additionally, the settings description blog provides further tips to enhance the dashboard's performance.
Regards