Max Min Levels

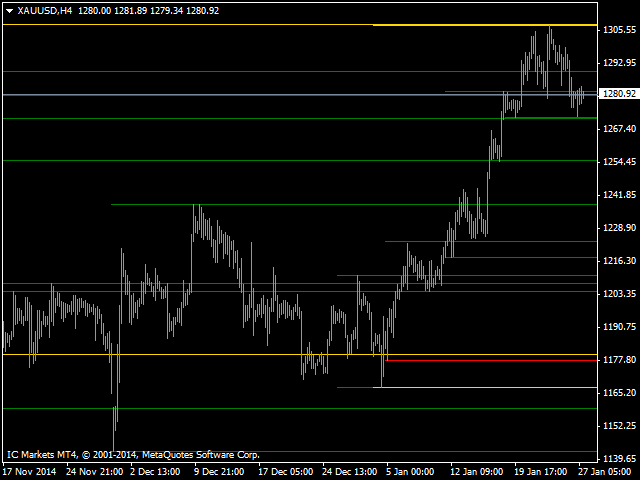
The indicator makes levels according to local maximums and minimums of a week, a month, or a year.

Parameters:

  • Week number - number of weeks for lines display
  • Week level color - Week line color
  • Month number - number of months for lines display
  • Month level color - Month line color
  • Year number - number of years for lines display
  • Year level color - Year line color
  • Width line - Width of lines
  • Style line - Style of lines
Önerilen ürünler
Features: Sharkfin Alerts Multi-timeframe Multi-currency SM TDI: To show TDI lines with sharkfin levels Zigzag MTF: To see Higher Timeframe trend Detailed blog post and extras: https://www.mql5.com/en/blogs/post/759138 Arrows works on a single timeframe and single currency. But it’s visually helps see that sharkfins. You can also get the simple arrows from mql5 site product: https://www.mql5.com/en/market/product/42405 About Scanner: It is an easy to use simplified scanner. It will show when
Indicators 14 in 1
Makarii Gubaydullin
5 (1)
Kolay işlem için 14 gösterge ve yardımcı araç Bu yardımcı program, trader'ın belirli eylemleri için yararlı olabilecek 14 ek araç içerir,   böylece işlem sürecini basitleştirir ve hızlandırır. Benim  #1 Trade Manager 'ıma göz atın: 66+ özellik ve gösterge içerir  |   Bana ulaşın  sorularınız varsa Farklı monitör çözünürlükleri nedeniyle, bazı kullanıcılar etiketlerin üst üste göründüğünü veya çok küçük olduğunu fark edebilir. Bu sorunu yaşarsanız, yazı boyutunu ayarlayabilirsiniz: giriş değişken
Renko On Chart
Mikhail Zhitnev
1 (1)
You can now use the conventional price charts to display Renko bars. This indicator can send dialog boxes with alerts, push notifications to mobile devices and emails. You can easily use this indicator to create Expert Advisors, because the indicator uses buffers. Indicator parameters Renko size, points - size of Renko bars Arrows gap, points - distance to the signal arrows Alerts - true/false - use pop-up alerts when signals appear Push notifications - send Push notifications to the mobile ter
AllTrendLines
Evgeniy Zhdan
4 (1)
Brief Description of the All Trend Lines Indicator The indicator analyzes the wave structure of the market. What it displays on the chart: First. Wave pivots (semaphores) • Red markers – wave highs • Yellow markers – wave lows • Yellow-green markers – additional local extremes Second. Trend lines • Purple/blue lines – trends based on highs (resistance/support) • Beige/green lines – trends based on lows • Lines are built automatically by connecting wave pivots of the same type Third. Main trend
I recommend you to read the   product's blog  (manual) from start to end so that it is clear from the beginning what the indicactor offers. This multi time frame and multi symbol divergence dashboard indicator sends an alert when one or two different divergences have been identified. It can be used with all time frames from M1 to MN. It is possible to enable moving average or RSI trend filter to filter out only the strongest setups. It should be combined with your own confirmation rules, techni
The Market Structures Pro indicator finds and displays 5 (five) patterns of the Smart Money Concepts (SMC) system on the chart, namely: Break Of Structures (BoS)       Change of character (CHoCH) Equal Highs & Lows Premium, Equilibrium and Discount zones with Fibo grid High-high, Low-low, High-low and Low-high extremes Patterns are displayed for two modes - Swing and Internal and are easily distinguished by color on the chart. Internal mode features higher contrast colors, finer lines, and smal
Rectangle Trading Custom   is a powerful technical analysis tool designed for price action and range-based traders. It allows users to define consolidation zones and receive alerts when the price breaks out of these zones or approaches trendlines drawn on the chart. Rectangles and Trendlines will be extended into future with one click. Rectangle point size, name and prices will be displayed around rectangle. Key Features: Draw Trading Zones (Rectangle Zones) Users can manually draw rectangles t
Market Noise Piyasa Gürültüsü, fiyat grafiğindeki piyasa aşamalarını belirleyen ve aynı zamanda bir birikim veya dağıtım aşaması meydana geldiğinde net, yumuşak trend hareketlerini gürültülü düz hareketlerden ayıran bir göstergedir. Her aşama kendi ticaret türü için iyidir: trendi takip eden sistemler için trend, agresif sistemler için ise yatay. Piyasa gürültüsü başladığında işlemlerden çıkmaya karar verebilirsiniz. Aynı şekilde ve tam tersi, gürültü biter bitmez agresif ticaret sistemlerini
Ska ZigZag BuySell
NKATEKO VUKOSI LEROY MASANGO
Ska ZigZag BuySell indicator determines the overbought and oversold regions within a trend. The indicator determines the overbought region by the candlestick high and the oversold region by the candlestick low. This indicator only gives signals with arrow and audible alerts each and every time when a new candlestick appear. To utilize the full strategy i recommend using "Ska ZigZag BuySell" together with "Ska ZigZag Line". The Ska ZigZag Line indicator is available for free. NOTE: Indicator is h
Qv² Stdev is indicator developed based on standard deviation of prices and trading volume. Buy signals are indicated by arrows up. Sell signals are indicated by arrows down. An important detail is that the Qv² Volume has two bands, an upper and a lower, both of which serve as a target for take profit. It is recommended to use it in H1 Can be used in all pairs (I use in Gold). Good Business, in the trending market To find out some more about my work please click here
Trend Rever
Vitalii Zakharuk
The Trend Rever indicator uses two lines of different colors to display buy or sell signals. The first of these lines is red and the second is blue. When changing the color of the lines, an arrow is also displayed, which indicates which deal to open, buy or sell. A simple but effective system for determining the Forex trend. The algorithm takes into account the measurement of prices, and this method also focuses on the measurement of each of the price drops - which gives more detailed informati
Implementation of indication of trend movement with moments for potential stops in the Cloud Power indicator. The transition to the shadow warns of a possible reversal. The entry of the price inside the shadow speaks of a flat movement. The indicator tracks the market trend with unmatched reliability, ignoring sharp market fluctuations and noise around the average price. Simple, visual and efficient use. The indicator does not redraw and does not lag. It can be easily used as an independent t
This indicator is used to indicate the difference between the highest and lowest prices of the K line, as well as the difference between the closing price and the opening price, so that traders can visually see the length of the K line. The number above is the difference between High and Low, and the number below is the difference between Close and Open. This indicator provides filtering function, and users can only select K lines that meet the criteria, such as positive line or negative lin
Open close levels Open close levels -  is an indicator for MetaTrader 4, which displays High/Low, Open/Close, ATR levels  (set manually) of the day, week, month on the chart. Marks round levels, signs the days of the week, numbers every week. All levels are marked with price tags with a price symbol. Also, the indicator automatically calculates and displays on the chart the distance that the price has passed from High to Low and from Open to Close by day, week and month. The indicator displays
NO REPAINT ADVANCED CHART PATTERN INDICATOR By definition, a price ( chart)  pattern is a recognizable configuration of price movement that is identified using a series of  trendlines  and/or curves. When a price pattern signals a change in trend direction, it is known as a reversal pattern; a continuation pattern occurs when the trend continues in its existing direction following a brief pause. Advanced Chart Pattern Tracker is designed to find the MOST ACCURATE patterns. A special script is a
Multicurrency indicator Any chart obs is a price chart with a percentage scale. Can be displayed as a line and as a histogram. There is also a reverse function available, it mirrors the chart. The name of an instrument to be displayed is specified in the input parameters, the current symbol is used on default. The indicator doesn't have lags as it is not smoothed with any formulas, but bound to a percentage scale, what allows detecting the price equilibrium, the overbought and oversold state. Th
Muvi2A
Mikhail Bilan
Similarly with sales. Additionally, the indicator contains a buy or sell signal in the form of arrows.  Power type indicator.  Test it in a tester to make sure that it works. It is important to select settings depending on the volatility of the asset. Good for scalping and long-term trading. Lots of settings. The most interesting thing is the ability to set in the indicator for moving on timeframes from 1 minute on the timeframes of the main chart. The signals become even more accurate) It
This indicator is meant for Harmonic Traders, it helps them in identifying the formed patterns by analyzing the market past data, looking for Harmonic Patterns. The Patterns that this indicator can detect are: AB=CD Butterfly Gartely Crab Bat The indicator shows the following: The completed pattern, with the critical zone highlighted in Gray box The suggested 3 take profit levels (in green) The Suggested Stop Loss level (in Red) The formed pattern ratios can be checked by hovering the mouse on t
VWAP pro
Mikhail Nazarenko
VWAP   (Value Weighted Average Price)   is an indicator of market makers and banks. It is used by professional traders for intraday, weekly and long-term trading. If you are not familiar with it yet, it is high time to figure it out. How does VWAP work? VWAP shows the volume-weighted average price over a certain period. Its calculation takes into account both the price change and the volume of transactions in each candle. Candles with a higher volume have a greater impact, which increases the ac
20 sembol ve 9 zaman diliminde nadir ve güçlü Cypher harmonik formasyonunu otomatik olarak tespit edin — Fibonacci ile doğrulanmış, yeniden çizilmeyen sinyaller doğrudan grafiğinize ve mobil cihazınıza iletilir. Cypher Formasyonu Nedir Cypher, sıkı Fibonacci ilişkilerini kullanarak yüksek olasılıklı fiyat dönüş bölgelerini tespit eden 5 noktalı bir XABCD harmonik yapısıdır. Cypher'ı tüm harmonik formasyonlar arasında benzersiz kılan şey,   C Noktası'nın XA bacağının 127,2%–141,4% ötesine uzanmas
This dynamic indicator allows you to measure retracements of price between any two points in either direction. It displays the price points, percentages and also displays the extension levels. User may Modify and Add addition levels and extensions." User may also Add multiple Fibonacci indicators on the chart and change their colors,   style and sizes. Can be used on any timeframe. This is the only Fibonacci Tool you'll need to measure and trade on Structure. MT5 Version Available as well (
Candle Pattern Sync
Suvashish Halder
3 (1)
Candle Pattern Sync is your ultimate tool for precision and insight in trading. Step into the future of trading with this innovative indicator that’s designed to help you understand market behavior by analyzing historical patterns and giving you an idea of what might come next. While the forecasts provide valuable probabilities based on history, they’re not guarantees – think of them as a powerful guide to inform your decisions, not a definitive answer. MT5 Version -  https://www.mql5.com/en/mar
Bu gösterge, ayrık Hartley dönüşümüne dayanmaktadır. Bu dönüşümü kullanmak, finansal zaman serilerini işlerken farklı yaklaşımlar uygulamanıza olanak tanır. Bu göstergenin ayırt edici bir özelliği, okumalarının grafikteki bir noktaya değil, gösterge döneminin tüm noktalarına atıfta bulunmasıdır. Bir zaman serisini işlerken gösterge, zaman serisinin çeşitli öğelerini seçmenize olanak tanır. İlk filtreleme olasılığı bu yaklaşım üzerine kuruludur - tüm gereksiz yüksek frekanslı bileşenler basitçe
MT4CandleTime index introduction MT4CandleTime is an indicator for the MT4 platform, which can display the remaining time of the current K line in the form of an intuitive digital countdown, which is convenient for traders to grasp the trading rhythm. Precise time control: The MT4CandleTime indicator provides traders with extremely accurate K-line remaining time data, enabling them to fine manage the time rhythm in the trading process, avoiding the hasty or delayed trading decisions caused by
Leave a review for this product, and receive another "Free" product that you choose. You can see my other products here: https://www.mql5.com/en/users/zakri/seller Harmonic Patterns Detector indicator draws harmonic patterns on chart. Harmonic patterns have a high hit-rate of around 80% and are excellent for trade entries. They are used as price reversal points. Some of them have a long history of usage and were created by famous traders like H. M. Gartley. Many harmonic patterns are included
The MT4 " DayLevelsSignalPro " indicator . Signal Indicator – generates the most accurate buy / sell signals . Noise filtering indicator  – reduces false signals . Signal information with a clear , understandable and visually convenient view . User- friendly graphical interface ( colors , sound notifications , customization options ) . - Generation of a breakdown signal for significant peaks of the Current day . - Generation of a signal for the breakdown of the previous Day 's Level - Generation
SignalFxPro Breakout — Non-Repainting Indicator Overview: The SignalFxPro Breakout is a non-repainting breakout arrow indicator designed to capture explosive price moves after consolidation. It automatically marks Buy (green arrow) and Sell (red arrow) signals directly on the chart, giving traders a clear and reliable visual cue for potential entries. Key Features Non-Repainting Logic – signals confirmed only on closed bars, ensuring reliability. Dynamic Breakout Detection – identifies
Volume Zone is a unique indicator that uses special algorithm to determine the volumes traded for the period. There are two features of the indicator, the volumes price and and volumes zone. The volume price give the level at the buyers and sells entered the market. The zones also serve a good support/resistance and also site for demand/supply areas. The indicator was mainly designed to trade GBPUSD but also be applied on other pairs. The indicator can used by both beginners and advance trades.
The Market Maker indicator focuses on key levels as minimum, maximum, opening and closing of important time frames. An attentive observation of these levels will enable you to identify the proper direction of the trend. On these levels the Market Makers try to make a very hunt of Stop Loss. We recommend to use Daily values on H1 chart, Weekly values on H4 chart and Monthly values on D1 charts. Use it setting all three time frames on the same chart and you will see that these levels will be a gre
The Squat is a function of the range of a given price bar and the volume, or TIC volume, that occurs while that range is being created. The basic idea is that high volume and little price movement indicate substantial support or resistance. The idea behind the approach to this indicator is to first look for likely Fibonacci support and resistance and then see if Squat manifests when that point is reached. The indicator determines one of the high probability patterns of DiNapoli. It does not re
Bu ürünün alıcıları ayrıca şunları da satın alıyor
Genesis Matrix Pro is a professional multi-timeframe trend detection indicator designed to help traders identify high-quality market alignment with clarity and structure. It combines 12 different technical indicators into one visual alignment matrix, allowing traders to quickly see when market conditions are bullish, bearish, or neutral. A signal is generated only when the selected strategies are aligned, helping reduce noise and improve decision-making. PLEASE CONTACT ME AFTER PURCHASE TO GET
Gann Made Easy
Oleg Rodin
4.83 (163)
Gann Made Easy , bay teorisini kullanarak ticaretin en iyi ilkelerine dayanan, profesyonel ve kullanımı kolay bir Forex ticaret sistemidir. WD Gann. Gösterge, Zararı Durdur ve Kâr Al Seviyeleri dahil olmak üzere doğru SATIN AL ve SAT sinyalleri sağlar. PUSH bildirimlerini kullanarak hareket halindeyken bile işlem yapabilirsiniz. Satın alma işleminden sonra, alım satım talimatlarını ve harika ek göstergeleri ücretsiz olarak almak için lütfen benimle iletişime geçin! Muhtemelen Gann ticaret yöntem
The Propfolio Master Suite is the ultimate all-in-one analytical workstation for professional traders. Combining the power of the Beat The Market Maker (BTMM) methodology, Smart Money Concepts (SND/Liquidity), and Advanced Volume Profile, this suite replaces multiple different indicators with one optimized engine. Monitor up to 14 pairs simultaneously from a single chart, instantly identify market cycles, and seamlessly map institutional footprints with the click of a button. The Command Center
Scalper Inside PRO
Alexey Minkov
4.74 (69)
Scalper Inside PRO Scalper Inside PRO is an intraday trend and scalping indicator for MetaTrader 4 that uses an exclusive algorithm to quickly detect market direction and key target levels. It automatically calculates entry, exit and multiple profit targets, and shows detailed performance statistics so you can see how different instruments and strategies performed. This helps you choose the most suitable trading instruments for the current market conditions. Additionally, you can easily integrat
M1 Sniper
Oleg Rodin
5 (23)
M1 SNIPER kullanımı kolay bir işlem göstergesi sistemidir. M1 zaman dilimi için tasarlanmış bir ok göstergesidir. Gösterge, M1 zaman diliminde scalping için bağımsız bir sistem olarak kullanılabilir ve mevcut işlem sisteminizin bir parçası olarak kullanılabilir. Bu işlem sistemi özellikle M1'de işlem yapmak için tasarlanmış olsa da, diğer zaman dilimleriyle de kullanılabilir. Başlangıçta bu yöntemi XAUUSD ve BTCUSD ticareti için tasarladım. Ancak bu yöntemi diğer piyasalarda işlem yaparken de ya
PRO Renko Sistemi, RENKO grafikleri ticareti için özel olarak tasarlanmış son derece hassas bir ticaret sistemidir. Bu, çeşitli ticaret araçlarına uygulanabilen evrensel bir sistemdir. Sistemi etkin piyasa sana doğru ters sinyallerine erişim hakkı denilen ses nötralize eder. Göstergenin kullanımı çok kolaydır ve sinyal üretiminden sorumlu tek bir parametreye sahiptir. Aracı, seçtiğiniz herhangi bir ticaret aracına ve renko çubuğunun boyutuna kolayca uyarlayabilirsiniz. Yazılımımla karlı bir
Auto Optimized Parabolic RSI: Gelişmiş 3D Momentum Motoru Çoğu perakende indikatörü, piyasa volatilitesi değiştiği an çöken statik girdilere dayandığı için başarısız olur. Auto Optimized Parabolic RSI, kendi matematiksel avantajını sürekli olarak yeniden hesaplayarak "indikatör körelmesi" (indicator decay) sorununu çözer ve kurumsal düzeyde kantitatif adaptasyonu doğrudan MT5 terminalinize getirir. Temel Avantaj: Özel Bellek İçi (In-Memory) 3D Optimizasyon   Standart otomatik optimize ediciler,
NAM Order Blocks
NAM TECH GROUP, CORP.
3.67 (3)
MT4 Multi-timeframe Order Blocks detection indicator. Features - Fully customizable on chart control panel, provides complete interaction. - Hide and show control panel wherever you want. - Detect OBs on multiple timeframes. - Select OBs quantity to display. - Different OBs user interface. - Different filters on OBs. - OB proximity alert. - ADR High and Low lines. - Notification service (Screen alerts | Push notifications). Summary Order block is a market behavior that indicates order collection
Öncelikle, bu Ticaret Aracının Non-Repainting, Non-Redrawing ve Non-Lagging Gösterge olduğunu vurgulamakta fayda var, bu da onu profesyonel ticaret için ideal hale getiriyor. Çevrimiçi kurs, kullanıcı kılavuzu ve demo. Akıllı Fiyat Hareketi Kavramları Göstergesi, hem yeni hem de deneyimli tüccarlar için çok güçlü bir araçtır. İleri ticaret fikirlerini, Inner Circle Trader Analizi ve Smart Money Concepts Ticaret Stratejileri gibi 20'den fazla kullanışlı göstergeyi bir araya getirerek bir araya g
Quants HL Break
Ferhat Mutlu
5 (2)
LH ve HL kesintilerini bulmak için saf fiyat eylemiyle yapılan gelişmiş hesaplama. Piyasada size büyük bir geri dönüş noktası verecektir.LH ve HL sinyalleri trengle çıkışları için de kullanılabilir. Koparma gerçekleştiğinde, güçlü bir geri dönüş olduğunu gösterir.Hareketli Ortalamalar için güzel bir filtre.Bunu trend göstergeleriyle kullanmanızı şiddetle tavsiye ederim. Destek ve direnç, arz talep göstergeleri için ekstra bir onay olarak kullanılabilir. Daha fazla ayrıntı aşağıdaki forex iş p
Dynamic Forex28 Navigator
Bernhard Schweigert
4.43 (7)
Dynamic Forex28 Navigator - Yeni Nesil Forex Ticaret Aracı. ŞU ANDA %49 İNDİRİM. Dynamic Forex28 Navigator, uzun zamandır popüler olan göstergelerimizin evrimidir ve üçünün gücünü tek bir göstergede birleştirir: Gelişmiş Döviz Gücü28 Göstergesi (695 inceleme) + Gelişmiş Döviz İMPULS ve UYARI (520 inceleme) + CS28 Kombo Sinyalleri (Bonus). Gösterge hakkında ayrıntılar https://www.mql5.com/en/blogs/post/758844 Yeni Nesil Güç Göstergesi Ne Sunuyor?  Orijinallerde sevdiğiniz her şey, şimdi yeni
PZ Harmonacci Patterns
PZ TRADING SLU
3.17 (6)
Trade smarter, not harder: Empower your trading with Harmonacci Patterns This is arguably the most complete harmonic price formation auto-recognition indicator you can find for the MetaTrader Platform. It detects 19 different patterns, takes fibonacci projections as seriously as you do, displays the Potential Reversal Zone (PRZ) and finds suitable stop-loss and take-profit levels. [ Installation Guide | Update Guide | Troubleshooting | FAQ | All Products  ] It detects 19 different harmonic pric
RFI levels PRO
Roman Podpora
5 (1)
Bu gösterge, fiyat dönüş noktalarını ve fiyat geri dönüş bölgelerini doğru bir şekilde gösterir.       Başlıca oyuncular   . Yeni trendlerin nerede oluştuğunu görüyorsunuz ve her işlem üzerinde kontrolü elinizde tutarak, azami hassasiyetle kararlar alıyorsunuz. TREND LINES PRO   göstergesiyle birlikte kullanıldığında maksimum potansiyelini ortaya koyar.  VERSION MT5 Göstergenin gösterdiği şey: Yeni bir trendin başlangıcında aktivasyonla birlikte tersine dönüş yapıları ve tersine dönüş seviyeler
Trend Catcher ind
Ramil Minniakhmetov
TREND YAKALAYICI GÖSTERGE Trend Yakalayıcı Gösterge, yazarın tescilli ve özelleştirilmiş uyarlanabilir trend analiz göstergelerinin bir kombinasyonunu kullanarak piyasa fiyat hareketlerini analiz eder. Kısa vadeli gürültüyü filtreleyerek ve temel momentum gücüne, volatilite genişlemesine ve fiyat yapısı davranışına odaklanarak gerçek piyasa yönünü belirler. Ayrıca, hareketli ortalamalar, RSI ve volatilite filtreleri gibi yumuşatma ve trend filtreleme özelleştirilmiş göstergelerinin bir kombina
Apollo SR Master , Destek/Direnç bölgelerinde alım satımı daha kolay ve güvenilir hale getiren özelliklere sahip bir Destek/Direnç göstergesidir. Gösterge, yerel fiyat zirvelerini ve diplerini tespit ederek Destek/Direnç bölgelerini herhangi bir gecikme olmadan gerçek zamanlı olarak hesaplar. Ardından, yeni oluşan Destek/Direnç bölgesini doğrulamak için, Destek/Direnç bölgesinin dikkate alınabileceğini ve gerçek bir SAT veya AL sinyali olarak kullanılabileceğini gösteren özel bir sinyal gösterir
Grabber System
Ihor Otkydach
5 (2)
Size mükemmel bir teknik gösterge olan Grabber’ı tanıtıyorum. Bu araç, kullanıma hazır bir “her şey dahil” işlem stratejisi olarak çalışır. Tek bir yazılım kodu içinde güçlü piyasa teknik analiz araçları, işlem sinyalleri (oklar), uyarı işlevleri ve push bildirimleri entegre edilmiştir. Bu göstergeyi satın alan herkes aşağıdaki hediyeleri ücretsiz olarak alır: Açık emirleri otomatik yönetmek için Grabber Yardımcı Aracı Kurulum, yapılandırma ve nasıl işlem yapılacağını adım adım anlatan video kıl
Advanced Supply Demand
Bernhard Schweigert
4.91 (300)
Özel Ticaret –%40 İndirim Yeni Başlayanlar veya Uzman Yatırımcılar İçin En İyi Çözüm! Bu gösterge, bir dizi özel özellik ve yeni bir formül içerdiği için benzersiz, yüksek kaliteli ve uygun fiyatlı bir işlem aracıdır. Bu güncelleme ile çift zaman dilimi bölgeleri gösterebileceksiniz. Sadece daha yüksek bir zaman dilimini değil, hem grafik zaman dilimini hem de daha yüksek zaman dilimini gösterebileceksiniz: İÇ İÇE GEÇMİŞ BÖLGELER GÖSTERİYOR. Tüm Arz Talep yatırımcıları buna bayılacak. :) Önem
GoldRush Trend Ok Sinyali GoldRush Trend Ok Sinyali göstergesi, XAU/USD'de yüksek hızlı, kısa vadeli scalperlar için özel olarak tasarlanmış hassas, gerçek zamanlı trend analizi sağlar. 1 dakikalık zaman dilimi için özel olarak tasarlanan bu araç, net giriş noktaları için yön okları gösterir ve scalper'ların değişken piyasa koşullarında güvenle hareket etmelerini sağlar. Gösterge, PRIMARY ve SECONDARY uyarı oklarından oluşur. PRIMARY sinyalleri, trend yönündeki değişikliği gösteren Beyaz ve
Introduction to Fractal Pattern Scanner Fractal Indicator refers to the technical indicator that makes use of the fractal geometry found in the financial market. Fractal Pattern Scanner is the advanced Fractal Indicator that brings the latest trading technology after the extensive research and development work in the fractal geometry in the financial market. The most important feature in Fractal Pattern Scanner is the ability to measure the turning point probability as well as the trend probabi
ŞU ANDA %40INDIRIMLI Yeni Başlayanlar veya Uzman Tüccarlar için En İyi Çözüm! Bu Gösterge benzersiz, yüksek kaliteli ve uygun fiyatlı bir ticaret aracıdır çünkü bir dizi tescilli özellik ve yeni bir formül ekledik. Sadece BİR grafik ile 28 Forex çifti için Döviz Gücünü okuyabilirsiniz! Yeni bir trendin veya scalping fırsatının tam tetik noktasını belirleyebildiğiniz için ticaretinizin nasıl gelişeceğini hayal edin? Kullanım kılavuzu: buraya tıklayın Bu ilk olan, orijinal! Değersiz bir özent
Cycle Sniper
Elmira Memish
4.39 (36)
Please contact us after your purchase and we will send you the complimentary indicators to complete the system Cycle Sniper is not a holy grail but when you use it in a system which is explained in the videos, you will feel the difference. If you are not willing to focus on the charts designed with Cycle Sniper and other free tools we provide, we recommend not buying this indicator. We recommend watching the videos about the indiactor and system before purchasing. Videos, settings  and descri
Market Structure Patterns MT4
Samuel Manoel De Souza
5 (18)
Market Structure Patterns ,   smart money concepts   (akıllı para kavramları) temelinde geliştirilen ve   SMC/ICT   öğelerini grafik üzerinde gösteren bir göstergedir. Bu öğeler, işlem kararlarınızı bir üst seviyeye taşımanıza yardımcı olur. Grafikte bir unsur oluştuğunda, fiyat bir seviyeyi geçtiğinde veya bir kutu/bölgeye girdiğinde,   uyarılar ,   bildirimler   ve   e-posta mesajları   aracılığıyla anında bilgilendirilirsiniz. Geliştiriciler,   global variables   (küresel değişkenler) aracılı
Advanced UT BOT ALERTS for MT4 Profesyonel Çok Katmanlı Trend Tespit Sistemi | Geliştirilmiş UT BOT Motoru Yalnızca yüksek kaliteli göstergeler sunuyoruz. Advanced UT BOT , profesyonel kullanım için tasarlanmıştır. Kararlı sinyal mantığı ve güvenli hesaplama yapısı sayesinde gecikme veya hatalı güncelleme olmaz. Geçmiş sinyalleri yeniden çizmez, değiştirmez veya silmez. Tüm BUY ve SELL sinyalleri mum kapanışı gerçekleştikten sonra oluşturulur ve sabitlenir. Canlı işlem sırasında repaint yoktur
Bu göstergeye dayalı bonus EA'yı almak için satın aldıktan sonra benimle iletişime geçin. Self Optimizing Double MA Strategy, parametre tahminlerini ortadan kaldırmak için tasarlanmış profesyonel düzeyde bir ticaret aracıdır. Yerleşik bir otomatik optimizasyon motoruyla desteklenen bu sistem, istatistiksel bir avantajı korumak için arka planda binlerce parametre kombinasyonunu simüle ederek değişen piyasa koşullarına sürekli olarak uyum sağlar. Statik ve güncelliğini yitirmiş ayarlara güvenmek
Day Trader Master , günlük tüccarlar için eksiksiz bir ticaret sistemidir. Sistem iki göstergeden oluşmaktadır. Bir gösterge, satın almak ve satmak için bir ok işaretidir. Aldığınız ok göstergesidir. Size ikinci göstergeyi ücretsiz olarak sağlayacağım. İkinci gösterge, bu oklarla birlikte kullanılmak üzere özel olarak tasarlanmış bir trend göstergesidir. GÖSTERGELER TEKRARLAMAYIN VE GEÇ KALMAYIN! Bu sistemi kullanmak çok basittir. İki renkli bir çizgi olarak görüntülenen mevcut trend yönündeki o
Candle Power Pro
Thushara Dissanayake
4.5 (8)
The       Mum Gücü Pro       çözmek için tasarlanmış sofistike bir ticaret aracıdır       gerçek hacim baskısı, kene verisi dengesizlikleri ve kurumsal sipariş akışı dinamikleri       ölçerek       Boğa keneleri ile ayı keneleri arasındaki savaş       gerçek zamanlı olarak. Bu gösterge ham verileri dönüştürür       hacim verilerini eyleme dönüştürülebilir içgörülere dönüştürerek   , yatırımcıların       Akıllı Para hareketleri, likidite avları ve gizli piyasa psikolojisi       her fiyat mumunun
Eğer Forex piyasasında işlem yapıyorsanız, döviz gücü ve döviz çiftleri arasındaki korelasyon hakkında ayrıntılı bilgi sahibi olmak, işlem performansınızı yeni bir seviyeye taşıyabilir. Korelasyon, riskinizi yarıya indirmenize yardımcı olurken, güç analizi kârınızı maksimize etmenizi sağlar. Bu gösterge, döviz gücü analizi ile döviz çiftleri korelasyonunu birleştirerek en uygun döviz çiftlerini seçmek için hibrit bir yaklaşım sunar. Döviz Gücü Analizi Nasıl Kullanılır Örneğin, işlem stratejiniz
CRT Candle Range Theory HTF MT4.   Ultimate CRT Indicator: Advanced ICT Concepts and Malaysian SnR Trading System Discounted   Price   $50  !!     Secure your lifetime access   now   before it switches to   subscription-only ! Master the Market Maker's Footprints with the Most Advanced Candle Range Theory Indicator Unlock the true power of   Smart Money Concepts (SMC)   and trade precisely like the institutions with the   Ultimate CRT Indicator . Built exclusively for serious traders, this indic
Route Lines Prices - fiyat yönlerini bulmak için tasarlanmış bir göstergedir. Basit arayüzü, fiyat davranışı ve gelecekteki yön hesaplamaları için birden fazla algoritma içerir. Bu algoritmalar, kullanılan zaman dilimlerine bağlı olarak volatilite hesaplamalarını ve fiyat düzeltmesini içerir. Gösterge, " Calculating price values " değerini değiştirmek için tek bir parametreye sahiptir. Varsayılan 1 değeri, dengeli bir otomatik hesaplama sağlar, bu da göstergeyi manuel olarak yapılandırmadan kul
KURAMA GOLD SIGNAL PRO (MT4) — 7 Katmanlı Filtre, Otomatik TP/SL ve Kalite Puanı ile Komple XAUUSD Trading Sistemi REPAINT YOK. YENİDEN ÇİZİM YOK. GECİKME YOK. Her sinyal kalıcıdır. Gördüğün, aldığındır. BONUS: Ömür boyu lisansı al ve AI Zone Radar ($59 değerinde) + tam PDF kılavuzunu ÜCRETSİZ al. Satın aldıktan sonra bana mesaj gönder. AI Zone Radar: https://www.mql5.com/en/market/product/175834 TRADERLAR GÜVENİYOR: Aktif bir Altın trader topluluğu tarafından zaten kullanılıyor. Hassasiyet
Yazarın diğer ürünleri
ADX arrow
Pavel Shutovskiy
5 (1)
ADX arrow The indicator displays crossings of the ADX indicator (Average Directional Movement Index) lines as dots simplifying detection of signals. The indicator also features pop-up and email alerts. Parameters Period - averaging period. Apply to - applied price: Open, Close, High, Low, Median, (high+low)/2, typical, (high+low+close)/3, weighted Close, (high+low+close+close)/4. Alert - enable/disable pop-up alerts. EMail - enable/disable email alerts.
OsMA Arrow MTF
Pavel Shutovskiy
3.9 (10)
The indicator displays crossing zero level by Moving Average of Oscillator (OsMA) in the form of arrows. The this is a multi-timeframe indicator, and it displays signals from other timeframes. The indicator notifies about a signal by means of a pop-up Alert window, or sending notification to e-mail. Parameters Time-frame - select timeframe to show indicator signals. Fast EMA Period - fast EMA. This is an exponential moving average from a price with a short period. Slow EMA Period - slow EMA. Th
FREE
OsMA Arrow
Pavel Shutovskiy
3.83 (6)
The indicator displays crossing zero level by Moving Average of Oscillator (OsMA) in the form of arrows. The indicator notifies about a signal by means of a pop-up Alert window, or sending notification to e-mail. Parameters Fast EMA Period - fast EMA. This is an exponential moving average from a price with a short period. Slow EMA Period - slow EMA. This is also an exponential moving average of a market price but with a longer period. Signal SMA Period - MACD SMA. This is a signal line which is
FREE
The indicator displays trend reversal in the form of arrows. The indicator does not change its values (is not redrawn) after a signal. The program notifies about arrows by means of a pop-up window, or sending notification to e-mail. This is a multitimeframe instrument. Values of the indicator may be displayed from higher timeframes. Parameters Time-frame - select time session; zero is the current timeframe (Time-frame cannot be lower than the current time interval). Bars - number of bars on the
AD Trend line
Pavel Shutovskiy
5 (1)
AD Trend line draws trend lines on the basis of A/D indicator (Accumulation/Distribution). When A/D indicator breaks a trend line, the probability of the trend reversal is very high. This is a multitimeframe indicator which can display values from higher timeframes. Parameters Time-frame — Select a timeframe; zero is the current timeframe of the chart; Trend Line — Display lines on the chart; Apply to — Apply lines to close the candle's highest/lowest value; Width line — Width of the line; Style
FREE
AC Arrow
Pavel Shutovskiy
4 (2)
The indicator displays zero level Accelerator Oscillator (AC) crossover in the form of dots on the chart. In indicator settings one can specify number of bars in the history to display signals, as well as shift of dots with respect to a bar. Parameters Bars — number of bars in the history to display indicator's signals; Shift — shift of dots with respect to bars.
FREE
Fibo
Pavel Shutovskiy
5 (2)
The script sets Fibonacci levels on the chart using maximums and minimums visible on the chart. The script names Fibo with such timeframe on which it has been launched (Fibo D1 or Fibo M30, etc.), therefore preserving previously constructed levels on different time charts. This instrument will be useful for those who start studying Fibonacci levels and those who need to form these levels in a speedy fashion. The script does not have additional settings. Fibonacci lines can be amended in standard
FREE
MA 2 Histogram
Pavel Shutovskiy
4.5 (2)
The indicator is based on two Moving Averages. Its only difference from traditional indicators is that it is presented as a histogram. The histogram has four colors; each color represents a MA with its own period. In case of a descending trend, if a price is lower than a moving average, the indicator displays a value lower than the red zero level. In case of ascending trend, the indicator value is higher than the green zero level. Parameters: Period MA 1 - Period of the first moving average. MA
FREE
Beacon
Pavel Shutovskiy
5 (2)
The indicator determines overbought/oversold zones on various timeframes. Arrows show market trend in various time sessions: if the market leaves the overbought zone, the arrow will indicate an ascending trend (arrow up), if the market leaves the oversold zone, the arrow will indicate a descending trend (arrow down). Situation on the timeframe, where the indicator is located, is displayed in the lower right window. Information on the market location (overbought or oversold zone), as well as the
FREE
Trend following
Pavel Shutovskiy
4.5 (2)
The EA in the form of histogram displays up and down trends. This tool is recommended to be used as a filter. Its readings will help to detect beginning, end, and continuation of a trend. This additional tool will suit any trading system. Parameters Period — indicator period; Bars — number of bars on the history.
FREE
Maps
Pavel Shutovskiy
4.75 (4)
The indicator displays on the chart a map, on which markers show the current trading session, as well as shows a text. The indicator provides two types of background display: white and black. The indicator is displayed as the background and does not hinder tracking the current market situation. Parameters: GMT -  the time difference of the terminal and GMT. Background - selection of background - black or white.
FREE
Any chart has patterns of consolidation which are also called accumulation patterns. These are sections where the market has been on the same price level during significant amount of time, and thus it was accumulating positions. After such accumulation, positions are distributing, and the market passes from flat into trend. The Consolidation Levels indicator is a professional tool which identifies these sections and builds levels according to the price of the market at the moment of consolidatio
ATR Pivot
Pavel Shutovskiy
The indicator calculates the levels by ATR daily range using the equations: 1AR = Open + ATR -1AS = Open - ATR AR 1/2 = Open + (ATR / 2) AS -1/2 = Open - (ATR / 2) AR 1/4 = Open + (ATR / 4) AS -1/4 = Open - (ATR / 4) AR 3/4 = Open + ((ATR*3) / 4) AS -3/4 = Open - ((ATR*3) / 4) AR 2 = Open + (ATR*2) AS -2 = Open - (ATR*2) Parameters Period ATR - ATR period Shift time - shift by time for Open Color opening of day - Open line color Color 1AR, -1AS - 1AR, -1AS line color Color AR 1/2, AS -1/2 - AR 1
AO AC Signal
Pavel Shutovskiy
The indicator displays signals of different indicators (which can be selected in parameters) on a chart when zero level is crossed. AO, AC or AO+AC if signals of two indicators coincide. The indicator shows an Alert message (pop-up window) when a signal appears. Parameters: Indicators - Selection of the indicator AO, AC, AO+AC. Bars - Number of bars in history for display of signals. Alert - Pop-up window in case of a signal.
Beginning
Pavel Shutovskiy
The indicator builds levels from beginning of a week or a month, or according to local Highs and Lows. These levels are meant for detection of strong support and resistance levels on a chart. Most big players of the market are guided by particularly these data: opening of the week or opening of the month. Breakout of one or several Highs and price consolidation on these levels suggest that market intends to grow. Breakout of Lows and price consolidation bears evidence of market's intention to mo
F trend
Pavel Shutovskiy
The indicator is designed for scalping fans, it gives signals of an average of ten pips. The indicator is based on mathematical calculation, it determines the average range of the price channel, which is generally formed at the time of accumulation of positions. Once the price moves beyond its borders, a signal is generated in the form of an arrow. The indicator has a minimum of settings: the period for which you need to calculate, and the frequency of signals (the signal frequency is determined
Woltec
Pavel Shutovskiy
4 (1)
The indicator has been developed for scalping. The indicator is based on a mathematical calculation that determines the percent range of the price channel, which is generally formed at the time of the accumulation of positions. Once the price moves beyond its borders, a signal is generated in the form of dots. The indicator has a minimum of settings - the frequency of signals. Smaller values produce more signals. Parameters: Multiplier - the frequency of signals (with lower values signals are m
Jaguar tac
Pavel Shutovskiy
The indicator uses the Envelopes channel in its calculations, which allows working with dynamic support and resistance levels. It also considers the direction and strength of the trend, as well as the mathematical calculation that determines the percent range of the price channel, which is generally formed at the time of the accumulation of positions. It first generates a preliminary signal in the form of a round arrow. Then it is necessary to wait for a normal arrow and enter the market only af
ADX trend
Pavel Shutovskiy
This indicator displays the signals of the ADX indicator (Average Directional Movement Index) as points on the chart. This facilitates the visual identification of signals. The indicator also features alerts (pop-up message boxes) and sending signals to e-mail. Parameters Period - averaging period. Apply to - price used for calculations: Close, Open, High, Low, Median (high+low)/2, Typical (high+low+close)/3, Weighted Close (high+low+close+close)/4. Alert - enable/disable alerts. EMail - enable
Strategy Builder
Pavel Shutovskiy
5 (1)
Strategy Builder Strateji Oluşturucu göstergesi, grafiği çok sayıda göstergeyle yüklemeden ve gerçek sinyali tanımlamak için birçok farklı göstergeyi izlemeden klasik ve bireysel stratejiler oluşturmanıza olanak tanır. Strateji Oluşturucu, 30 standart göstergede, klasik ve gizli sapma gösteren 23 göstergede, Fibonacci seviyelerinden, yatay, trend çizgilerinden ve dikdörtgenden sinyal alan oklar şeklinde sinyaller görüntüler. Bu göstergenin yardımıyla, ayarlarda filtre olarak ana ve yardımcı gös
ADX arrow N
Pavel Shutovskiy
ADX arrow Bu gösterge, ADX göstergesinin sinyallerini (Ortalama Yön Hareket İndeksi) grafikte nokta olarak görüntüler. Bu, sinyallerin görsel olarak tanımlanmasını kolaylaştırır. Göstergede ayrıca uyarılar (açılır mesaj kutuları) ve e-postaya sinyal gönderme bulunur. Parametre: Period  - ortalama süresi. Apply to  - hesaplamalar için kullanılan fiyat: Close, Open, High, Low, Median (high+low)/2, Typical (high+low+close)/3, Weighted Close (high+low+close+close)/4. Alert  - uyarıları etkinleşt
ATR Pivots
Pavel Shutovskiy
The indicator calculates intraday levels based on the average daily price range, builds support and resistance levels that may be reversal. Parameters Period ATR - period of the ATR indicator Shift time - time offset for the opening of the day Color opening of day - color of the opening line of the day Color 1AR, -1AS - line color 1AR, -1AS Color AR 1/2, AS -1/2 - line color AR 1/2, AS Color AR 1/4, AS -1/4 - line color AR 1/4, AS -1/4 Color AR 3/4, AS -3/4 - line color AR 3/4, AS -3/4 Color
Filtrele:
Maksym Mudrakov
30050
Maksym Mudrakov 2016.08.31 11:30 
 

Kullanıcı değerlendirmeye herhangi bir yorum bırakmadı

Değerlendirmeye yanıt