Max Min Levels

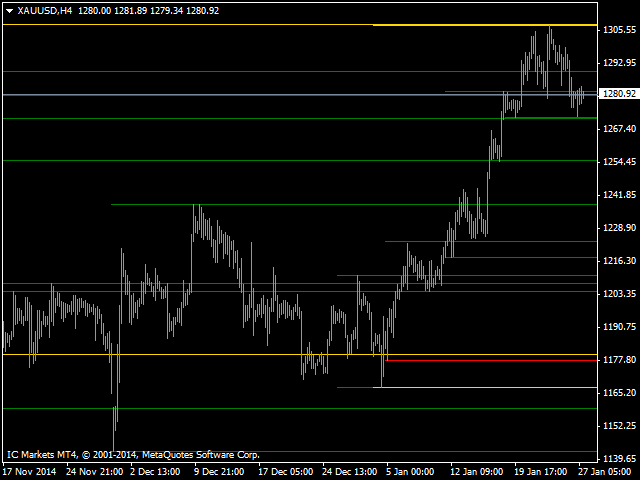
The indicator makes levels according to local maximums and minimums of a week, a month, or a year.

Parameters:

  • Week number - number of weeks for lines display
  • Week level color - Week line color
  • Month number - number of months for lines display
  • Month level color - Month line color
  • Year number - number of years for lines display
  • Year level color - Year line color
  • Width line - Width of lines
  • Style line - Style of lines
Prodotti consigliati
Market Profile with Dashboard Indicator - Complete User Guide indicator Overview The Market Profile with Dashboard is a comprehensive trading analysis tool for MetaTrader 4 that displays market profile data, volume analysis, and key market structure information directly on your chart. This indicator helps traders identify significant price levels, market balance areas, and potential trading opportunities based on market profile theory. Core Components and Features Market Profile Display - Sh
Features: Sharkfin Alerts Multi-timeframe Multi-currency SM TDI: To show TDI lines with sharkfin levels Zigzag MTF: To see Higher Timeframe trend Detailed blog post and extras: https://www.mql5.com/en/blogs/post/759138 Arrows works on a single timeframe and single currency. But it’s visually helps see that sharkfins. You can also get the simple arrows from mql5 site product: https://www.mql5.com/en/market/product/42405 About Scanner: It is an easy to use simplified scanner. It will show when
Indicators 14 in 1
Makarii Gubaydullin
5 (1)
14 indicatori e strumenti ausiliari per un trading conveniente Questa utility contiene 14 strumenti aggiuntivi che possono essere utili per determinate azioni del trader,   semplificando e accelerando così il processo di trading. Dai un'occhiata al mio  #1 Trade Manager : include 66+ funzioni e indicatori  |   Contattami  se hai domande A causa delle diverse risoluzioni dei monitor, alcuni utenti potrebbero riscontrare che le etichette vengono visualizzate in sovrapposizione o troppo piccole. Se
Renko On Chart
Mikhail Zhitnev
1 (1)
You can now use the conventional price charts to display Renko bars. This indicator can send dialog boxes with alerts, push notifications to mobile devices and emails. You can easily use this indicator to create Expert Advisors, because the indicator uses buffers. Indicator parameters Renko size, points - size of Renko bars Arrows gap, points - distance to the signal arrows Alerts - true/false - use pop-up alerts when signals appear Push notifications - send Push notifications to the mobile ter
Divergence dashboard
Jan Flodin
4.64 (11)
I recommend you to read the   product's blog  (manual) from start to end so that it is clear from the beginning what the indicactor offers. This multi time frame and multi symbol divergence dashboard indicator sends an alert when one or two different divergences have been identified. It can be used with all time frames from M1 to MN. It is possible to enable moving average or RSI trend filter to filter out only the strongest setups. It should be combined with your own confirmation rules, techni
The Market Structures Pro indicator finds and displays 5 (five) patterns of the Smart Money Concepts (SMC) system on the chart, namely: Break Of Structures (BoS)       Change of character (CHoCH) Equal Highs & Lows Premium, Equilibrium and Discount zones with Fibo grid High-high, Low-low, High-low and Low-high extremes Patterns are displayed for two modes - Swing and Internal and are easily distinguished by color on the chart. Internal mode features higher contrast colors, finer lines, and smal
Rectangle Trading Custom   is a powerful technical analysis tool designed for price action and range-based traders. It allows users to define consolidation zones and receive alerts when the price breaks out of these zones or approaches trendlines drawn on the chart. Rectangles and Trendlines will be extended into future with one click. Rectangle point size, name and prices will be displayed around rectangle. Key Features: Draw Trading Zones (Rectangle Zones) Users can manually draw rectangles t
Market Noise Il rumore del mercato è un indicatore che determina le fasi del mercato su un grafico dei prezzi e distingue anche i movimenti di tendenza chiari e fluidi dai movimenti piatti e rumorosi quando si verifica una fase di accumulazione o distribuzione. Ogni fase è adatta al proprio tipo di trading: trend per i sistemi trend-following e flat per quelli aggressivi. Quando inizia il rumore del mercato, puoi decidere di uscire dalle operazioni. Allo stesso modo, e viceversa, non appena il
Ska ZigZag BuySell
NKATEKO VUKOSI LEROY MASANGO
Ska ZigZag BuySell indicator determines the overbought and oversold regions within a trend. The indicator determines the overbought region by the candlestick high and the oversold region by the candlestick low. This indicator only gives signals with arrow and audible alerts each and every time when a new candlestick appear. To utilize the full strategy i recommend using "Ska ZigZag BuySell" together with "Ska ZigZag Line". The Ska ZigZag Line indicator is available for free. NOTE: Indicator is h
Qv2 Stdev
Joao Marcilio
Qv² Stdev is indicator developed based on standard deviation of prices and trading volume. Buy signals are indicated by arrows up. Sell signals are indicated by arrows down. An important detail is that the Qv² Volume has two bands, an upper and a lower, both of which serve as a target for take profit. It is recommended to use it in H1 Can be used in all pairs (I use in Gold). Good Business, in the trending market To find out some more about my work please click here
Trend Rever
Vitalii Zakharuk
The Trend Rever indicator uses two lines of different colors to display buy or sell signals. The first of these lines is red and the second is blue. When changing the color of the lines, an arrow is also displayed, which indicates which deal to open, buy or sell. A simple but effective system for determining the Forex trend. The algorithm takes into account the measurement of prices, and this method also focuses on the measurement of each of the price drops - which gives more detailed informati
Cloud Power
Andriy Sydoruk
Implementation of indication of trend movement with moments for potential stops in the Cloud Power indicator. The transition to the shadow warns of a possible reversal. The entry of the price inside the shadow speaks of a flat movement. The indicator tracks the market trend with unmatched reliability, ignoring sharp market fluctuations and noise around the average price. Simple, visual and efficient use. The indicator does not redraw and does not lag. It can be easily used as an independent t
This indicator is used to indicate the difference between the highest and lowest prices of the K line, as well as the difference between the closing price and the opening price, so that traders can visually see the length of the K line. The number above is the difference between High and Low, and the number below is the difference between Close and Open. This indicator provides filtering function, and users can only select K lines that meet the criteria, such as positive line or negative lin
Open close levels Open close levels -  is an indicator for MetaTrader 4, which displays High/Low, Open/Close, ATR levels  (set manually) of the day, week, month on the chart. Marks round levels, signs the days of the week, numbers every week. All levels are marked with price tags with a price symbol. Also, the indicator automatically calculates and displays on the chart the distance that the price has passed from High to Low and from Open to Close by day, week and month. The indicator displays
NO REPAINT ADVANCED CHART PATTERN INDICATOR By definition, a price ( chart)  pattern is a recognizable configuration of price movement that is identified using a series of  trendlines  and/or curves. When a price pattern signals a change in trend direction, it is known as a reversal pattern; a continuation pattern occurs when the trend continues in its existing direction following a brief pause. Advanced Chart Pattern Tracker is designed to find the MOST ACCURATE patterns. A special script is a
Multicurrency indicator Any chart obs is a price chart with a percentage scale. Can be displayed as a line and as a histogram. There is also a reverse function available, it mirrors the chart. The name of an instrument to be displayed is specified in the input parameters, the current symbol is used on default. The indicator doesn't have lags as it is not smoothed with any formulas, but bound to a percentage scale, what allows detecting the price equilibrium, the overbought and oversold state. Th
Muvi2A
Mikhail Bilan
Similarly with sales. Additionally, the indicator contains a buy or sell signal in the form of arrows.  Power type indicator.  Test it in a tester to make sure that it works. It is important to select settings depending on the volatility of the asset. Good for scalping and long-term trading. Lots of settings. The most interesting thing is the ability to set in the indicator for moving on timeframes from 1 minute on the timeframes of the main chart. The signals become even more accurate) It
This indicator is meant for Harmonic Traders, it helps them in identifying the formed patterns by analyzing the market past data, looking for Harmonic Patterns. The Patterns that this indicator can detect are: AB=CD Butterfly Gartely Crab Bat The indicator shows the following: The completed pattern, with the critical zone highlighted in Gray box The suggested 3 take profit levels (in green) The Suggested Stop Loss level (in Red) The formed pattern ratios can be checked by hovering the mouse on t
VWAP pro
Mikhail Nazarenko
VWAP   (Value Weighted Average Price)   is an indicator of market makers and banks. It is used by professional traders for intraday, weekly and long-term trading. If you are not familiar with it yet, it is high time to figure it out. How does VWAP work? VWAP shows the volume-weighted average price over a certain period. Its calculation takes into account both the price change and the volume of transactions in each candle. Candles with a higher volume have a greater impact, which increases the ac
This dynamic indicator allows you to measure retracements of price between any two points in either direction. It displays the price points, percentages and also displays the extension levels. User may Modify and Add addition levels and extensions." User may also Add multiple Fibonacci indicators on the chart and change their colors,   style and sizes. Can be used on any timeframe. This is the only Fibonacci Tool you'll need to measure and trade on Structure. MT5 Version Available as well (
Candle Pattern Sync
Suvashish Halder
3 (1)
Candle Pattern Sync is your ultimate tool for precision and insight in trading. Step into the future of trading with this innovative indicator that’s designed to help you understand market behavior by analyzing historical patterns and giving you an idea of what might come next. While the forecasts provide valuable probabilities based on history, they’re not guarantees – think of them as a powerful guide to inform your decisions, not a definitive answer. MT5 Version -  https://www.mql5.com/en/mar
Questo indicatore si basa sulla trasformata discreta di Hartley. L'utilizzo di questa trasformazione consente di applicare approcci diversi durante l'elaborazione di serie temporali finanziarie. Una caratteristica distintiva di questo indicatore è che le sue letture si riferiscono non a un punto del grafico, ma a tutti i punti del periodo dell'indicatore. Durante l'elaborazione di una serie storica, l'indicatore consente di selezionare vari elementi della serie storica. La prima possibilità di
Mega Dashboard MT4
Paul Anscombe
4.71 (7)
The Ultimate Dashboard Save $10 now - normal price $79 Indicators are useful for traders, but when you put them into a dashboard that can scan 28 symbols at once they become even better, and when you can also combine different indicators and timeframes to give you synchronized alerts, then they become awesome. This easy to use dashboard provides you with 23 leading indicators, use them individually or together, to create powerful combination alerts. So when you want to know that RSI is above 2
MT4CandleTime index introduction MT4CandleTime is an indicator for the MT4 platform, which can display the remaining time of the current K line in the form of an intuitive digital countdown, which is convenient for traders to grasp the trading rhythm. Precise time control: The MT4CandleTime indicator provides traders with extremely accurate K-line remaining time data, enabling them to fine manage the time rhythm in the trading process, avoiding the hasty or delayed trading decisions caused by
Leave a review for this product, and receive another "Free" product that you choose. You can see my other products here: https://www.mql5.com/en/users/zakri/seller Harmonic Patterns Detector indicator draws harmonic patterns on chart. Harmonic patterns have a high hit-rate of around 80% and are excellent for trade entries. They are used as price reversal points. Some of them have a long history of usage and were created by famous traders like H. M. Gartley. Many harmonic patterns are included
King Trend Pro
Nguyen Cong Hoan
Key Features: Instant BUY/SELL Signals with clear entry levels 3 Take Profit Levels (TP1, TP2, TP3) – customize your risk/reward Dynamic Stop Loss based on market structure Trendline Breakout Logic – detects breakout confirmation automatically Real-time Signal Notifications (alerts, emails, push notifications) Works on all timeframes (M5 to D1 recommended) Compatible with all Forex pairs, gold, indices, and crypto How it works: Wait for a BUY or SELL signal based on trendline break
DayLevelsSignalPro
Vladimir Chebonenko
The MT4 " DayLevelsSignalPro " indicator . Signal Indicator – generates the most accurate buy / sell signals . Noise filtering indicator  – reduces false signals . Signal information with a clear , understandable and visually convenient view . User- friendly graphical interface ( colors , sound notifications , customization options ) . - Generation of a breakdown signal for significant peaks of the Current day . - Generation of a signal for the breakdown of the previous Day 's Level - Generation
Volume Zone is a unique indicator that uses special algorithm to determine the volumes traded for the period. There are two features of the indicator, the volumes price and and volumes zone. The volume price give the level at the buyers and sells entered the market. The zones also serve a good support/resistance and also site for demand/supply areas. The indicator was mainly designed to trade GBPUSD but also be applied on other pairs. The indicator can used by both beginners and advance trades.
The Market Maker indicator focuses on key levels as minimum, maximum, opening and closing of important time frames. An attentive observation of these levels will enable you to identify the proper direction of the trend. On these levels the Market Makers try to make a very hunt of Stop Loss. We recommend to use Daily values on H1 chart, Weekly values on H4 chart and Monthly values on D1 charts. Use it setting all three time frames on the same chart and you will see that these levels will be a gre
The Squat is a function of the range of a given price bar and the volume, or TIC volume, that occurs while that range is being created. The basic idea is that high volume and little price movement indicate substantial support or resistance. The idea behind the approach to this indicator is to first look for likely Fibonacci support and resistance and then see if Squat manifests when that point is reached. The indicator determines one of the high probability patterns of DiNapoli. It does not re
Gli utenti di questo prodotto hanno anche acquistato
Attualmente 20% di sconto! La soluzione migliore per ogni principiante o trader esperto! Questo software per cruscotti funziona su 28 coppie di valute. Si basa su 2 dei nostri indicatori principali (Advanced Currency Strength 28 e Advanced Currency Impulse). Offre un'ottima panoramica dell'intero mercato Forex. Mostra i valori di forza delle valute avanzate, la velocità di movimento delle valute e i segnali per 28 coppie Forex in tutti i (9) timeframe. Immaginate come migliorerà il vostro tra
Gann Made Easy
Oleg Rodin
4.83 (150)
Gann Made Easy è un sistema di trading Forex professionale e facile da usare che si basa sui migliori principi del trading utilizzando la teoria di mr. WD Gann. L'indicatore fornisce segnali ACQUISTA e VENDI accurati, inclusi i livelli di Stop Loss e Take Profit. Puoi fare trading anche in movimento utilizzando le notifiche PUSH. CONTATTATEMI DOPO L'ACQUISTO PER RICEVERE CONSIGLI DI TRADING, BONUS E L'ASSISTENTE EA GANN MADE EASY GRATUITAMENTE! Probabilmente hai già sentito parlare molte volte d
M1 Sniper
Oleg Rodin
4.89 (18)
M1 SNIPER è un sistema di indicatori di trading facile da usare. Si tratta di un indicatore a freccia progettato per l'intervallo temporale M1. L'indicatore può essere utilizzato come sistema autonomo per lo scalping sull'intervallo temporale M1 e come parte del tuo sistema di trading esistente. Sebbene questo sistema di trading sia stato progettato specificamente per il trading sull'intervallo temporale M1, può comunque essere utilizzato anche con altri intervalli temporali. Inizialmente ho pro
Scalper Inside PRO
Alexey Minkov
4.74 (69)
An exclusive indicator that utilizes an innovative algorithm to swiftly and accurately determine the market trend. The indicator automatically calculates opening, closing, and profit levels, providing detailed trading statistics. With these features, you can choose the most appropriate trading instrument for the current market conditions. Additionally, you can easily integrate your own arrow indicators into Scalper Inside Pro to quickly evaluate their statistics and profitability. Scalper Inside
Smc Blast Signal
Mohit Dhariwal
5 (2)
CHRISTMAS SALE OFFER PRICE AT JUST 70 DOLLARS FEW COPIES ONLY From 25TH DECEMBER -27th December MIDNIGHT GRAB YOUR COPY ON THIS CHRISTMAS EVE SMC Blast Signal with FVG, BOS and trend Breakout The SMC Blast Signal  is a  Precise trading system for Meta Trader 4 that uses Smart Money Concepts (SMC) , including Fair Value Gaps (FVG) and Break of Structure (BOS) , to identify high-probability trades. It incorporates a Trend Filter using a higher timeframe moving average, ensuring trades align with
Dynamic Forex28 Navigator
Bernhard Schweigert
4.43 (7)
Dynamic Forex28 Navigator - Lo strumento di trading Forex di nuova generazione. ATTUALMENTE SCONTATO DEL 49%. Dynamic Forex28 Navigator è l'evoluzione dei nostri indicatori popolari di lunga data, che combinano la potenza di tre in uno: Advanced Currency Strength28 Indicator (695 recensioni) + Advanced Currency IMPULSE con ALERT (520 recensioni) + CS28 Combo Signals (Bonus). Dettagli sull'indicatore https://www.mql5.com/en/blogs/post/758844 Cosa offre l'indicatore di forza di nuova generazione?
Apollo SR Master è un indicatore di Supporto/Resistenza con caratteristiche speciali che rendono il trading con le zone di Supporto/Resistenza più semplice e affidabile. L'indicatore calcola le zone di Supporto/Resistenza in tempo reale senza alcun ritardo, rilevando i massimi e i minimi dei prezzi locali. Quindi, per confermare la nuova area SR formata, l'indicatore mostra un segnale speciale che segnala che la zona SR può essere presa in considerazione e utilizzata come un vero e proprio segna
Trend Screener
STE S.S.COMPANY
4.79 (95)
Indicatore di tendenza, soluzione unica rivoluzionaria per il trading di tendenze e il filtraggio con tutte le importanti funzionalità di tendenza integrate in un unico strumento! È un indicatore multi-timeframe e multi-valuta al 100% non ridipingibile che può essere utilizzato su tutti i simboli/strumenti: forex, materie prime, criptovalute, indici e azioni. OFFERTA A TEMPO LIMITATO: l'indicatore di screening di supporto e resistenza è disponibile a soli 50$ e a vita. (Prezzo originale 250$) (o
Advanced Supply Demand
Bernhard Schweigert
4.91 (296)
Christmas Trading Special –50% OFF ! Best Solution for any Newbie or Expert Trader! This indicator is a unique, high quality and affordable trading tool because we have incorporated a number of proprietary features and a new formula. With this update, you will be able to show double timeframe zones. You will not only be able to show a higher TF but to show both, the chart TF, PLUS the higher TF: SHOWING NESTED ZONES. All Supply Demand traders will love it. :) Important Information Revealed Maxim
SMC Easy Signal
Mohamed Hassan
4.73 (15)
3 copies left at $65, next price is $120 SMC Easy Signal was built to remove the confusion around the smart money concept by turning structural shifts like BOS (Break of Structure) and CHoCH (Change of Character) into simple buy and sell trading signals. It simplifies market structure trading by automatically identifying breakouts and reversals as they happen, allowing traders to focus on execution rather than analysis. Whether the market is continuing its trend or preparing to reverse, the i
Trend indicator AI
Ramil Minniakhmetov
4.95 (76)
Trend Ai indicator è un ottimo strumento che migliorerà l'analisi di mercato di un trader combinando l'identificazione della tendenza con punti di ingresso utilizzabili e avvisi di inversione. Questo indicatore consente agli utenti di navigare nelle complessità del mercato forex con fiducia e precisione Oltre ai segnali primari, l'indicatore Ai di tendenza identifica i punti di ingresso secondari che si presentano durante i pullback o i ritracciamenti, consentendo ai trader di capitalizzare le
FX Power MT4 NG
Daniel Stein
4.95 (20)
FX Power: Analizza la Forza delle Valute per Decisioni di Trading Più Intelligenti Panoramica FX Power è lo strumento essenziale per comprendere la reale forza delle principali valute e dell'oro in qualsiasi condizione di mercato. Identificando le valute forti da comprare e quelle deboli da vendere, FX Power semplifica le decisioni di trading e rivela opportunità ad alta probabilità. Che tu segua le tendenze o anticipi inversioni utilizzando valori estremi di Delta, questo strumento si adatta
Supply and Demand Dashboard PRO
Bernhard Schweigert
4.8 (20)
Attualmente 20% di sconto! Questo cruscotto è un software molto potente che lavora su più simboli e fino a 9 timeframe. Si basa sul nostro indicatore principale (migliori recensioni: Advanced Supply Demand ).   Il cruscotto offre un'ottima panoramica. Mostra:    Valori filtrati di domanda e offerta, compresa la valutazione della forza delle zone, distanze dei pip da/all'interno delle zone, Evidenzia le zone annidate, Fornisce 4 tipi di allarmi per i simboli scelti in tutti i (9) time-frames.
Indicatore in anticipo   determina i livelli e le zone di inversione del mercato , consente di attendere che il prezzo ritorni al livello ed entrare all'inizio di un nuovo trend, e non alla sua fine. Lui mostra   livelli di inversione   dove il mercato conferma un cambio di direzione e forma un ulteriore movimento. L'indicatore funziona senza ridisegnare, è ottimizzato per qualsiasi strumento e rivela il suo massimo potenziale quando abbinato al   LINEE DI TENDENZA PRO   indicatore. Scanner st
Presentazione       Quantum Trend Sniper Indicator   , l'innovativo indicatore MQL5 che sta trasformando il modo in cui identifichi e scambi le inversioni di tendenza! Sviluppato da un team di trader esperti con un'esperienza di trading di oltre 13 anni,       Indicatore Quantum Trend Sniper       è progettato per spingere il tuo viaggio di trading verso nuove vette con il suo modo innovativo di identificare le inversioni di tendenza con una precisione estremamente elevata. *** Acquista Quantum
Currency Strength Wizard è un indicatore molto potente che ti fornisce una soluzione all-in-one per un trading di successo. L'indicatore calcola la potenza di questa o quella coppia forex utilizzando i dati di tutte le valute su più intervalli di tempo. Questi dati sono rappresentati in una forma di indice di valuta facile da usare e linee elettriche di valuta che puoi utilizzare per vedere il potere di questa o quella valuta. Tutto ciò di cui hai bisogno è collegare l'indicatore al grafico che
Special Launch Offer: Available at a limited-time price to celebrate the new release. [Concept: Cutting Through the Noise] In a market filled with chaotic movements and lagging indicators, clarity is the ultimate weapon. KATANA Scalper is engineered with a singular philosophy: to cut through market noise like a precision blade. By filtering out non-essential fluctuations, it reveals the pure "Momentum Structure" hidden within the price action, allowing you to execute with surgical precision. 5
Trend Lines PRO
Roman Podpora
5 (1)
LINEE DI TENDENZA PRO       Aiuta a capire dove il mercato sta realmente cambiando direzione. L'indicatore mostra reali inversioni di tendenza e punti in cui i principali attori rientrano. Vedi  Linee BOS   Cambiamenti di tendenza e livelli chiave su timeframe più ampi, senza impostazioni complesse o rumore inutile. I segnali non vengono ridisegnati e rimangono sul grafico dopo la chiusura della barra. Cosa mostra l'indicatore: Cambiamenti reali       tendenza (linee BOS) Una volta che un segna
M1 Arrow
Oleg Rodin
5 (19)
Una strategia intraday basata su due principi fondamentali del mercato. L'algoritmo si basa sull'analisi dei volumi e delle onde di prezzo utilizzando filtri aggiuntivi. L'algoritmo intelligente dell'indicatore fornisce un segnale solo quando due fattori di mercato si combinano in uno solo. L'indicatore calcola le onde di un certo intervallo sul grafico M1 utilizzando i dati dell'intervallo di tempo più alto. E per confermare l'onda, l'indicatore utilizza l'analisi per volume. Questo indicatore
PRO Renko System
Oleg Rodin
5 (29)
PRO Renko System è un sistema di trading altamente accurato appositamente progettato per il trading di grafici RENKO. Questo è un sistema universale che può essere applicato a vari strumenti di trading. Il sistema neutralizza efficacemente il cosiddetto rumore di mercato che consente di accedere a segnali di inversione accurati. L'indicatore è molto facile da usare e ha un solo parametro responsabile della generazione del segnale. Puoi facilmente adattare lo strumento a qualsiasi strumento di
Smetti di indovinare. Inizia a fare trading con un vantaggio statistico. Gli indici azionari non si negoziano come il forex. Hanno sessioni definite, gap notturni e seguono pattern statistici prevedibili. Questo indicatore ti fornisce i dati di probabilità di cui hai bisogno per fare trading su indici come DAX, S&P 500 e Dow Jones con fiducia. Cosa lo rende diverso La maggior parte degli indicatori ti mostra cosa è successo. Questo ti mostra cosa probabilmente succederà dopo. Ogni giorno di trad
Volatility Trend System - un sistema di trading che fornisce segnali per le voci. Il sistema di volatilità fornisce segnali lineari e puntuali nella direzione del trend, nonché segnali per uscirne, senza ridisegnare e ritardi. L'indicatore di tendenza monitora la direzione della tendenza a medio termine, mostra la direzione e il suo cambiamento. L'indicatore di segnale si basa sui cambiamenti della volatilità e mostra gli ingressi nel mercato. L'indicatore è dotato di diversi tipi di avvisi. Pu
Meravith
Ivan Stefanov
5 (1)
L'indicatore analizza il volume da ogni punto e calcola i livelli di esaurimento del mercato per quel volume. È composto da tre linee: Linea di esaurimento del volume rialzista Linea di esaurimento del volume ribassista Una linea che indica la tendenza del mercato. Questa linea cambia colore per riflettere se il mercato è rialzista o ribassista. Puoi analizzare il mercato da qualsiasi punto di partenza tu scelga. Una volta che una linea di esaurimento del volume è raggiunta, identifica un nuovo
Currency Strength Exotics
Bernhard Schweigert
4.88 (33)
ATTUALMENTE SCONTATO DEL 20%! La soluzione migliore per qualsiasi principiante o trader esperto! Questo indicatore è specializzato nel mostrare la forza della valuta per qualsiasi simbolo come coppie esotiche, materie prime, indici o futures. È il primo nel suo genere, qualsiasi simbolo può essere aggiunto alla nona riga per mostrare la vera forza della valuta di Oro, Argento, Petrolio, DAX, US30, MXN, TRY, CNH ecc. Si tratta di uno strumento di trading unico, di alta qualità e conveniente pe
Day Trader Master è un sistema di trading completo per i day trader. Le systeme se compose de due indicatori. Un indicar est un signal fléché pour acheter et vendre. C'est l'indicateur de fleche que vous obtenez. Je vous fournirai le deuxième indicaur gratuitement. Le deuxième indicaur è un indicaur de tendance spécialement conçu pour être utilisé conjointement avec ces flèches. GLI INDICATORI NON SI RIPETONO E NON RITARDANO! Usare questo sistema è molto semplice. Devi solo seguire i segnali del
FX Volume
Daniel Stein
4.62 (37)
FX Volume: Scopri il Vero Sentimento di Mercato dalla Prospettiva di un Broker Panoramica Rapida Vuoi portare la tua strategia di trading a un livello superiore? FX Volume ti offre informazioni in tempo reale su come i trader retail e i broker sono posizionati—molto prima che compaiano report in ritardo come il COT. Che tu miri a guadagni costanti o desideri semplicemente un vantaggio più solido sui mercati, FX Volume ti aiuta a individuare grandi squilibri, confermare i breakout e perfezionar
Apollo Secret Trend è un indicatore di tendenza professionale che può essere utilizzato per trovare le tendenze su qualsiasi coppia e intervallo di tempo. L'indicatore può facilmente diventare il tuo indicatore di trading principale che puoi utilizzare per rilevare le tendenze del mercato, indipendentemente dalla coppia o dal periodo di tempo che preferisci negoziare. Utilizzando un parametro speciale nell'indicatore puoi adattare i segnali al tuo stile di trading personale. L'indicatore fornisc
Gli indicatori di tendenza sono uno degli ambiti dell'analisi tecnica utilizzati nel trading sui mercati finanziari. Indicatore Angular Trend Lines : determina in modo completo la direzione del trend e genera segnali di ingresso. Oltre a levigare la direzione media delle candele Utilizza anche l'angolo di inclinazione delle linee di tendenza. Il principio di costruzione degli angoli di Gann è stato preso come base per l'angolo di inclinazione. L'indicatore di analisi tecnica combina l'andamento
Se acquisti questo indicatore, riceverai il mio Trade Manager Professionale   + EA  GRATUITAMENTE. Innanzitutto è importante sottolineare che questo sistema di trading è un indicatore Non-Repainting, Non-Redrawing e Non-Lagging, il che lo rende ideale sia per il trading manuale che per quello automatico. Corso online, manuale e download di preset. Il "Sistema di Trading Smart Trend MT5" è una soluzione completa pensata sia per i trader principianti che per quelli esperti. Combina oltre 10 indic
Questo indicatore è un indicatore per l'analisi automatica delle onde perfetto per il trading pratico! Caso... Nota:   non sono abituato a usare nomi occidentali per la classificazione delle onde a causa dell'influenza della convenzione di denominazione di Tang Lun (Tang Zhong Shuo Zen), ho chiamato l'onda base come   penna   e la banda dell'onda secondaria come   segmento   At allo stesso tempo, il segmento ha la direzione del trend. La denominazione   è principalmente segmento di trend   (que
Altri dall’autore
ADX arrow
Pavel Shutovskiy
5 (1)
ADX arrow The indicator displays crossings of the ADX indicator (Average Directional Movement Index) lines as dots simplifying detection of signals. The indicator also features pop-up and email alerts. Parameters Period - averaging period. Apply to - applied price: Open, Close, High, Low, Median, (high+low)/2, typical, (high+low+close)/3, weighted Close, (high+low+close+close)/4. Alert - enable/disable pop-up alerts. EMail - enable/disable email alerts.
OsMA Arrow MTF
Pavel Shutovskiy
3.9 (10)
The indicator displays crossing zero level by Moving Average of Oscillator (OsMA) in the form of arrows. The this is a multi-timeframe indicator, and it displays signals from other timeframes. The indicator notifies about a signal by means of a pop-up Alert window, or sending notification to e-mail. Parameters Time-frame - select timeframe to show indicator signals. Fast EMA Period - fast EMA. This is an exponential moving average from a price with a short period. Slow EMA Period - slow EMA. Th
FREE
OsMA Arrow
Pavel Shutovskiy
3.83 (6)
The indicator displays crossing zero level by Moving Average of Oscillator (OsMA) in the form of arrows. The indicator notifies about a signal by means of a pop-up Alert window, or sending notification to e-mail. Parameters Fast EMA Period - fast EMA. This is an exponential moving average from a price with a short period. Slow EMA Period - slow EMA. This is also an exponential moving average of a market price but with a longer period. Signal SMA Period - MACD SMA. This is a signal line which is
FREE
Trend following
Pavel Shutovskiy
4.5 (2)
The EA in the form of histogram displays up and down trends. This tool is recommended to be used as a filter. Its readings will help to detect beginning, end, and continuation of a trend. This additional tool will suit any trading system. Parameters Period — indicator period; Bars — number of bars on the history.
FREE
MA 2 Histogram
Pavel Shutovskiy
4.5 (2)
The indicator is based on two Moving Averages. Its only difference from traditional indicators is that it is presented as a histogram. The histogram has four colors; each color represents a MA with its own period. In case of a descending trend, if a price is lower than a moving average, the indicator displays a value lower than the red zero level. In case of ascending trend, the indicator value is higher than the green zero level. Parameters: Period MA 1 - Period of the first moving average. MA
FREE
AD Trend line
Pavel Shutovskiy
5 (1)
AD Trend line draws trend lines on the basis of A/D indicator (Accumulation/Distribution). When A/D indicator breaks a trend line, the probability of the trend reversal is very high. This is a multitimeframe indicator which can display values from higher timeframes. Parameters Time-frame — Select a timeframe; zero is the current timeframe of the chart; Trend Line — Display lines on the chart; Apply to — Apply lines to close the candle's highest/lowest value; Width line — Width of the line; Style
FREE
AC Arrow
Pavel Shutovskiy
4 (2)
The indicator displays zero level Accelerator Oscillator (AC) crossover in the form of dots on the chart. In indicator settings one can specify number of bars in the history to display signals, as well as shift of dots with respect to a bar. Parameters Bars — number of bars in the history to display indicator's signals; Shift — shift of dots with respect to bars.
FREE
Maps
Pavel Shutovskiy
4.75 (4)
The indicator displays on the chart a map, on which markers show the current trading session, as well as shows a text. The indicator provides two types of background display: white and black. The indicator is displayed as the background and does not hinder tracking the current market situation. Parameters: GMT -  the time difference of the terminal and GMT. Background - selection of background - black or white.
FREE
Fibo
Pavel Shutovskiy
5 (2)
The script sets Fibonacci levels on the chart using maximums and minimums visible on the chart. The script names Fibo with such timeframe on which it has been launched (Fibo D1 or Fibo M30, etc.), therefore preserving previously constructed levels on different time charts. This instrument will be useful for those who start studying Fibonacci levels and those who need to form these levels in a speedy fashion. The script does not have additional settings. Fibonacci lines can be amended in standard
FREE
Beacon
Pavel Shutovskiy
5 (2)
The indicator determines overbought/oversold zones on various timeframes. Arrows show market trend in various time sessions: if the market leaves the overbought zone, the arrow will indicate an ascending trend (arrow up), if the market leaves the oversold zone, the arrow will indicate a descending trend (arrow down). Situation on the timeframe, where the indicator is located, is displayed in the lower right window. Information on the market location (overbought or oversold zone), as well as the
FREE
Any chart has patterns of consolidation which are also called accumulation patterns. These are sections where the market has been on the same price level during significant amount of time, and thus it was accumulating positions. After such accumulation, positions are distributing, and the market passes from flat into trend. The Consolidation Levels indicator is a professional tool which identifies these sections and builds levels according to the price of the market at the moment of consolidatio
ATR Pivot
Pavel Shutovskiy
The indicator calculates the levels by ATR daily range using the equations: 1AR = Open + ATR -1AS = Open - ATR AR 1/2 = Open + (ATR / 2) AS -1/2 = Open - (ATR / 2) AR 1/4 = Open + (ATR / 4) AS -1/4 = Open - (ATR / 4) AR 3/4 = Open + ((ATR*3) / 4) AS -3/4 = Open - ((ATR*3) / 4) AR 2 = Open + (ATR*2) AS -2 = Open - (ATR*2) Parameters Period ATR - ATR period Shift time - shift by time for Open Color opening of day - Open line color Color 1AR, -1AS - 1AR, -1AS line color Color AR 1/2, AS -1/2 - AR 1
AO AC Signal
Pavel Shutovskiy
The indicator displays signals of different indicators (which can be selected in parameters) on a chart when zero level is crossed. AO, AC or AO+AC if signals of two indicators coincide. The indicator shows an Alert message (pop-up window) when a signal appears. Parameters: Indicators - Selection of the indicator AO, AC, AO+AC. Bars - Number of bars in history for display of signals. Alert - Pop-up window in case of a signal.
The indicator displays trend reversal in the form of arrows. The indicator does not change its values (is not redrawn) after a signal. The program notifies about arrows by means of a pop-up window, or sending notification to e-mail. This is a multitimeframe instrument. Values of the indicator may be displayed from higher timeframes. Parameters Time-frame - select time session; zero is the current timeframe (Time-frame cannot be lower than the current time interval). Bars - number of bars on the
Beginning
Pavel Shutovskiy
The indicator builds levels from beginning of a week or a month, or according to local Highs and Lows. These levels are meant for detection of strong support and resistance levels on a chart. Most big players of the market are guided by particularly these data: opening of the week or opening of the month. Breakout of one or several Highs and price consolidation on these levels suggest that market intends to grow. Breakout of Lows and price consolidation bears evidence of market's intention to mo
F trend
Pavel Shutovskiy
The indicator is designed for scalping fans, it gives signals of an average of ten pips. The indicator is based on mathematical calculation, it determines the average range of the price channel, which is generally formed at the time of accumulation of positions. Once the price moves beyond its borders, a signal is generated in the form of an arrow. The indicator has a minimum of settings: the period for which you need to calculate, and the frequency of signals (the signal frequency is determined
Woltec
Pavel Shutovskiy
4 (1)
The indicator has been developed for scalping. The indicator is based on a mathematical calculation that determines the percent range of the price channel, which is generally formed at the time of the accumulation of positions. Once the price moves beyond its borders, a signal is generated in the form of dots. The indicator has a minimum of settings - the frequency of signals. Smaller values produce more signals. Parameters: Multiplier - the frequency of signals (with lower values signals are m
Jaguar tac
Pavel Shutovskiy
The indicator uses the Envelopes channel in its calculations, which allows working with dynamic support and resistance levels. It also considers the direction and strength of the trend, as well as the mathematical calculation that determines the percent range of the price channel, which is generally formed at the time of the accumulation of positions. It first generates a preliminary signal in the form of a round arrow. Then it is necessary to wait for a normal arrow and enter the market only af
ADX trend
Pavel Shutovskiy
This indicator displays the signals of the ADX indicator (Average Directional Movement Index) as points on the chart. This facilitates the visual identification of signals. The indicator also features alerts (pop-up message boxes) and sending signals to e-mail. Parameters Period - averaging period. Apply to - price used for calculations: Close, Open, High, Low, Median (high+low)/2, Typical (high+low+close)/3, Weighted Close (high+low+close+close)/4. Alert - enable/disable alerts. EMail - enable
Strategy Builder
Pavel Shutovskiy
5 (1)
Strategy Builder L'indicatore Strategy Builder consente di creare strategie classiche e individuali senza caricare il grafico con un gran numero di indicatori e senza tracciare molti indicatori diversi per identificare il vero segnale. Strategy Builder visualizza segnali sotto forma di frecce su 30 indicatori standard, 23 indicatori che mostrano divergenza classica e nascosta, ricevendo segnali da livelli di Fibonacci, orizzontali, linee di tendenza e rettangoli. Con l'aiuto di questo indicato
ADX arrow N
Pavel Shutovskiy
ADX arrow Questo indicatore visualizza i segnali dell'indicatore ADX (Indice di movimento direzionale medio) come punti sul grafico. Ciò facilita l'identificazione visiva dei segnali. L'indicatore dispone anche di avvisi (finestre di messaggio pop-up) e l'invio di segnali per e-mail. Parametro: Period  - periodo di media. Apply to  - prezzo utilizzato per i calcoli: Close, Open, High, Low, Median (high+low)/2, Typical (high+low+close)/3, Weighted Close (high+low+close+close)/4. Alert  - abil
ATR Pivots
Pavel Shutovskiy
The indicator calculates intraday levels based on the average daily price range, builds support and resistance levels that may be reversal. Parameters Period ATR - period of the ATR indicator Shift time - time offset for the opening of the day Color opening of day - color of the opening line of the day Color 1AR, -1AS - line color 1AR, -1AS Color AR 1/2, AS -1/2 - line color AR 1/2, AS Color AR 1/4, AS -1/4 - line color AR 1/4, AS -1/4 Color AR 3/4, AS -3/4 - line color AR 3/4, AS -3/4 Color
Filtro:
Maksym Mudrakov
30049
Maksym Mudrakov 2016.08.31 11:30 
 

L'utente non ha lasciato alcun commento sulla valutazione.

Rispondi alla recensione