Supply Demand RSJ
- Göstergeler
- Sürüm: 2.0
- Güncellendi: 8 Haziran 2021
- Etkinleştirmeler: 20

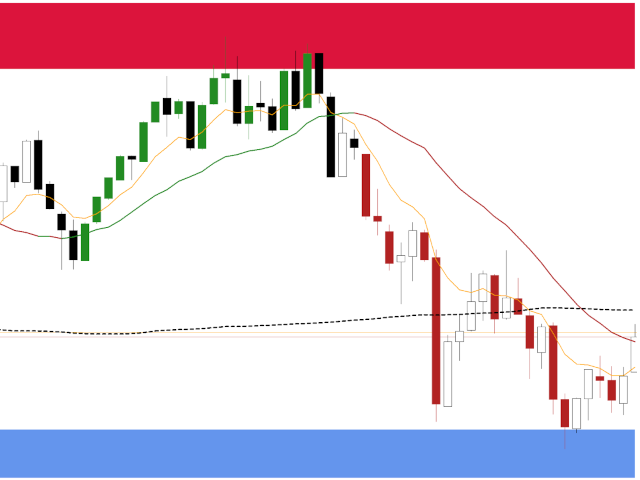
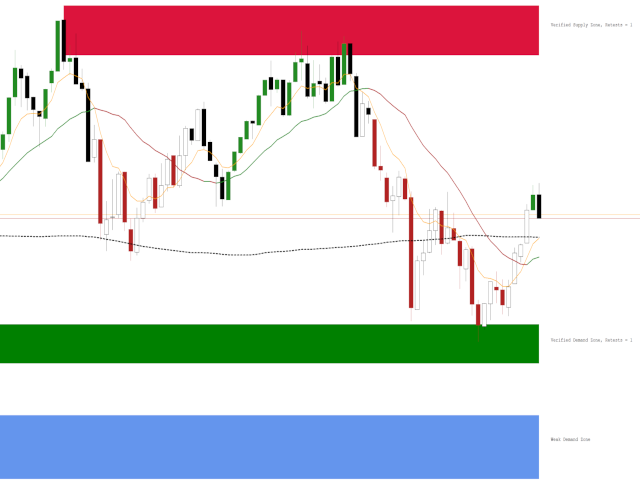
The indicator Supply Demand RSJ PRO calculates and plots the "Supply" and "Demand" zones on the graph, identifying the type of Zone (Weak, Strong, Verified, Proven) and in case of retests of the Zone it shows how many times it was retested.
"Supply" Zones are the price zones where more supply than demand has occurred, driving prices down.
"Demand" Zones are the price zones where more demand than supply has occurred, pushing prices up.
Be sure to try our professional version with configurable features and alerts: Suppy Demand RSJ PRO
Classification of zones
- Weak: Price region which, if re-tested, is likely to be violated.
- Strong: Price region that has changed the direction of the trend and is unlikely to be retested so soon.
- Verified: Strong price region, where there were 1 to 3 retests at most, but the price failed to break the region.
- Proven: Strong price region, where there were 3 or more retests, but the price failed to break through the region.
- Broken/Turncoat: Price region that is broken, becoming a resistance in the case of support and in the case of resistance becoming support.
Settings
- Show Zone Labels & Infos: True case writes on the right side of the zones the type of zone and number of re-tests if applicable.
- NOTE: Only works if the Chart Shift option is active.
- Font Color: Set the color of the texts
- Font Size: Set font size
If you still have questions, please contact me by direct message: https://www.mql5.com/en/users/robsjunqueira/


Kullanıcı değerlendirmeye herhangi bir yorum bırakmadı