Support Resistance Multi Time Frame
- Göstergeler
- Sürüm: 1.2
- Güncellendi: 5 Ocak 2020
- Etkinleştirmeler: 10

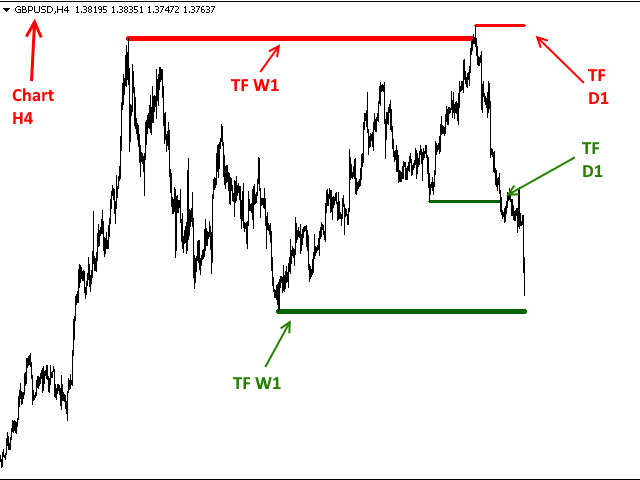
This indicator shows the latest untouched support and resistance as horizontal lines. The indicator can show support/resistance from higher timeframes. With this indicator you can e.g. easily see the support/resistance of the timeframes H4, D1 and W1 on a H1 chart, which can be a big advantage while time your entry on H1.
This is the FULL version of the indicator: Support Resistance Multi Time Frame FREE
Parameters
- referenceTF: the timeframe from which the support/resistance is calculated
- candlesLeftRight: define the amount of candles that need to be bigger/lower to define a valid fractal. Default value is 3.
You can also use higher values.
- colorResistance: the color of the resistance line
- colorSupport: the color of the support line
- widthOfLines: the width of the line (between 1 and 5). With the width of the line you can distinguish the support/resistance of the different timeframes.


I wish the developer had the levels labeled. I have to rely on different colors and line thickness to know which timeframe the level represents. Other than that, a valuable resource.