DinexSpace Economic Calendar Marker

  • Göstergeler
  • Huu Tho Tran
    Huu Tho Tran
    DinexSpace - MetaTrader 5 için alım-satım otomasyonu stüdyosu.
    İşlem fikrinizi kodlamadan önce gerçek maliyetlerle iki aşamada doğruluyoruz. Fikir doğrulamayı geçemezse dururuz - robot için ödeme yapmazsınız.
    Canlı geçmiş
  • Sürüm: 1.0

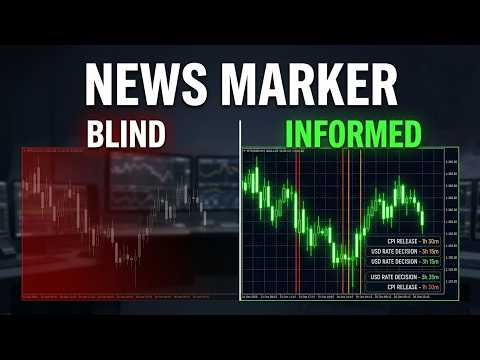
Economic Calendar Marker shows when economic news is released, directly on your chart. Each event time gets a vertical line coloured by importance, so you can see at a glance which candles were moved by news and what is coming next.


How it works

- Events come from the economic calendar built into MetaTrader 5 (the Calendar tab of the terminal). The indicator uses the standard Calendar functions.

- By default it shows the currencies of the chart symbol (for example EUR and USD on EURUSD, or USD for gold). You can type your own list instead, such as "USD,EUR,GBP".

- High, medium and low importance can each be switched on or off. Lines are red for high, amber for medium and grey for low.

- When several events share the same time, one line is drawn, coloured by the most important one. Hovering over it shows all their names.

- A panel lists the next events with date, currency, time remaining and name.

- Events from the last 5 days and the next 7 days are loaded (adjustable), and the list refreshes every 5 minutes.


Inputs

- Events: currencies, importance levels, days back, days ahead.

- Display: colours per importance, event names on lines (shown as the line description: turn on "Show object descriptions" in the chart properties, F8), number of events in the panel, panel corner, refresh interval.


Limits

- Event times are shown in the trade server's time, as provided by the terminal's calendar.

- The calendar is not available in the Strategy Tester, so nothing is drawn there.

- Event schedules can change. Always check the terminal's Calendar tab for the latest details.


The indicator marks times only. It does not trade or give signals.
Önerilen ürünler
Simple Weis Wave
Jean Jacques Huve Ribeiro
3.67 (3)
One of the best tools for analyzing volume, Weis Wave was idelized by David Weis, to facilitate the reading of directional flow. For the VSA method disciples it is an evolution of the practices created by Richard Wycoff, facilitating a predictive reading of the market, always seeking an accumulation and distribution of the negotiated contracts. Cumulative wave volume  Range of wave ( removed) Average Wave volume Ref "Tim Ord lectures" ( removed)
FREE
(Special New Year promotion - free price!) The indicator displays the actual 'Scale in points per bar' (identical to the manual setting in the Terminal, see screenshot) in the upper right corner of the chart. The displayed value changes INSTANTLY whenever the chart scale is changed! (This is very convenient when planning screenshots). In Settings: Change language (Russian/English), font size of the displayed text, text label offset coefficient from the graph corner, equally in X and Y directi
FREE
VWAP_PC_MQL5 — MT5 üzerinde hacim ağırlıklı ortalama fiyatı (VWAP) gösteren basit, el yapımı bir gösterge. TF: Tüm zaman dilimlerinde çalışır. Parite: Forex, endeks, emtia ve hisse senetleriyle uyumlu. Ayarlar: AppliedPrice – hesaplama için kullanılan fiyat türü LineColor / Width / Style – çizgi görünümü SessionReset – günlük sıfırlama veya sürekli mod Çalışma prensibi (VWAP): VWAP (Volume Weighted Average Price) = (Fiyat × Hacim toplamı) / (Hacim toplamı) Fiyat VWAP’ın üzerindeyse alıcılar b
FREE
VWAP + Volume Profile Combined Indicator FREE Launch Offer OVERVIEW Professional combination of VWAP (Volume Weighted Average Price)  and Volume Profile in a single MT5 indicator. This powerful tool  combines two of the most respected institutional trading tools  into one seamless display. KEY FEATURES 1. VWAP with 6 calculation modes 2. Volume Profile with Value Area analysis 3. Point of Control identification 4. Standard deviation bands 5. Dynamic color changing 6. Separate buy/sell vol
FREE
RSI back arrows
Smaylle Rafael Coelho Mariano
The   RSI Back Arrows   indicator is a powerful tool designed for traders who rely on the Relative Strength Index (RSI) to identify potential market reversals. This indicator specifically highlights when the RSI has exited the   oversold   or   overbought   zones, providing clear visual signals to inform trading decisions. Key Features: Visual Cues : The indicator marks arrows on the chart when the RSI crosses back into a neutral zone, making it easy to spot potential entry and exit points. Over
FREE
VFI Quantum
Nikita Berdnikov
5 (1)
Introducing VFI (Volume Flow Indicator) – a trading indicator that analyzes the relationship between volume and price movement to identify key trading opportunities. The indicator displays the strength and direction of volume flow, providing clear signals about potential entry and exit points. Signals are formed based on zero line crossovers, crossovers between the VFI line and its exponential moving average (EMA), and when the indicator exits overbought and oversold zones. Attention! This stra
FREE
Easy SMC Trading
Israr Hussain Shah
3.8 (5)
Otomatik Risk/Ödül ve Yapı Kırılması (BOS) Tarayıcılı Yapı Trendi Sürüm: 1.0 Genel Bakış Otomatik Risk/Ödül ile Yapı Trendi, Fiyat Hareketine ve Piyasa Yapısına dayanan yatırımcılar için tasarlanmış kapsamlı bir işlem sistemidir. Yüksek olasılıklı işlem kurulumları oluşturmak için düzeltilmiş bir trend filtresini, Swing Noktası tespiti ve Yapı Kırılması (BOS) sinyalleriyle birleştirir. Bu aracın öne çıkan özelliği Otomatik Risk Yönetimidir. Geçerli bir Yapı Kırılması tespit edildiğinde, göste
FREE
Macro-R Pro Signal — Advanced Trading Signal Indicator Macro-R Pro Signal is a professional trading indicator designed to deliver high-quality BUY and SELL signals with enhanced precision and reduced market noise. By combining Bollinger Bands, RSI, and adaptive volatility filtering , this indicator helps traders identify high-probability reversal points while avoiding unfavorable market conditions. How the Strategy Works This indicator is built on a mean reversion + momentum confirmation concep
FREE
Qstick is a way to objectively quantify candlestick analysis and improve the interpretation of candlestick patterns. Qstick was developed by Tushar Chande and published in his book " The New Technical Trader - Boost Your Profit by Plugging Into the Latest Indicators (1994) ". Qstick is built based on a moving average of the difference between the Open and Close prices. The basis of the idea is that the Opening and Closing prices are the heart of candlestick analysis. We strongly recommend the re
FREE
Indicator Description Range Filter Pro is a sophisticated trading tool for XAUUSD (Gold) that combines adaptive price filtering with volume analysis and real-time market monitoring. Designed for both novice and professional traders, this indicator helps identify trend direction, potential reversals, and significant market movements through its multi-layered approach. Key Components 1.Dynamic Range Filter 2.Volatility-Adjusted Bands 3.Volume-Enhanced Candles 4.Professional Trading Dashboard 5.M
FREE
Genel Bakış MetaTrader 5 için özel olarak tasarlanmış, ultra hafif, yüksek performanslı bir hacim dağılım göstergesi olan Anchored Volume Profile ile profesyonel düzeyde emir akışı (order flow) analizini deneyimleyin. Ham bellek tuvali (Canvas) mekaniği kullanılarak sıfırdan oluşturulan bu gösterge, standart dikdörtgen nesne profillerinde yaygın olarak görülen aşırı CPU gecikmesini (CPU lag), arayüz titremesini ve grafik donmasını tamamen ortadan kaldırır. Terminalin yerel tik hacmini yönlü ma
FREE
Smart Structure Buy Sell Signals is a visual market structure indicator developed primarily for Gold (XAUUSD) intraday trading on MetaTrader 5. The indicator combines market structure, momentum, liquidity behaviour and supply-demand zones to identify potential Buy and Sell opportunities. It provides clear trading levels while keeping the final trading decision completely under the user’s control. This is a manual trading indicator. It does not open, modify or close real trades. Main Features • C
FREE
Candle Timer Simple
Jithin Sajan Sajan
5 (1)
SETTINGS Make sure to select Chart shift option in the chart.   (Right click in the chart ---> Properties (dialog box) ----> Select Chart Shift) Kindly rate and comment about the product for upgradation & Support When using candlestick timers, keep in mind that the timing of candlestick patterns can play a crucial role in your trading strategy. For instance, different timeframes (such as 1-minute, 5-minute, hourly, ) can provide varying insights into price movements and trends. Make sure to i
FREE
Smart FVG Stats
- Md Rashidul Hasan
5 (1)
The  Smart FVG Statistics Indicator  is a powerful MetaTrader 5 tool designed to automatically identify, track, and analyze Fair Value Gaps (FVGs) on your charts. Love it? Hate it? Let me know in a review! Feature requests and ideas for new tools are highly appreciated. :) Try "The AUDCAD Trader": https://www.mql5.com/en/market/product/151841 Key Features Advanced  Fair Value Gap  Detection Automatic Identification : Automatically scans for both bullish and bearish FVGs across specified histo
FREE
BBOscillator — Candle Coloring with Andean Oscillator States and ATR Stop Levels Overview BBOscillator is a technical indicator for MetaTrader 5 that is drawn in the main chart window. It combines the Andean Oscillator state logic, candle coloring, dynamic ATR stop levels and state-change marks in a single visual layer, so that four questions can be answered by looking at one chart: whether the direction is defined, which side it leans to, where the direction state started, and where a stop refe
FREE
THV Daily VWAP MT5 – Daily Volume Weighted Average Price THV Daily VWAP MT5 is a technical indicator designed to display the Daily Volume Weighted Average Price (VWAP) directly on your MetaTrader 5 chart. Unlike traditional VWAP indicators that may only display limited session data or reset at specific trading sessions, this indicator plots a continuous VWAP line throughout the trading day, making it easy to observe how price behaves relative to the daily volume-weighted average price. The VWAP
FREE
Range Explosion Hakkında Range Explosion, piyasa aralıklarını tespit eden, destek ve direnç bölgelerini çizen ve breakout fırsatlarını hassasiyetle belirleyen güçlü ve ücretsiz bir ticaret aracıdır. Break Out Explosion Projesi’nin bir parçası olarak, hem yeni başlayanlara hem de profesyonellere güvenilir ve gelişmiş bir çözüm sunar. Breakout stratejilerine ilgi duyuyorsanız, ana trend yönündeki trend çizgisi kırılmalarını algılayan gelişmiş aracı inceleyin: https://www.mql5.com/en/market/product
FREE
Squeeze Momentum Force is an advanced technical analysis indicator designed for MetaTrader 5. It combines volatility squeeze detection with momentum analysis to identify high-probability trading opportunities. Based on John Carter's original concept, this enhanced version incorporates: Multi-Timeframe (MTF) analysis. Divergence detection. Volume weighting. Modern user interface for quick market interpretation. The indicator identifies periods of low volatility (squeeze) that typically precede si
FREE
Value Chart Candlesticks
Flavio Javier Jarabeck
4.57 (14)
The idea of a Value Chart indicator was presented in the very good book I read back in 2020 , " Dynamic Trading Indicators: Winning with Value Charts and Price Action Profile ", from the authors Mark Helweg and David Stendahl. The idea is simple and the result is pure genius: Present candlestick Price analysis in a detrended way! HOW TO READ THIS INDICATOR Look for Overbought and Oversold levels. Of course, you will need to test the settings a lot to find the "correct" one for your approach. It

FREE
MIDAS Super VWAP
Flavio Javier Jarabeck
4.27 (11)
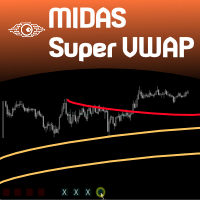
Imagine VWAP, MVWAP and MIDAS in one place... Well, you found it! Now you can track the movement of Big Players in various ways, as they in general pursue the benchmarks related to this measuring, gauging if they had good execution or poor execution on their orders. Traders and analysts use the VWAP to eliminate the noise that occurs throughout the day, so they can measure what prices buyers and sellers are really trading. VWAP gives traders insight into how a stock trades for that day and deter

FREE
Apex Point
Marco Engstermann
Apex Point is a trend-following indicator for MetaTrader 5, transforming complex market data into signals for traders. It displays blue dots for uptrends, red dots for downtrends, and yellow crosses at potential reversals, helping users identify momentum shifts quickly. Key features include a confirmation system requiring multiple bars (default: 3) to validate changes, reducing false signals; dynamic ATR-based offsets for adaptive trailing, with instant ratcheting in the trend direction and smo
FREE
Neon Profile
Manuel Fernandez Barranco
XBK Neon Profile MT5 Developed by XBK Systems. XBK Neon Profile is an advanced technical indicator for MetaTrader 5 that combines smoothed trend analysis and a dynamic volume profile within a single chart window. The indicator is designed to provide a clear view of market structure and significant volume levels without cluttering the screen. Key Features Smoothed Trend Bands (Neon Trend Bands) Identifies the current trend direction using a custom smoothing algorithm designed to filter out market
FREE
The indicator highlights the points that a professional trader sees in ordinary indicators. VisualVol visually displays different volatility indicators on a single scale and a common align. Highlights the excess of volume indicators in color. At the same time, Tick and Real Volume, Actual range, ATR, candle size and return (open-close difference) can be displayed. Thanks to VisualVol, you will see the market periods and the right time for different trading operations. This version is intended f
FREE
Weis Waves
Flavio Javier Jarabeck
2.83 (18)
The original author is David Weis, an expert in the Wyckoff Method. The Weis Wave is a modern adaptation of the 1930's Wyckoff Method, another expert in Tape Reading techniques and Chart Analysis. Weis Waves takes market volume and stacks it into waves according to price conditions giving the trader valuable insights about the market conditions. If you want to learn more about this subject you can find tons of videos in YouTube. Just look for "The Wickoff Method", "Weis Wave" and "Volume Spread
FREE
Vegas indicador
Valter Cezar Costa
3.5 (2)
Esse Indicador é uma boa opção para quem gosta de operar a longo prazo e com paciência. Ele trabalho com os níveis de fibo na media de 200 são  9 níveis  onde você pode operar nas reversões o mercado partir do níveis abaixo.    Level 1 = 550 pontos    Level 2 = 890 pontos    Level 3 = 1440 pontos    Level 4 = 2330 pontos    Level 5 = 3770 pontos    Level 7 = 9870 pontos    Level 8 = 15970 pontos   Level 9 = 25840 pontos      Level 6 = 6100 pontos
FREE
Grid baskets rarely break in a quiet market. They break when a trend starts and nobody notices it in time. LTS Trend Strength is the market-regime filter from LTS - Legacy Trading System. In one look it tells you whether the market is ranging, in transition or in a strong trend, on your chart and on four higher timeframes at the same time. It is built on the same ADX and ATR principles we use to protect our Expert Advisors, and it is free. It is a market filter, not an entry signal: it tells yo
FREE
Weis Waves , David Weis tarafından geliştirilen ve Richard Wyckoff’un prensiplerinden esinlenen bir teknik göstergedir. Geleneksel hacim göstergesinin bar bar gösterilmesinden farklı olarak, Weis Waves hacmi yükseliş veya düşüş “dalgaları” halinde biriktirir ve fiyat yönü değiştiğinde sayımı sıfırlar. Bu yöntem, traderların piyasa hareketlerinin gerçek gücünü net bir şekilde görmesini sağlar, çünkü her dalga bir dizi mum çubuğunu destekleyen hacim yoğunluğunu yansıtır. Temel özellikler: Hacmi
FREE
Girassol Sunflower MT5 Indicator
Saullo De Oliveira Pacheco
3.86 (7)
This is the famous Sunflower indicator for Metatrader5. This indicator marks possible tops and bottoms on price charts. The indicator identifies tops and bottoms in the asset's price history, keep in mind that the current sunflower of the last candle repaints, as it is not possible to identify a top until the market reverses and it is also not possible to identify a bottom without the market stop falling and start rising. If you are looking for a professional programmer for Metatrader5, please
FREE
CTJM Candle Timer
Jivarajah Tharamarajah
5 (2)
The CTJM Candle Timer Indicator is a robust tool developed for traders who use MetaTrader 5. Designed with precision, it displays the remaining time for the current candle on a trading chart, enabling traders to monitor the market more effectively and make timely decisions. With a customizable visual interface, users can adjust colors, font sizes, and positioning to suit their preferences. Some key features of this indicator include: Real-Time Candle Countdown: Keeps traders informed of the exa
FREE
QuantMatrix Probability AI Free QuantMatrix Probability AI Free is a technical indicator for MetaTrader 5 that combines several measurements of current market conditions into three numerical estimates. The indicator uses exponential moving averages, Relative Strength Index (RSI), Average True Range (ATR) and the current price position in its calculation. These measurements are combined into a normalized market score. The resulting information is displayed on the chart as: BUY percentage SELL p
FREE
Bu ürünün alıcıları ayrıca şunları da satın alıyor
Trend Sniper X
Sarvarbek Abduvoxobov
4.86 (42)
Trend Sniper X , tüccarların trend yönünü ve olası dönüş noktalarını netlik ve hassasiyetle belirlemelerine yardımcı olan MetaTrader 5 için çoklu zaman dilimli bir trend takip göstergesidir. MT4 için: https://www.mql5.com/en/market/product/193245 Fiyat Bilgisi: Mevcut fiyat tanıtım amaçlıdır ve gelecek güncellemeler ile yeni özellikler yayınlandıkça değişebilir. Bonus Fırsatı: Bu indikatör için ÜCRETSİZ Oto-Trade Assistant EA'yı almak için lütfen satın aldıktan sonra yazara mesaj gönderin. Code
Şehre yeni bir Kral geldi - Gösterge + Emir Yönetimi göstergeleri (TP1 + TP2 + TP3) + Opsiyonel Telegram Sinyal Gönderici DAHİL (ÜCRETSİZ) (TAM TRADING ve SİNYAL SİSTEMİ) Altın için en iyi EA’mız: Gold Slayer Bu gösterge; gelişmiş bir strateji, özelleştirilebilir emir yönetimine sahip bir trading sistemi ve envelope uzantılarını birleştiren bir mean reversion sistemi içerir. Ayrıca RSI gibi birçok akıllı onay filtresiyle desteklenerek yüksek olasılıklı dönüş girişlerini AL ve SAT sinyalleriyle y
Smart Trend Trading System — MetaTrader 5 Satın aldıktan sonra Smart Universal Expert Advisor'ı ÜCRETSİZ edinmek ve beraberinde çevrimiçi kurs, PDF kılavuzu ve özel gruba erişim almak için MQL5 üzerinden bana mesaj gönderin. STTS; trend yönünü, giriş ve çıkış sinyallerini, dönüş bölgelerini ve önemli fiyat seviyelerini doğrudan grafiğinizde bir araya getirir. Sistemi manuel işlemler için kullanabilir veya ayrı bir uyumlu EA’yı bağlayarak seçtiğiniz ayarlarla otomatik işlem gerçekleştirebilirsini
Zoryk Gold
Reda El Koutbane
4.76 (17)
ZORYK — MetaTrader 5 İçin Gelişmiş XAUUSD Sinyal Sistemi Bu hissi biliyorsunuz. Altını analiz etmek için uzun zaman harcarsınız. Doğru giriş noktasını beklersiniz. Sonunda işlemi açarsınız ve fiyat hemen aleyhinize hareket etmeye başlar. İşlemi çok erken kapatırsınız, Stop Loss seviyesini değiştirirsiniz veya birkaç saniye tereddüt edersiniz. Daha sonra piyasa, başlangıçta beklediğiniz hedefe tam olarak ulaşır; ancak siz artık işlemin içinde değilsinizdir. Sorun her zaman yön değildi. Asıl sorun
İşlem avantajınızı görüş alanınıza alın! M5 Sniper , MeanFX tarafından geliştirilen yeni bir indikatördür. Hassas işlem sinyallerini adaptif TP/SL seviyeleriyle birleştirir — bunun sonucunda mümkün olan en iyi istatistiksel işlemleri oluşturur! Fiyat her 5 satın alımda bir artar, bir sonraki fiyat 69$ olacaktır. Satın aldıktan sonra ipuçları/rehber ve bonus EA almak için bana mesaj gönderin. Onu öne çıkaran nedir? Kanıtlanmış istatistiksel performans Gold XAUUSD üzerinde ( neredeyse her varlıkta
SuperScalp Pro
Van Minh Nguyen
4.54 (37)
SuperScalp Pro - Professional Multi-Layer Confluence Scalping System SuperScalp Pro, klasik Supertrend sistemini birden fazla akıllı doğrulama filtresiyle geliştiren ileri düzey bir scalping göstergesidir. Yanlış sinyalleri önemli ölçüde azaltırken başarı olasılığı daha yüksek Buy/Sell işlem fırsatlarını belirlemenize yardımcı olur. Buy ve Sell okları doğrudan grafik üzerinde net bir şekilde görüntülenir. ATR tabanlı Stop Loss ve Take Profit seviyeleri de gerçek zamanlı olarak otomatik hesaplanı
SMC Intraday Formula
VividMind Digital Solutions
5 (26)
Önce dürüst olalım. Hiçbir gösterge tek başına sizi kârlı yapmaz. Eğer biri size aksini söylüyorsa, size bir hayal satıyordur. Mükemmel al/sat okları gösteren her gösterge, kusursuzmuş gibi görünecek şekilde yapılabilir — sadece geçmişin doğru bir bölümünü yakınlaştırıp kazanan işlemleri ekran görüntüsü almanız yeterlidir. Biz bunu yapmıyoruz.  SMC Intraday Formula bir araçtır. Piyasa yapısını sizin için okur, en yüksek olasılıklı fiyat bölgelerini belirler ve şu anda akıllı paranın izinin nası
GoldenX Entry MT5
VividMind Digital Solutions
5 (17)
GoldenX Entry, adaptif Smart Entry Trend algoritmasına, sinyal skorlaması sistemine, piyasa rejimi algılayıcısına ve volatilite filtresine sahip bir MT5 indikatörüdür. Her sinyal; hesaplanmış bir giriş seviyesi, üç adet Take-Profit seviyesi (TP1, TP2, TP3) ve bir Stop-Loss seviyesi içerir. Farklı piyasa koşullarına uyum sağlamak için tasarlanmış çok katmanlı analitik yapı üzerine kuruludur ve yerleşik optimizasyon aracı ile istatistik takip sistemini birleştirir. Risk-ödül (RR) metrikleri ve geç
Efsane geri dönüyor: Entry Points Pro 10. MQL5 Market'te 3 yıl boyunca ilk 3'te kalan efsanevi indikatörün yeniden lansmanı. İki sürümde toplam 600'dan fazla yorum, her gün binlerce trader onunla işlem yapıyor, 28.000'den fazla demo indirmesi   MT4+MT5 . Beş yıl boyunca yazdığınız her yorumu okudum — ve söz vermek yerine yanıtları 10. sürümün içine işledim. 1999'dan beri piyasada olan ve dürüstlüğe, itibarına ve müşterilerine değer veren bir yazardan. Entry Points Pro, işleme giriş sinyallerini
Auto Optimized SpeedAngle , sürekli İleriye Dönük Optimizasyon (Walk-Forward Optimization, WFO) yoluyla eğri uydurmayı (curve-fitting) ortadan kaldıran kurumsal düzeyde bir momentum vektörleme sistemidir. Piyasa rejimleri değiştiğinde etkinliğini yitiren statik girdilere güvenmek yerine, gösterge, örneklem dışı (Out-of-Sample, OOS) doğrulama kullanarak parametrelerini dinamik olarak yeniden kalibre eder ve böylece gösterilen sinyallerin geçmişteki rastgele anomalileri değil, gerçek bir istatisti
Gann Made Easy , bay teorisini kullanarak ticaretin en iyi ilkelerine dayanan, profesyonel ve kullanımı kolay bir Forex ticaret sistemidir. WD Gann. Gösterge, Zararı Durdur ve Kâr Al Seviyeleri dahil olmak üzere doğru SATIN AL ve SAT sinyalleri sağlar. PUSH bildirimlerini kullanarak hareket halindeyken bile işlem yapabilirsiniz. Satın alma işleminden sonra, alım satım talimatlarını ve harika ek göstergeleri ücretsiz olarak almak için lütfen benimle iletişime geçin! Muhtemelen Gann ticaret yöntem
ARIPoint
Temirlan Kdyrkhan
1 (4)
ARIPoint is a powerful trading companion designed to generate high-probability entry signals with dynamic TP/SL/DP levels based on volatility. Built-in performance tracking shows win/loss stats, PP1/PP2 hits, and success rates all updated live. Key Features: Buy/Sell signals with adaptive volatility bands Real-time TP/SL/DP levels based on ATR Built-in MA Filter with optional ATR/StdDev volatility Performance stats panel (Success, Profit/Loss, PP1/PP2) Alerts via popup, sound, push, or email Cu
Adaptive Price Action Engine Göstergeyi al, EA'sı (Uzman Danışman) bedava gelsin Kendi Kendini Optimize Eden Multi-Timeframe Trend ve Mum Formasyonu Analizi Piyasalar sürekli değişir ve her Price Action formasyonu her piyasa koşulunda aynı değere sahip değildir. Adaptive Price Action Engine , değişen piyasa koşullarına uyum sağlamak amacıyla trend yapısını, Multi-Timeframe analizini, mum formasyonlarını ve istatistiksel optimizasyonu tek bir analiz sistemi içerisinde birleştirir. İki Adaptif Mod
M1 Sniper MT5
Oleg Rodin
5 (7)
M1 SNIPER   kullanımı kolay bir işlem göstergesi sistemidir. M1 zaman dilimi için tasarlanmış bir ok göstergesidir. Gösterge, M1 zaman diliminde scalping için bağımsız bir sistem olarak kullanılabilir ve mevcut işlem sisteminizin bir parçası olarak kullanılabilir. Bu işlem sistemi özellikle M1'de işlem yapmak için tasarlanmış olsa da, diğer zaman dilimleriyle de kullanılabilir. Başlangıçta bu yöntemi XAUUSD ve BTCUSD ticareti için tasarladım. Ancak bu yöntemi diğer piyasalarda işlem yaparken de
Tokyo mt5 Indicator
Vasiliy Strukov
5 (12)
Tokyo Indicator; trend yönü, potansiyel işlem sinyalleri ve piyasa koşulları hakkında net ve görsel bir genel bakış sunar. Renk kodlu ve kademeli trend çizgisi, yükseliş evrelerini (mavi) düşüş evrelerinden (macenta) ayırt eder. Trend değiştiğinde, buna karşılık gelen yön okları potansiyel alım ve satım fırsatlarını vurgular. Entegre bir panel; mevcut sinyali, piyasa eğilimini, momentumu, volatiliteyi ve sinyal kalitesini tek bir kullanışlı görünümde bir araya getirir. Bu sayede yatırımcılar, fa
Gold Entry Sniper
Tahir Mehmood
5 (21)
Gold Entry Sniper – Altın Scalping & Swing Trading için Profesyonel Çoklu Zaman Çerçeveli ATR Paneli Gold Entry Sniper , XAUUSD ve diğer enstrümanlar için doğru al/sat sinyalleri veren, ATR Trailing Stop mantığı ve çoklu zaman çerçevesi analizi ile geliştirilmiş gelişmiş bir MetaTrader 5 göstergesidir. Temel Özellikler ve Avantajlar Çoklu Zaman Çerçevesi Analizi – M1, M5, M15 trendlerini tek panelde gösterir. ATR Tabanlı Trailing Stop – Volatiliteye göre dinamik olarak ayarlanır. Profesyonel Gra
Sonraki Güncelleme — Sürüm 2.52 Çok Yakında! [YENİ] Piyasa Analizinizi ve İşlem Sürecinizi Geliştirmek İçin Tasarlanmış 4 Büyük Yeni Özelliğe Hazır Olun İşlem ihtiyaçlarınızı karşılamak üzere tasarlanmış 4 yeni özellikle piyasa analizini bir üst seviyeye taşıyoruz. İşte yeni özellikler: 1. TRADE OVERVIEW DASHBOARD 2. CONFLUENCE AT ZONE 3. STRONG & WEAK HIGH/LOW 4. OTE 1. TRADE OVERVIEW DASHBOARD Piyasanın genel görünümünü daha kolay anlamanıza yardımcı olan, işlem kararlarınızı desteklemek için
Boba Analysis Suite
Trade Ready Solutions LLC
5 (2)
Boba Analysis Suite Boba Analysis Suite, MetaTrader 5 için geliştirilmiş bir analiz göstergesidir. Piyasa yapısını, önemli fiyat bölgelerini ve genel piyasa bağlamını tek bir grafik görünümünde bir araya getirir. Trader ve trading eğitmeni olarak edinilen uygulamalı deneyimden yola çıkarak geliştirilmiştir. Piyasanın yönünü değerlendirme, önemli seviyeleri belirleme ve birden fazla zaman dilimini birlikte inceleme gibi adımlardan oluşan sistematik bir analiz sürecini destekler. Piyasa Bağlamını
FiboSniper Pro
Van Minh Nguyen
5 (4)
FiboSniper Pro – Multi-Filter Fibonacci System with Auto SL/TP and Control Panel FiboSniper Pro, seçilmiş Buy ve Sell sinyalleri üretmek için dinamik Fibonacci Envelopes ile birden fazla doğrulama filtresini birleştiren teknik bir göstergedir. Fibonacci seviyeleri Moving Average ve ATR temel alınarak hesaplanır ve ardından ADX, EMA, RSI, ATR, Volume, Time ve Candle yapısı ile filtrelenir. Gösterge, ATR tabanlı otomatik Stop Loss ve Take Profit seviyelerini doğrudan grafik üzerinde görüntüler ve
Break and Retest Hunter
Mohamed Hassan
3.67 (3)
Break and Retest Hunter is a powerful MetaTrader 5 indicator designed to automatically identify support and resistance levels, breakout structures, and potential retest opportunities in real time. Bonus Indicator: After purchasing Break and Retest Hunter , contact me to receive Trade Indicator Assistant EA completely free as a bonus utility. $65 for the next 10 copies . Next price is $120.  Combining adaptive market analysis, clear BUY/SELL signals, Fibonacci-based profit targets, and a premiu
Trend Catcher ind mt5
Ramil Minniakhmetov
5 (18)
TREND YAKALAYICI GÖSTERGE Trend Yakalayıcı Gösterge, yazarın tescilli ve özelleştirilmiş uyarlanabilir trend analiz göstergelerinin bir kombinasyonunu kullanarak piyasa fiyat hareketlerini analiz eder. Kısa vadeli gürültüyü filtreleyerek ve temel momentum gücüne, volatilite genişlemesine ve fiyat yapısı davranışına odaklanarak gerçek piyasa yönünü belirler. Ayrıca, hareketli ortalamalar, RSI ve volatilite filtreleri gibi yumuşatma ve trend filtreleme özelleştirilmiş göstergelerinin bir kombina
Power Candles MT5
Daniel Stein
4.58 (12)
Power Candles V3 - Kendi Kendini Optimize Eden Güç Göstergesi Power Candles V3, döviz ve enstrüman gücünü, eklendiği her grafikte eyleme geçirilebilir bir ticaret planına dönüştürür. Sadece mumları renklendirmek yerine, arka planda canlı bir otomatik optimizasyon çalıştırır ve önünüzdeki sembol için en iyi Stop Loss, Take Profit ve sinyal eşiğini size sunar. Tek bir tıklama ile canlı ticarete uyarlanır - giriş, Stop Loss ve Take Profit ışınları grafikte tam fiyatlarla görünür ve uyarılar yön bil
Gold Trend Coach MT5
Cristhian Alexander Gaibor Cuasquer
5 (2)
Gold Trend Coach, MetaTrader 5 için alış ve satış sinyalleri, stop loss ve üç take profit hedefi mum kapanışında onaylanan, çoklu zaman dilimi koç paneli ve telefonunuza ve Telegram'a uyarılar sunan bir altın (XAUUSD) trend göstergesidir. Londra ve New York seanslarında M5 scalping ve M15 gün içi işlemler için tasarlandı. Gold Trend Coach: giriş, stop ve üç hedefli XAUUSD altın trend sinyalleri. İlk 20 kopya için lansman fiyatı $39, sonra $59. Satın aldıktan sonra bana yazın, alıcı kitiniz heme
Neuro Poseidon MT5
Daria Rezueva
4.75 (52)
Neuro Poseidon is a new indicator by Daria Rezueva. It combines precise trading signals with adaptive TP/SL levels - creating best possible trades as a result! Message me and get  Neuro Poseidon Assistant  as a gift to automize your trading process! What makes it stand out? 1. Proven profitability on all assets and timeframes 2. Only confirmed BUY and SELL signals present on the chart 3. Adaptive TP & SL levels generated by the software for each trade 4. Easy to understand - suitable for al
Unix Scalper
Issam Kassas
4 (4)
Unix Scalper — MetaTrader 5 Satın aldıktan sonra Smart Universal Expert Advisor'ı ÜCRETSİZ edinmek ve beraberinde çevrimiçi kurs, PDF kılavuzu ve özel gruba erişim almak için MQL5 üzerinden bana mesaj gönderin. İşlem fırsatını belirleyin. Planı görün. Nasıl işlem yapacağınıza karar verin. UNIX Scalper; piyasa analizini, BUY/SELL/WAIT kararlarını ve Entry, Stop Loss, TP1 ve TP2 seviyelerini düzenli bir panelde bir araya getirir. SİNYALİ VE PLANI GÖRÜN • Net kararlar: BUY, SELL veya WAIT. • Belir
Tanıtım       Quantum Breakout PRO   , Breakout Bölgeleri ile ticaret yapma şeklinizi değiştiren çığır açan MQL5 Göstergesi! 13 yılı aşkın ticaret tecrübesine sahip deneyimli tüccarlardan oluşan bir ekip tarafından geliştirilmiştir.       Kuantum Breakout PRO       yenilikçi ve dinamik koparma bölgesi stratejisiyle ticaret yolculuğunuzu yeni zirvelere taşımak için tasarlanmıştır. Kuantum Breakout Göstergesi, size 5 kar hedefi bölgesi ile kırılma bölgelerinde sinyal okları ve kırılma kutusuna da
FX Trend MT5 NG
Daniel Stein
5 (6)
FX Trend NG: Yeni Nesil Çoklu Piyasa Trend Zekâsı Genel Bakış FX Trend NG , çoklu zaman dilimlerinde çalışan profesyonel bir trend analiz ve piyasa izleme aracıdır. Piyasanın yapısını saniyeler içinde anlamanızı sağlar. Birden fazla grafik arasında geçiş yapmak yerine, hangi enstrümanların trendde olduğunu, momentumun nerede zayıfladığını ve hangi zaman dilimlerinin uyumlu olduğunu anında görebilirsiniz. Lansman Teklifi – FX Trend NG sadece $30 (6 Ay) veya $80 Ömür Boyu Lisans ile edinin. Zate
Çoklu Para Birimi Güç ve Momentum Göstergesi MT5 Dynamic Forex28 Navigator, uzun süredir popüler olan göstergelerimizin gelişmiş halidir ve üç aracın gücünü tek bir araçta birleştirir: Advanced Currency Strength28 Indicator (700 değerlendirme) Advanced Currency IMPULSE with ALERT (530 değerlendirme) CS28 Combo Signals (güncel bonus) İki önceki gösterge MQL5 Market'te birlikte 1.200'den fazla değerlendirme aldı ve 2016'dan bu yana MT4 topluluğunun vazgeçilmez araçlarından biri. Dynamic Forex28 Na
Scalper Vault, gün içi işlemlerde istikrar yakalamak isteyen yatırımcılar için tasarlanmış, güçlü ve tam donanımlı bir alım satım sistemidir. Bu yüksek hassasiyetli gösterge; hem Forex hem de İkili Opsiyon yatırımcıları için kurumsal düzeyde analizler sunan, bağımsız ve eksiksiz bir alım satım sistemi işlevi görür. SATIN ALIM İŞLEMİNDEN SONRA BENİMLE İLETİŞİME GEÇİN; ALIM SATIM İPUÇLARIMI VE HARİKA BİR BONUSU ALIN! Tahmin yürütme zorunluluğunu ve karmaşık manuel analiz süreçlerini ortadan kaldı
Volatility Master for MetaTrader is a real-time dashboard tool that scans up to  50 symbols  to identify high-volatility , trending markets instantly. With bullish/bearish signals, customizable alerts, and a user-friendly interface, it helps you avoid range-bound conditions and focus on high-probability trades. Clarity leads to confidence. Trade confidently and protect your capital effectively with this powerful dashboard. We don't offer free or bonus indicators in exchange of reviews from you.
Yazarın diğer ürünleri
Swing High Low Levels marks confirmed swing highs and lows and extends each one to the right as a horizontal level until price breaks it. At a glance you can see which recent swings are still intact and which have already been taken out. How it works - A swing high is a bar whose high is above the highs of the bars on its left and not exceeded by the bars on its right (10 left and 5 right by default). A swing low works the same way with lows. - A swing is confirmed only after the bars on its ri
FREE
ATR Stop Levels draws price levels a chosen number of ATRs below and above the current price. It shows at a glance where a volatility-based stop would sit for a long or a short position, without measuring by hand. How it works - ATR (Average True Range) measures the typical bar range. You can smooth it with RMA (Wilder's original method), SMA or EMA. - Up to three multipliers (1.5, 2 and 3 by default). Each draws a dashed level below price and one above, with a label showing the price and the d
FREE
Daily and Previous Day Levels draws the reference levels intraday traders check every morning: the previous day's high, low and close, today's open, today's running high and low, and the previous week's high and low. How it works - Values come straight from the symbol's own D1 and W1 bars, so the day follows your broker's server day. - Each day gets its own line segment, from the day's first bar to its last. Past days stay readable and old lines never shift. You choose how many days to keep (5
FREE
Fibonacci Auto Levels draws Fibonacci retracement levels automatically, so you do not have to drag the Fibonacci tool by hand every time the chart moves. How it works - The indicator looks at the last N bars (100 by default) and finds the highest high and the lowest low. - The direction follows which extreme came last. - Low after the high: the last swing was down. Level 0 sits at the low and level 1 at the high, so the levels show how far price has bounced back up. - High after the low: the la
FREE
Heikin Ashi Smoothed draws a cleaner version of Heikin Ashi candles. Regular Heikin Ashi already averages prices to reduce noise; this version smooths twice, before and after the Heikin Ashi step, so small swings disappear and longer moves stand out. How it works 1. The bar's open, high, low and close are smoothed with an exponential moving average (length 10 by default). 2. Heikin Ashi candles are built from those smoothed prices: close = average of the four prices, open = midpoint of the prev
FREE
Round Number Levels draws horizontal lines at round prices around the current price, for example every 50 dollars on gold, every 100 pips on EURUSD or every 1,000 on Bitcoin. Many traders watch these "psychological" prices, so it is useful to have them on the chart without drawing them by hand. How it works - With the automatic step, the minor step is about one hundredth of the price, rounded to 1, 2 or 5 times a power of ten. Gold near 4,000 gives 50, EURUSD near 1.10 gives 0.01, and Bitcoin n
FREE
Volume Profile shows where volume has built up by price over the last N bars. It draws a horizontal histogram to the right of the last bar and marks three reference levels: the Point of Control, and the high and low of the Value Area. How it works - The price range of the last N bars (200 by default) is split into rows (40 by default). - Each bar's volume is spread evenly over its high-low range and added to the rows it touches. You can use tick volume (always available in MT5) or real volume w
FREE
Average Daily Range (ADR) Panel shows how far a symbol usually travels in a day and how much of that typical range today has already covered. It is a quick way to judge whether today is quiet, normal or unusually active. How it works - The daily range is the D1 bar's high minus its low. ADR is the average of that range over the last 5, 10 and 20 completed days; today's unfinished day is not included. - Today's range is the current D1 bar's high minus its low so far. - "Used of ADR" is today's r
FREE
Pivot Points draws the classic floor-trader levels from the previous day, week or month: a central pivot plus resistance (R) levels above and support (S) levels below. Three common formulas are included. Formulas (H, L, C = previous period's high, low, close; P = (H + L + C) / 3; range = H - L) - Classic: R1 = 2P - L, S1 = 2P - H, R2/S2 = P ± range, R3 = H + 2(P - L), S3 = L - 2(H - P). - Fibonacci: P ± 0.382, 0.618 and 1.000 × range. - Camarilla: C ± range × 1.1/12, 1.1/6, 1.1/4 and 1.1/2 (R1-
FREE
Currency Strength Meter ranks the eight major currencies (USD, EUR, GBP, JPY, CHF, CAD, AUD, NZD) from strongest to weakest over a recent period. It uses all 28 pairs they form, so it shows whether a move belongs to one currency or to the other side of the pair. How it works - For each pair the indicator takes the percent change between the last closed bar and the bar N bars before it on the chosen timeframe (24 H1 bars by default). - A currency gains that change when it is the base of a pair a
FREE
Session Boxes draws the Asia (Tokyo), Europe (London) and US (New York) trading sessions as rectangles on an intraday chart. Each box spans the session's high and low, so you can see where each market traded, how wide the range was and where sessions overlap. How it works - Session hours are entered in each market's local time (Tokyo 09:00-18:00, London 08:00-17:00 and New York 08:00-17:00 by default). - UK and US daylight saving are applied automatically, so the boxes stay on the right bars al
FREE
Risk to Lot Calculator turns "how much am I willing to lose on this trade" into a lot size. It takes your contract data straight from the broker, so it works the same on forex, gold, indices and crypto CFDs. How it works - Risk per trade is a percent of your balance (or equity, or a manual amount) or a fixed amount in the account currency. - The stop loss can be a price, a distance in points or a multiple of ATR. - The loss for 1.00 lot at the stop is the stop distance divided by the tick size,
FREE
ATR Trailing Stop Line draws where a volatility-based trailing stop would sit. For a long position the line stays a fixed number of ATRs below the highest point reached. For a short position it stays above the lowest point. The line only moves in the position's favour and never moves back. How it works - ATR (Average True Range, Wilder's smoothing) measures the typical bar range. The line sits a chosen multiple of it (3 by default) away from price. - On each bar the line is pulled up (long side
FREE
Inside/Outside Bar Highlighter colours two common candle patterns so they are easy to spot on any chart: - Inside bar: the bar's high is below the previous high and its low is above the previous low. The range has contracted inside the previous bar. - Outside bar: the bar's high is above the previous high and its low is below the previous low. The range has expanded beyond the previous bar on both sides. How it works - The indicator draws a coloured candle on top of each matching bar. Inside ba
FREE
Opening Range Levels marks the high, low and middle of the opening range, the first minutes of a session you choose, and carries those levels through the rest of the day. How it works - You set the window and its time zone: New York (default 09:30-10:00), London, Tokyo or your broker's server time. - US and UK daylight saving are applied automatically. Your broker's server offset is detected from the terminal; most brokers shift their clock with US daylight saving, which is the default, and a f
FREE
Previous Session High Low Alerts marks the high and low of the last completed trading session and alerts you when price comes back to them. Many traders watch where the previous Asian, London or New York session topped and bottomed. This indicator draws those levels and notifies you when they are touched. How it works - You set one session by its start and end in server time (default 10:00-19:00, which matches London hours on many brokers whose servers run at GMT+2/+3). Sessions may run past mi
FREE
Session and Anchored VWAP plots the volume-weighted average price (VWAP), the average price paid in a period weighted by volume. Two versions are included: one that resets every day, week or month, and one anchored at a moment you choose. How it works - Periodic VWAP: starts fresh at the beginning of each day (broker server time), each week (Monday) or each month, and accumulates price × volume from there. - Up to two bands at a chosen number of standard deviations show how far price has moved
FREE
Drawdown Monitor keeps an eye on your account and tells you how deep the current drawdown is. Its alerts fire before a bad day turns into a worse one. How it works - DD from peak: how far equity is below its highest value. The peak is stored in a terminal global variable per account, so it survives restarts. It can be reset with an input. - Floating DD: how far equity is below balance, which is the loss on open positions. - Today DD: how far equity is below the equity at the start of the server
FREE
Multi-Timeframe Trend Panel shows, in one small panel, what a moving average is doing on four timeframes at once (M15, H1, H4 and D1 by default). You can see whether the timeframes agree without switching charts. How it works - For each timeframe the indicator reads the moving average (EMA 50 by default) on the last closed bar and on the bar a few bars before it (5 by default). - The change between the two is compared with ATR(14) of the same timeframe: - rising when the average went up by more
FREE
ATR Volatility Percentile answers a simple question: is the market quiet or busy compared with its own recent past? Raw ATR values are hard to compare across symbols and periods. A percentile puts them on one 0-100 scale. How it works - ATR (Average True Range, Wilder's smoothing, length 14 by default) measures the typical bar range. - The indicator compares the current ATR with the previous N values (250 bars by default). The percentile is the share of those values that were lower than or equa
FREE
Correlation Matrix shows how closely up to six symbols have moved together. It helps to avoid holding several positions that are really the same bet, and to see when a usual relationship between markets breaks down. How it works - The reference bars are the last N closed bars (60 by default) of the chosen timeframe (D1 by default) on the chart symbol. - For each symbol the indicator finds the bar at the same time with iBarShift and takes its return, so symbols with different trading hours are c
FREE
Watchlist Scanner puts the key numbers of up to 20 symbols in one panel on any chart, so you can compare markets without opening a chart for each. Columns - Last: current bid. - Chg %: change since the previous daily close, green when up and aqua when down. - Spread: current spread in points. - ATR D1 (%): the daily Average True Range over the last 14 completed days, in price and as a percent of price. It shows how much each symbol typically moves in a day, on a comparable scale. - Range/ATR: t
FREE
Day and Week Separators draws vertical lines at the start of each day, week and month on intraday charts, with an optional day-of-week label at each line. It is a small visual aid that makes it easier to see where one trading day ends and the next begins. How it works - Day, week and month separators each have their own switch, colour and line style. - When several periods start on the same bar, only the strongest line is drawn: month over week, week over day. - The trading day can start at the
FREE
Spread Monitor and Logger keeps a record of your broker's spread on the current symbol. It shows when spreads widen (rollover, news, quiet hours) and keeps a simple log you can open in a spreadsheet. How it works - Every second the indicator reads the current spread in points. A sample is only counted while the symbol is quoting (a new tick in the last minute), so closed hours do not pull the statistics down. - The panel shows the current spread, the average, minimum and maximum of the current
FREE
Market Sessions Clock is a small panel that shows, at a glance, which markets are open right now and when the next one opens or closes. How it works - Four sessions: Sydney, Tokyo, London and New York. Each has its own on/off switch and hours. - Hours are entered in each market's local time (for example 08:00-17:00 London), and daylight saving is applied automatically for Sydney, London and New York. - For every session the panel shows Open or Closed, the time left until it closes or until it n
FREE
Account Info Panel puts the numbers you check most often into one small panel on the chart, so you do not have to switch to the Trade tab. What it shows - Balance and equity. - Floating P/L of open positions. - Closed today: profit, swap, commission and fees of deals closed since the start of the server day. Deposits and withdrawals are excluded. - Margin used and free margin. - Margin level, highlighted when it falls below 200%. - Today's drawdown: how far equity is below its level at the star
FREE
News Countdown Panel keeps the next important economic release in view. A small panel shows how long is left until the next event of the chart's currencies, so a news spike does not catch you by surprise. How it works - Events come from the economic calendar built into MetaTrader 5, through the standard Calendar functions. - By default it uses the currencies of the chart symbol (for example EUR and USD on EURUSD, or USD on gold). You can type your own list, such as "USD,GBP". - You choose the i
FREE
Spread and Swap Info shows the trading costs and timing details of the current symbol in a small panel, so beginners can check them without opening the symbol specification. What it shows - Spread in points, with "(fixed)" when the broker quotes a fixed spread. - Swap long / short with the right unit for the symbol's swap mode: points, a currency (base, margin or account currency), percent per year, or "reopen". When swaps are disabled or both are zero it shows "Swap: none". - Triple swap day,
FREE
Lot Size Script answers one question before a trade: how many lots can I open so that hitting my stop loss costs exactly the risk I chose? Drop it on a chart, fill in two numbers and read the answer. How it works - Risk is a percent of balance, a percent of equity, or a fixed amount in the account currency. - The stop loss is a distance in points or a stop-loss price. A price on the wrong side of the entry is rejected with a clear message. - The entry is the current ask (buy) or bid (sell) of t
FREE
Trade History Exporter is a script that saves your account's trading history to CSV files, so you can study your own results in Excel, Google Sheets or Python. It only reads history. What it writes (in MQL5\Files\DinexHistory\, via File → Open Data Folder) - Deals file, one row per deal: ticket, time, symbol, type (buy, sell, balance, commission …), entry (in, out, reverse, close by), volume, price, commission, swap, fee, profit, magic number, position ID and comment. - Positions file (optional
FREE
Filtrele:
Değerlendirme yok
Değerlendirmeye yanıt