DinexSpace Pivot Points
- Göstergeler
-
Huu Tho Tran
 DinexSpace - MetaTrader 5 için alım-satım otomasyonu stüdyosu.
İşlem fikrinizi kodlamadan önce gerçek maliyetlerle iki aşamada doğruluyoruz. Fikir doğrulamayı geçemezse dururuz - robot için ödeme yapmazsınız.
Canlı geçmiş - Sürüm: 1.0
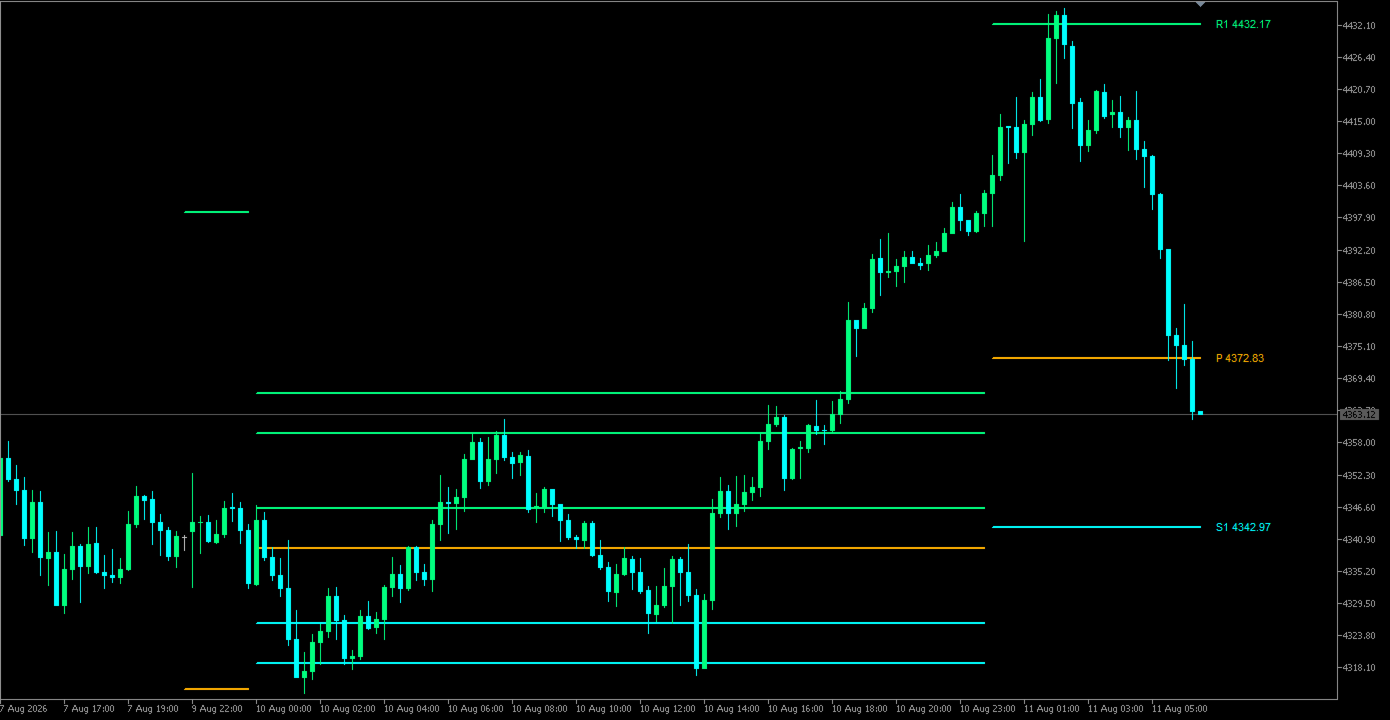
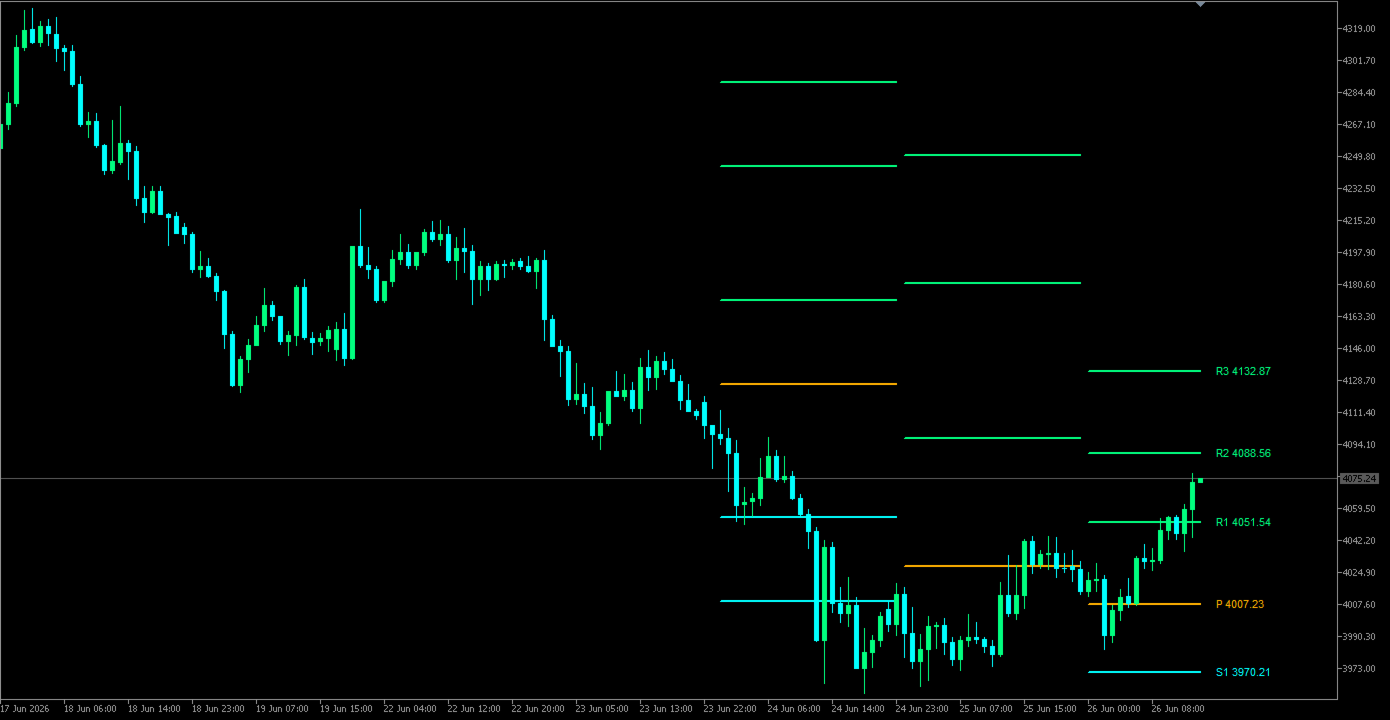
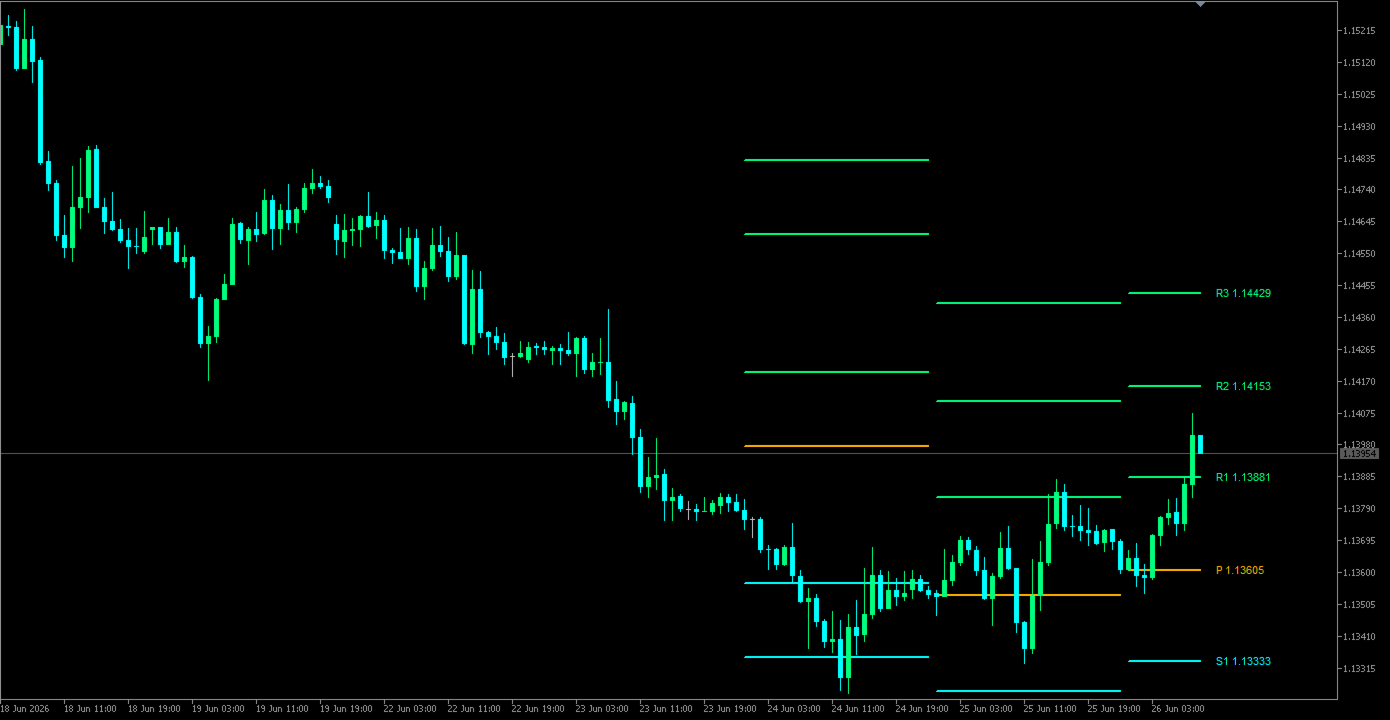
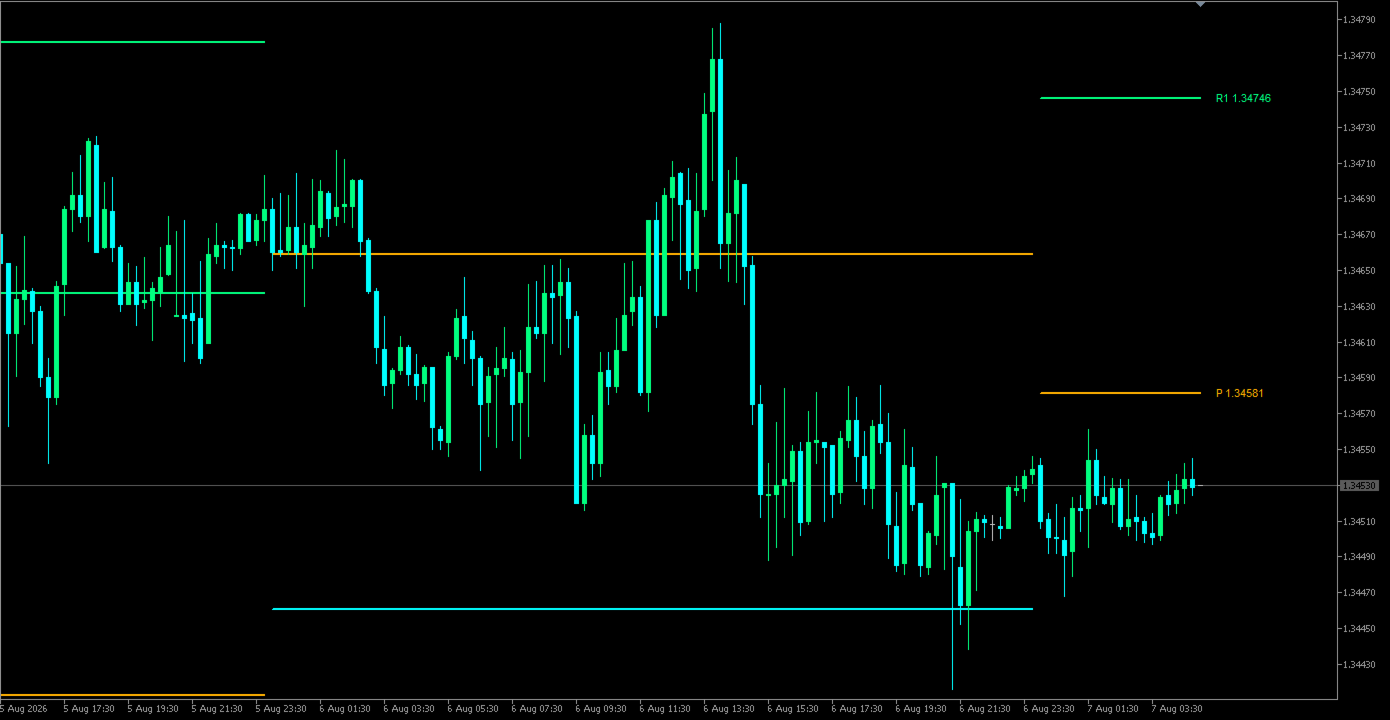
Pivot Points draws the classic floor-trader levels from the previous day, week or month: a central pivot plus resistance (R) levels above and support (S) levels below. Three common formulas are included.
Formulas (H, L, C = previous period's high, low, close; P = (H + L + C) / 3; range = H - L)
- Classic: R1 = 2P - L, S1 = 2P - H, R2/S2 = P ± range, R3 = H + 2(P - L), S3 = L - 2(H - P).
- Fibonacci: P ± 0.382, 0.618 and 1.000 × range.
- Camarilla: C ± range × 1.1/12, 1.1/6, 1.1/4 and 1.1/2 (R1-R4, S1-S4).
How it works
- Values come from the previous closed D1, W1 or MN1 bar, so they stay fixed for the whole current period.
- Each period gets its own line segment, drawn behind the candles. You choose how many periods to keep.
- The current levels carry labels (P, R1, S1 …) with the price, just right of the last bar.
- You choose how many levels to show on each side (up to 3 for Classic and Fibonacci, 4 for Camarilla).
- Lines are rebuilt only when a new period starts; on other ticks only the current segment is extended.
Inputs
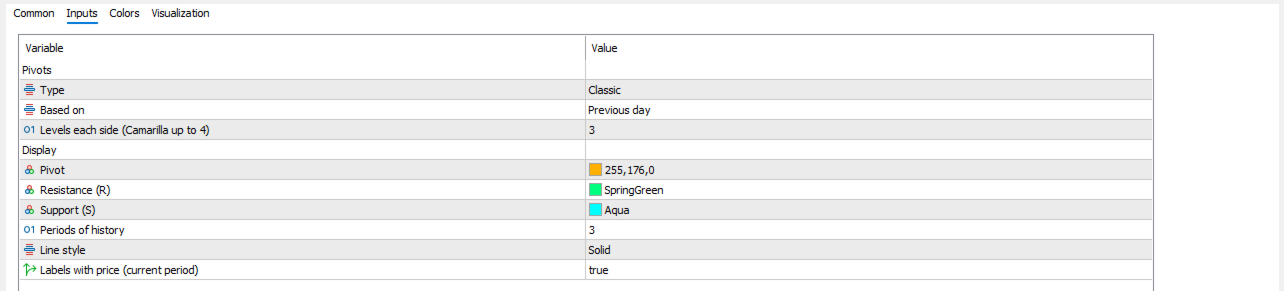
- Pivots: type, based on previous day/week/month, levels each side.
- Display: colours for pivot, resistance and support, periods of history, line style, labels.
Limits
- Use a chart timeframe below the pivot period; on higher timeframes nothing is drawn.
- Days, weeks and months follow the broker's server time.
- It draws reference levels only. It does not say when to buy or sell.
The indicator does not trade or give signals.