Yoshi Adaptive MA Cloud

  • Göstergeler
  • Le Quang Thanh
    Le Quang Thanh
    Professional Trading Tools for MetaTrader 5
    I specialize in developing high-quality indicators and Expert Advisors for MetaTrader 5, inspired by well-known trading methodologies used by professional traders and market researchers around the world.
  • Sürüm: 1.1
  • Etkinleştirmeler: 10

A structured MT5 trend, momentum and pullback framework for clearer manual trading decisions

Moving-average trading often looks simple until the market becomes less cooperative. A crossover may appear after a move is extended, timeframes may disagree, and a clean signal can turn into whipsaw inside a narrow range. The challenge is rarely a lack of indicators. It is the lack of an orderly way to connect trend, momentum, market regime, confirmation and risk.

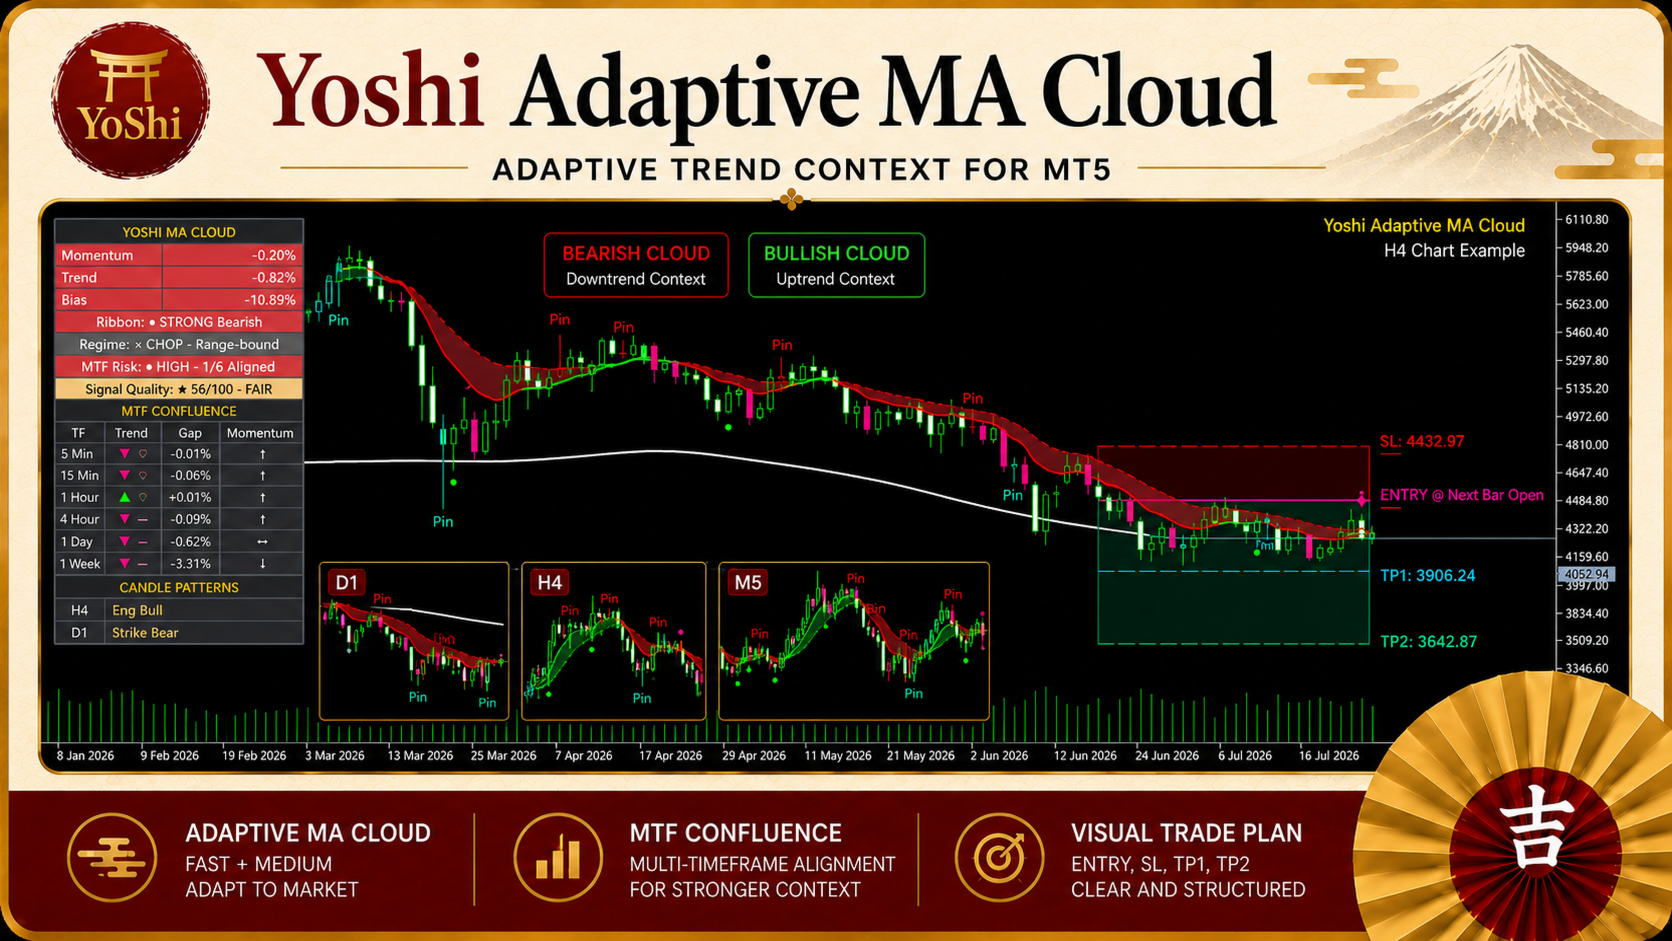
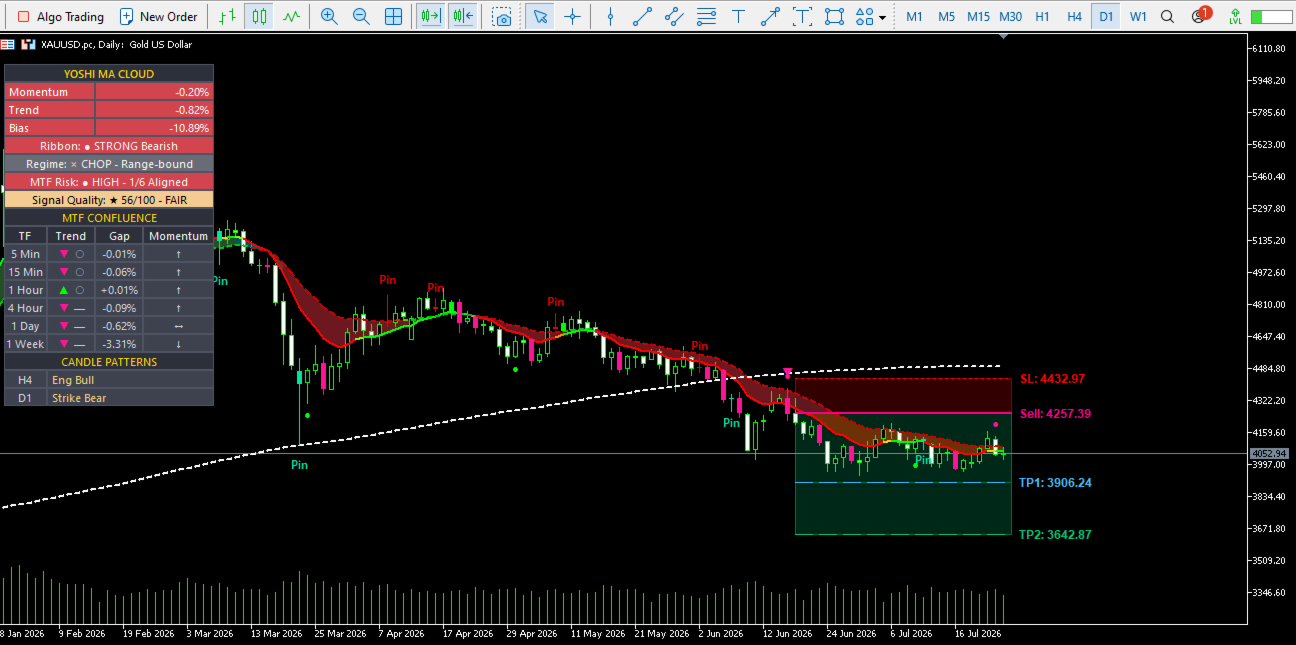
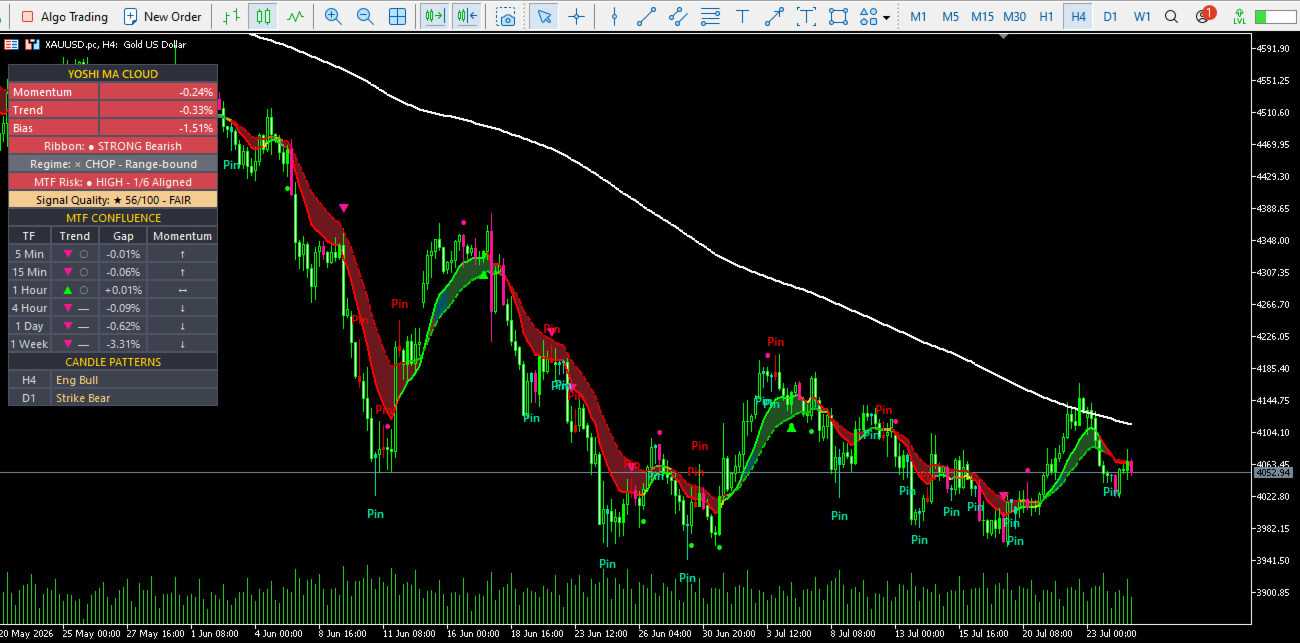
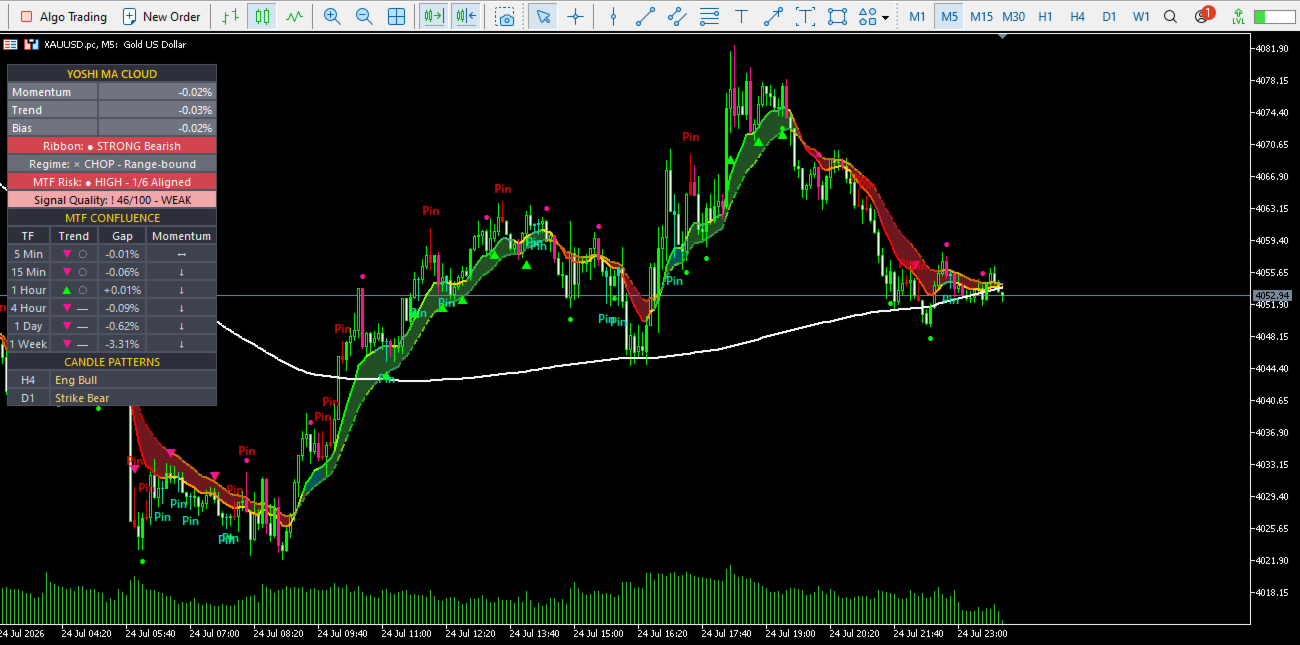
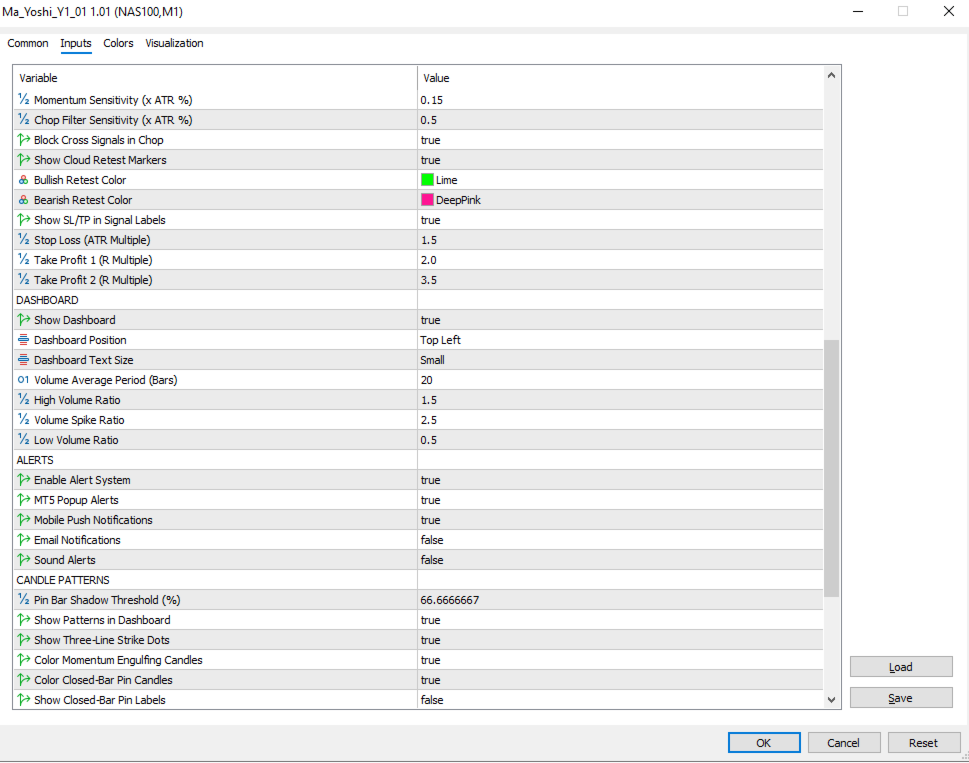
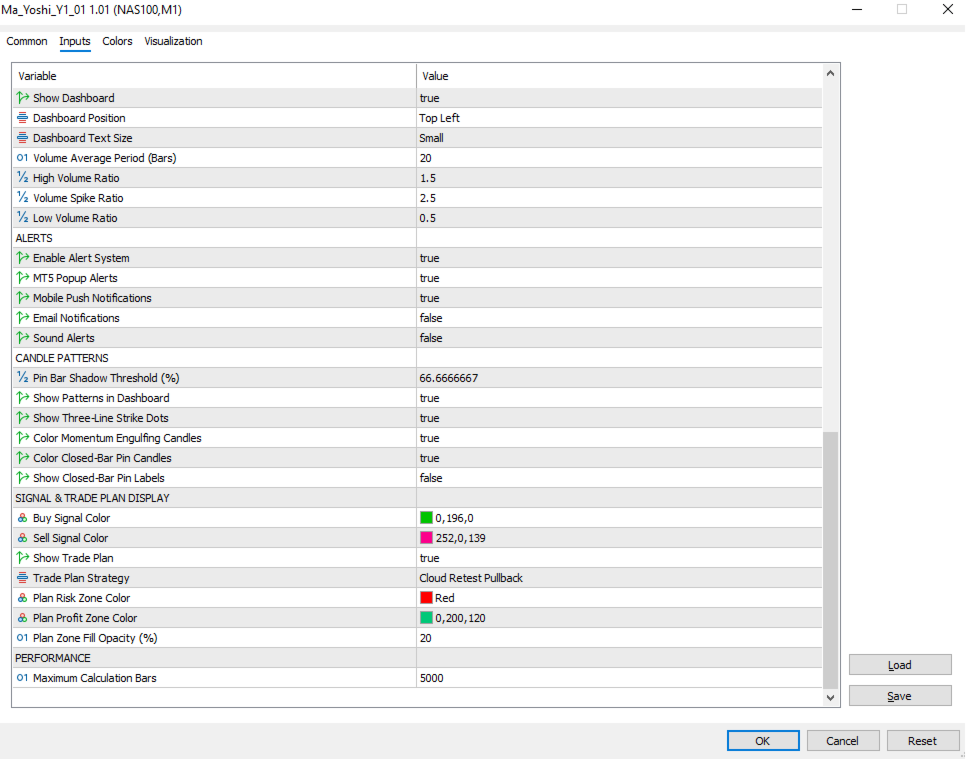
Yoshi Adaptive MA Cloud is a MetaTrader 5 indicator designed to organize those decisions in one practical chart workflow. It combines a configurable moving average cloud with volatility-aware momentum analysis, multi-timeframe context, confirmed signal events, candlestick information and a visual Trade Plan. It does not open or manage trades automatically. The final decision remains with the trader.

A clearer view of trend and regime

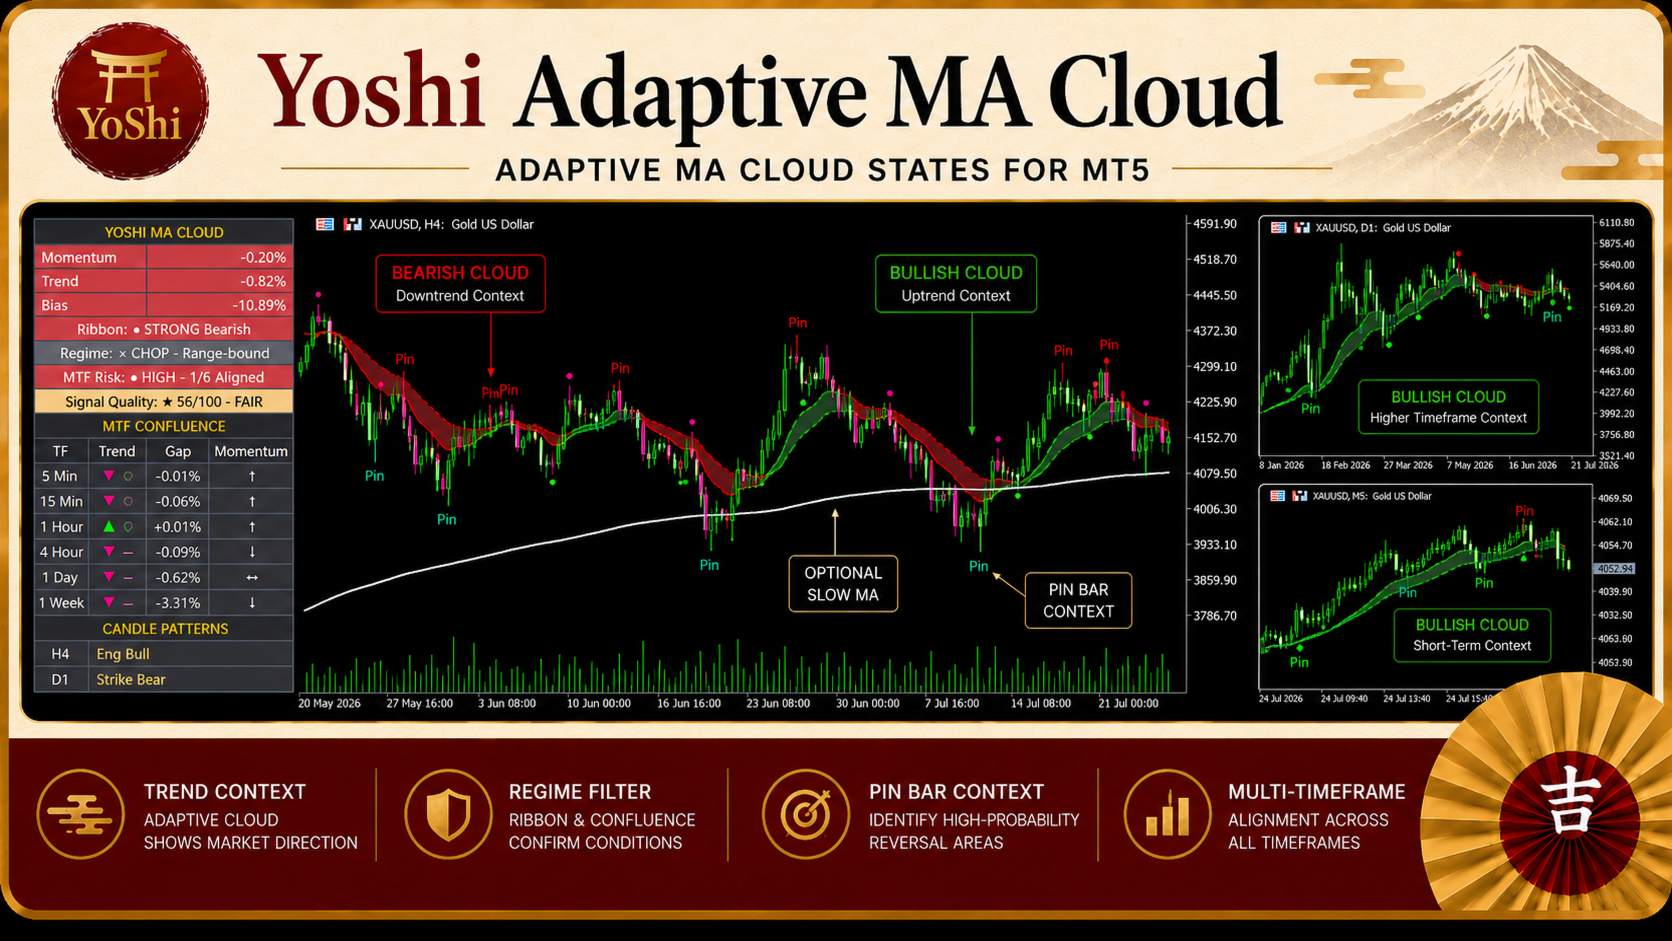
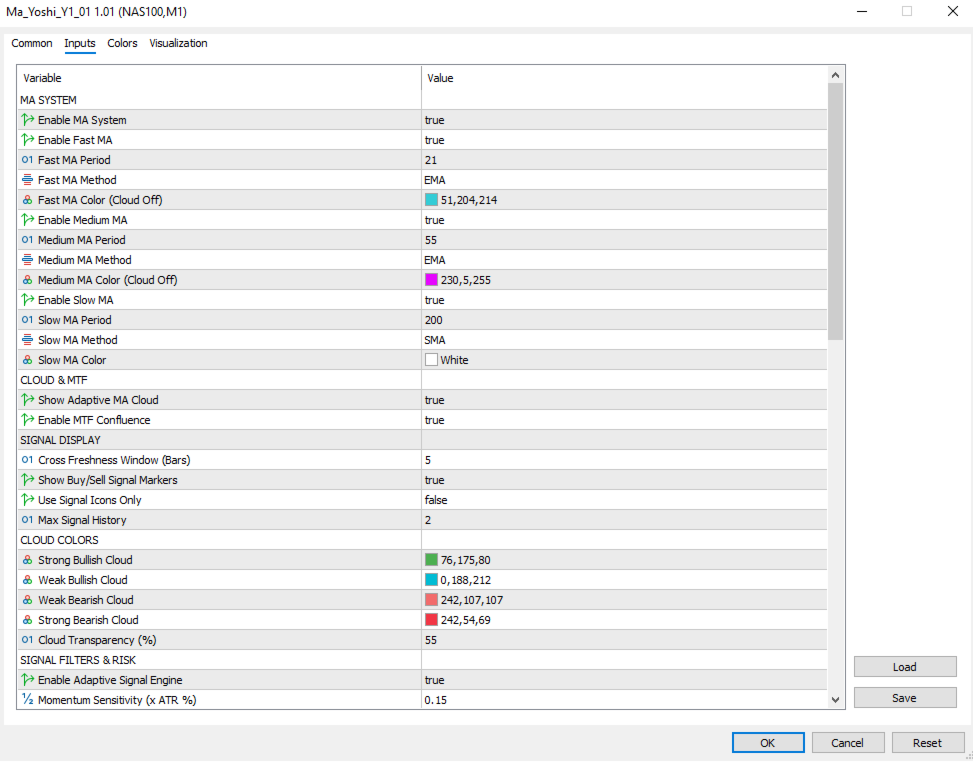
Fast and Medium moving averages form the adaptive cloud, while an optional Slow MA can provide broader bias. Six methods are available: EMA, SMA, WMA, VWMA, RMA and HMA.

Instead of showing only which average is above the other, the cloud summarizes four states: strong bullish, weak bullish, weak bearish and strong bearish. Its momentum threshold can adapt to ATR-based volatility, helping the framework respond as market speed changes.

The indicator also compares cloud width with current volatility. When the averages become too compressed, the dashboard can identify a range-bound or choppy regime. This does not remove every false crossover, but it gives the trader a reason to pause before treating each signal as equally meaningful.

Key features

• Configurable Fast, Medium and optional Slow moving averages

• Volatility-aware four-state MA cloud

• Six-timeframe confluence across M5, M15, H1, H4, D1 and W1

• Buy and Sell crossover events confirmed after the chart candle closes

• Cloud Retest signals for pullback continuation setups

• Signal Quality assessment using alignment, volume, cloud strength, MA separation and freshness

• Candlestick context with Three-Line Strike, Momentum Engulfing and Pin Bar observations

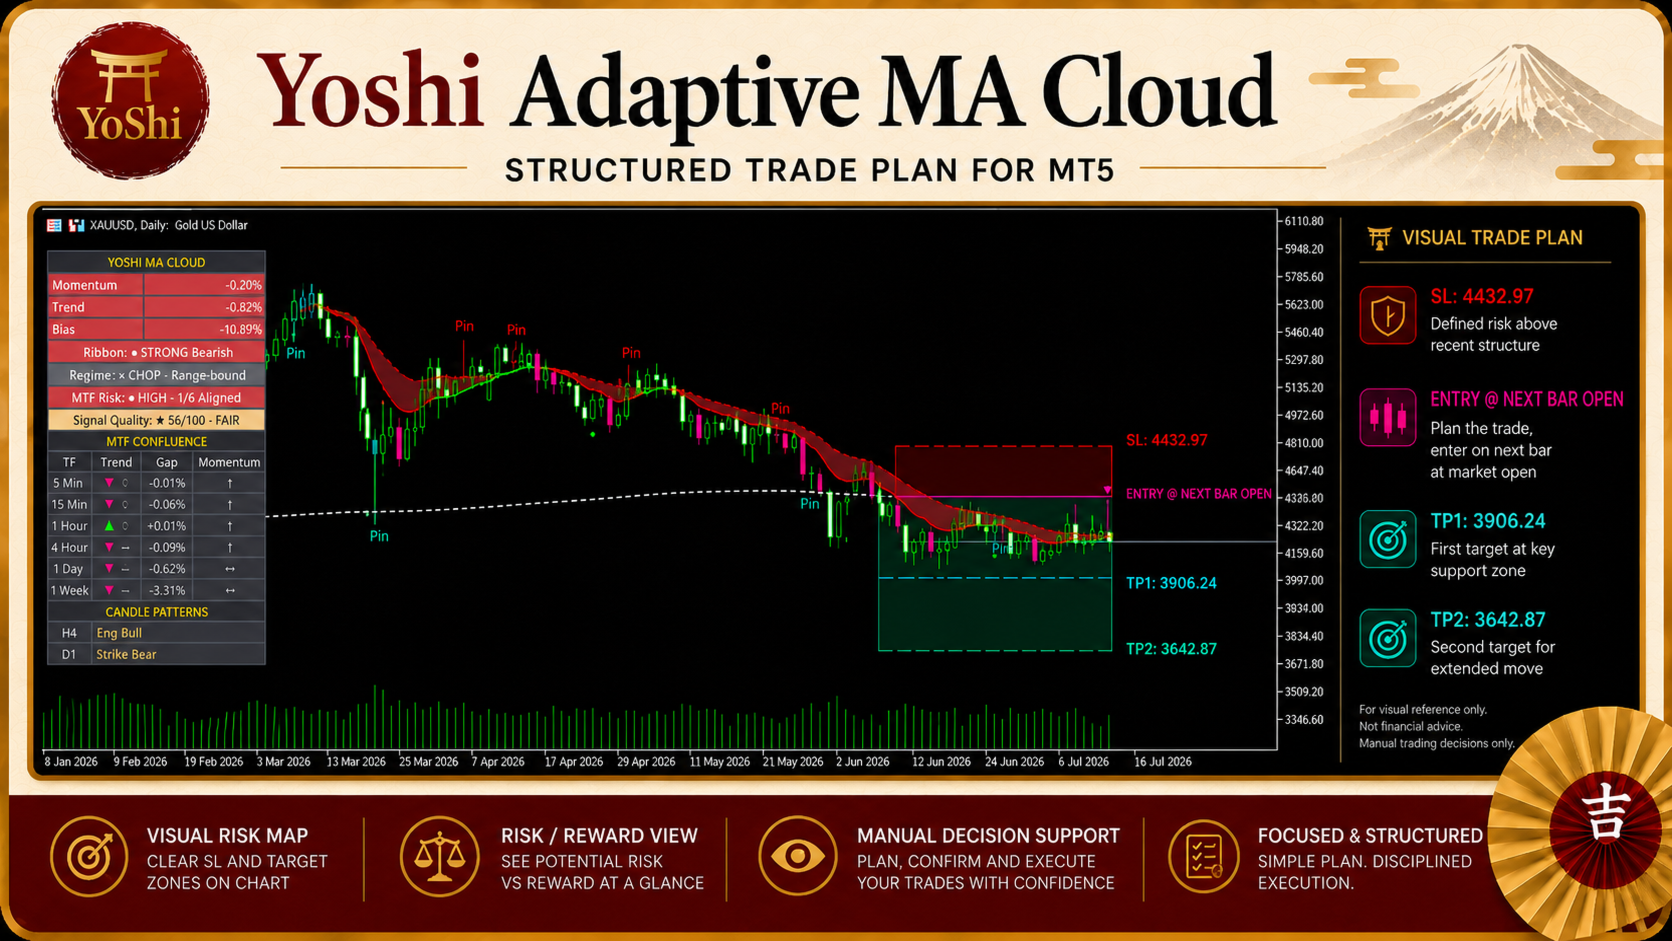
• Visual Trade Plan with Entry, Stop Loss, TP1 and TP2 references

From signal to context

A Buy or Sell marker should not be treated as a command. Yoshi Adaptive MA Cloud separates the signal event from the surrounding market context.

The multi-timeframe dashboard shows whether Fast and Medium averages are aligned across six fixed timeframes. MA distance rows show where price sits relative to the selected averages. Volume context, cloud strength and MA separation are combined into a structured Signal Quality score.

This score is a confluence assessment, not a win-rate forecast. It helps compare a fresh crossover in a clean trend with one appearing during compressed or conflicting conditions.

Cloud Retest signals provide a second setup type. They look for price to pull back into the cloud and close back outside it in the prevailing direction. This can suit traders who prefer continuation entries rather than entering at the first crossover.

A practical workflow

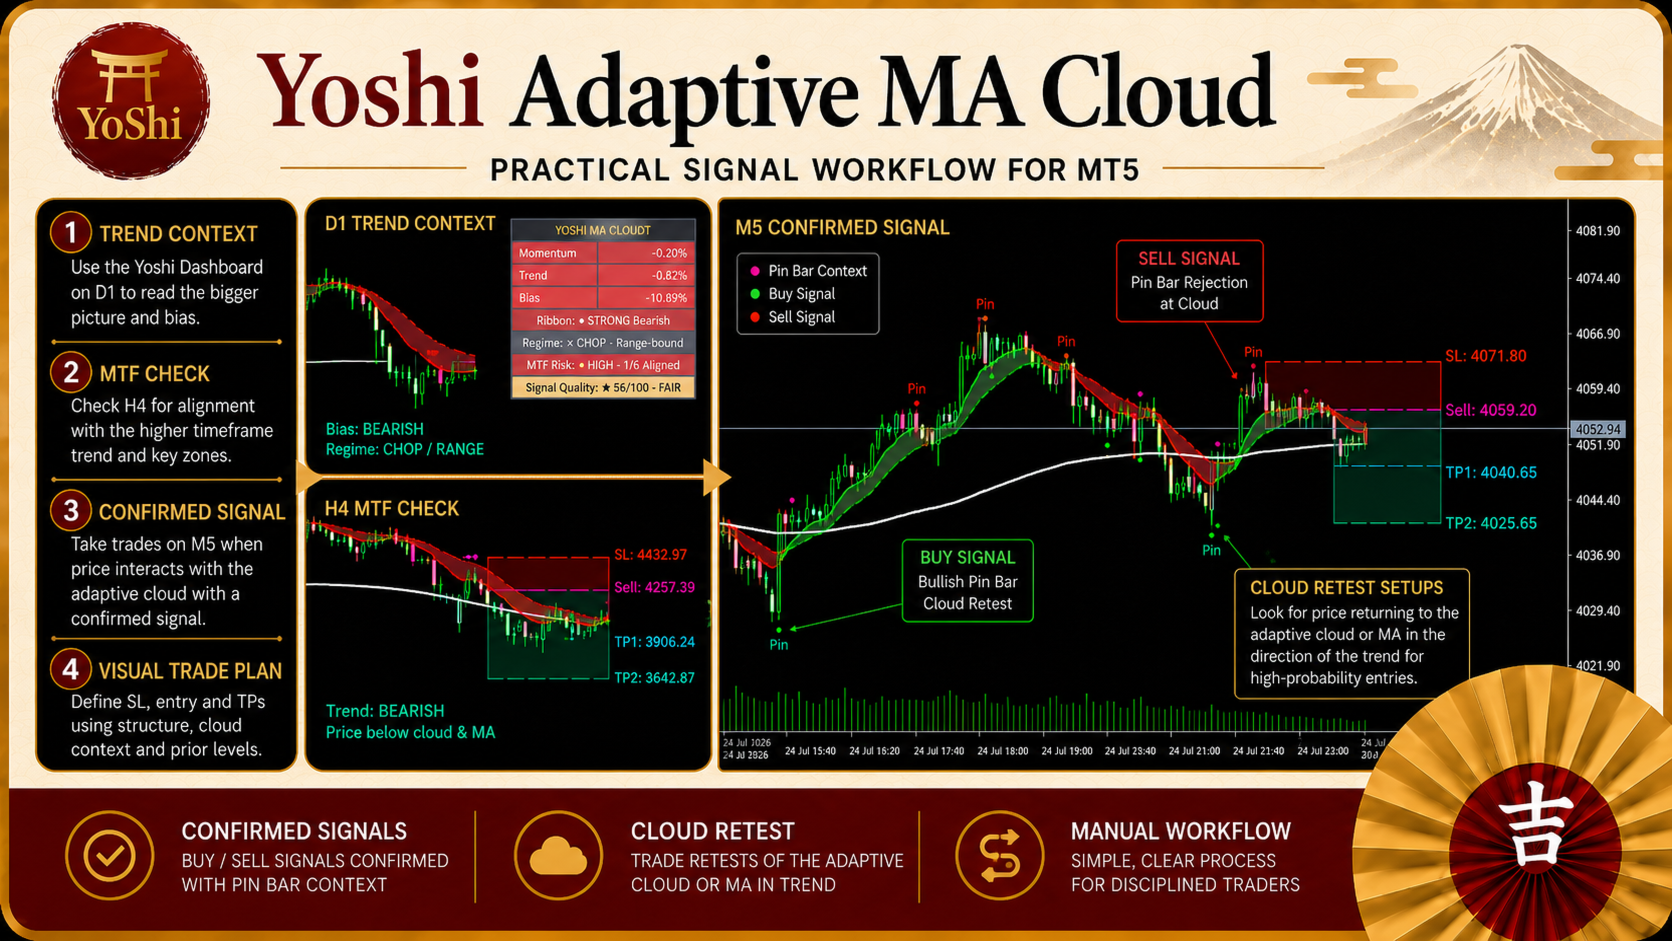
1. Start with the cloud state and optional Slow MA to understand directional context.

2. Check the regime row. A clean trend and a compressed range should not be approached in the same way.

3. Review multi-timeframe alignment instead of judging the setup from one chart alone.

4. Wait for a confirmed crossover or Cloud Retest, then assess volume, MA distance, pattern context and Signal Quality.

5. Review the visual Entry, Stop Loss and target references, and act only when the setup fits your method and risk limits.

Visual planning without automatic execution

When the selected setup creates a Trade Plan, the indicator can draw Entry, Stop Loss, TP1 and TP2 levels together with risk and profit zones. Only one active plan is maintained at a time, keeping the chart focused on the current idea.

Optional popup, push, email and sound notifications can inform the user when a new Trade Plan is created. These notifications support timely chart review; they are not automated orders.

Who may find it useful

Yoshi Adaptive MA Cloud is intended for manual traders who use trend-following, crossover or pullback methods and want a structured way to evaluate context. It can support intraday and higher-timeframe analysis on selected liquid markets, but settings and behavior should be tested for each symbol and timeframe.

The indicator is not designed for blind signal following, exact top or bottom prediction, or guaranteed outcomes. Moving averages remain lagging tools, and sideways markets can still be difficult.

Important risk note

Trading involves risk. Use the indicator as a decision-support tool, test it in the MetaTrader 5 Strategy Tester or on a demo account, and apply independent confirmation, position sizing and disciplined risk management.

More strategy tools Explore more strategy indicators and trading tools on the Yoshi MQL5 Seller page
Önerilen ürünler
First Dawn MT5
Innovicient Limited
The First Dawn indicator uses a unique mechanism to search and plot signals. This keeps searching for signals, making it a great indicator for scaping and identification of changes in direction, swing trading and trend trading. The    First Dawn     helps you get early signals. The backtest gives the true picture of how the indicator works with real/demo accounts. Although this is a tiny indicator it is packed with advantageous settings that will help you whether you desire to: Snap the Peaks a
ADR Uyarı Gösterge Tablosu, normal ortalama günlük aralığa göre fiyatın şu anda nerede işlem gördüğünü bir bakışta size gösterir. Fiyat, ortalama aralığı ve seçtiğiniz seviyenin üzerindeki seviyeleri aştığında, açılır pencere, e-posta veya push yoluyla anında uyarılar alacaksınız, böylece hızlı bir şekilde geri çekilmelere ve geri dönüşlere atlayabilirsiniz. Çizgi, boş bir çizelgeye yerleştirilmek üzere tasarlanmıştır ve sadece arka planda oturun ve seviyelere ulaşıldığında sizi uyarır, böylece
Vertex Structure Dashboard delivers a complete multi-timeframe market structure analysis in a single, compact panel. It monitors up to 9   timeframes simultaneously and displays trend bias, structural breaks, momentum, and value zones in real time — no tab-switching, no manual   tracking.   The panel is fully draggable and collapsible. Its position persists across timeframe changes through GlobalVariables, so your layout stays   exactly where you placed it.   How It Works   Each enabled tim
Better RSI With Tester
Mohammad Taher Halimi Tabrizi
Category: Trend Indicator Platform: MetaTrader 5 Type: Entry Indicator Timeframes: All Trader Styles: Scalping, Day Trading, Swing Trading, Binary Options Markets: All Description This indicator is an enhanced version of the Relative Strength Index (RSI) with additional features for visual clarity and cycle detection. It is designed to provide traders with a clearer view of momentum conditions and potential turning points. Main features: Improved RSI Visualization – The indicator displays RSI va
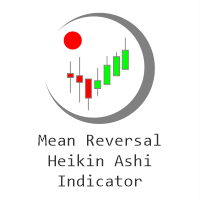
Mean Reversal Heikin Ashi Indicator calculates special trade reversal points based on Heikin Ashi candlesticks patterns. This indicator can be used on all symbols, even in Forex or B3 Brazillian Markets. You can configure just the position of each arrow. Then, after include the indicator on the graphic, pay attention on each arrow that indicates a long or short trade.
VanguardBot
Marius Ovidiu Sunzuiana
The  VanguardBot indicator  and its panel is a high‑precision market intelligence module designed to give traders a real‑time, multi‑factor audit of market conditions. It transforms raw price action , volatility behavior, cross‑asset correlations, and multi‑timeframe structure into a single, unified decision framework. Every metric is engineered to help traders understand what the market is doing right now , how strong that behavior is , and whether continuation or reversal is statistically more
Veltrion Smart Fibonacci   is a clean automatic Fibonacci structure overlay for MetaTrader 5. It automatically detects recent swing highs and swing lows, then draws key Fibonacci retracement levels directly on the chart. The indicator is designed to help traders visualize market structure, retracement zones, and the golden zone without manually drawing Fibonacci tools. Key Features Automatic swing high and swing low detection Clean Fibonacci retracement overlay Horizontal Fibonacci levels for a
The Plasma Trend indicator is a simple technical indication that is used to determine the current trend direction in the market. The Plasma Trend indicator is a powerful tool for determining the direction of the trend in the Forex market. It is based on both standard technical indicators and proprietary mathematical calculations, which provides a more accurate and reliable trend determination. Its implementation in the form of lines of two colors simplifies the visual determination of a change
Over Trend MT5
Mansour Babasafary
Trend based indicator Identify trends with this indicator A simple-to-use trend indicator No complicated settings Attributes: Can be used in all symbols Can be used in all time frames Relatively high signals No complicated settings Specific to the trend Lifetime support Settings: Alarm Show Alert: By activating these settings, after receiving the signal, you will receive an alarm in Metatrader Alarm Show Notification: By activating these settings, after receiving the signal, you will receive a
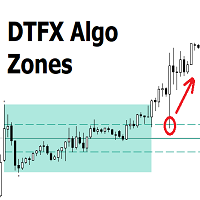
DTFX Algo Zones are auto-generated Fibonacci Retracements based on market structure shifts. These retracement levels are intended to be used as support and resistance levels to look for price to bounce off of to confirm direction.   USAGE Figure 1 Due to the retracement levels only being generated from identified market structure shifts, the retracements are confined to only draw from areas considered more important due to the technical Break of Structure (BOS) or Change of Character (CHo
ToolBox 360 is the swiss knife of all indicators. It is full packed with useful tools to help you with your trading. It can be used to find best entry and exit points and help you to decide if you should open a trade or not. It shows market trends, candlestick formations outside / inside bars and you can sett time based allerts. Main features: Time based Fibonacci lines Choose a start and end time and the indicator shows you Fibonacci lines within the selected time range including range high a
MT5 için "Trend Giriş Histogramı" Crypto_Forex Göstergesi, Yeniden Boyama Yok. - Trend Giriş Histogramı göstergesi, Entry_bar (Giriş Çubuğu) görüntülendiğinde trend yönüne giriş sinyallerini aramak için kullanılabilir. - Bu göstergenin benzersiz bir özelliği vardır - hesaplamalar için hem fiyatı hem de hacmi kullanır. - Trend Giriş Histogramı 2 renkte olabilir: düşüş trendi için kırmızı, yükseliş trendi için mavi. - Sabit trendi gördüğünüzde (aynı renkte en az 10 ardışık histogram çubuğu) - En
This indicator works on atr with some edited . The AI ​​MACD FILTER indicator is used for confirmation. Certainly, the indicator contains an alert when the signal appears, and you use the exit of the deal on the saturation that occurs at the AI ​​MACD. The accuracy of the work is high on gold, the time frame is five minutes, while staying away from trading at the time of news that occurs on the US dollar. And using high liquidity trading times, which are two hours before the opening of the Lond
Holiday Sales Zones Indicator The Zones Indicator is your everyday Trading tool that  leverages advanced algorithms, including ICT institutional concepts like order blocks , engulfing candle patterns , and Level interactions , to identify critical levels of supply and demand (Resistance & Support). Visual signals are generated and clearly marked on the chart, providing a straightforward guide for traders to spot key opportunities. Key Features Advanced Algorithmic Analysis : Identifies supply
Teklif Fiyatı Zamanlayıcı Göstergesi — Hassas Zamanlama ve Akıllı Fiyat Takibi! Teklif Fiyatı Zamanlayıcı Göstergesi ile işlem hassasiyetinizi bir üst seviyeye taşıyın — her hareketinde zamanlamayı, hassasiyeti ve netliği önemseyen trader’lar için tasarlanmış güçlü bir araç. Öne Çıkan Özellikler: Sabit Zamanlayıcı Ekranı – Grafiğinizin sağ tarafında her zaman görünür (özelleştirilebilir X_Offset). Dinamik Fiyat Takibi – Zamanlayıcı, teklif fiyatını gerçek zamanlı olarak takip e
ROC acceleration-deceleration is the manual system for medium-term scalping. Indicator based on custom ROC system which defines bullish/bearish market and especially  acceleration-deceleration of tendention in the market's main direction. Buy arrow is plotted during bearish market when current trend decelerates and sell  arrow is plotted during bullish market when current trend decelerates. Main Indicator's Features Signals are not repaint,non-late or disappear(exept cases when system recalculat
MFOP Market Forecast
Oscar Josue Pin Bacuzoy
Develop this indicator for periods of 30 minutes or more, focus on getting market trends right and making sure they are met. MFOP v8.1 gets straight to the point: it scans the market and tells you exactly when there is enough strength to enter a trade. This indicator doesn't do magic, it uses mathematical algorithms to filter out market noise, not enter into false breakouts and show you clear BUY (blue arrow) and SELL (red arrow) opportunities. It is designed and optimized specifically to take
Yawabeh SD Pro –  Professional Supply and Demand Indicator Trade Smarter with Volume-Confirmed Supply/Demand Zones Our institutional-grade algorithm identifies high-probability reversal zones before price reacts, giving you the edge in Forex, Crypto, and Stocks. Key Features Multi-Timeframe Confirmation – View trend strength across multiple timeframes simultaneously – Align your trades with higher timeframe momentum Smart Alert System – Real-time notifications for: – Strong demand/supply zone
Pattern Builder Pro — MetaTrader 5 için Özel Swing Formasyon Tarayıcısı Pattern Builder Pro, işlemcilerin elle herhangi bir özel swing formasyonu çizmesine ve Market Watch'taki tüm sembollerde, birden fazla zaman diliminde, istatistiksel olarak benzer fiyat formasyonlarını taramasına olanak tanıyan bir MetaTrader 5 göstergesi ve piyasa tarayıcısıdır. Omuz-baş-omuz, üçgen veya bayrak gibi sabit şekillerle sınırlı klasik grafik formasyonu göstergelerinin aksine, bu MT5 formasyon tanıma aracı kendi
DoubleBB MARSI — All-in-One Chart Tool Optimized for Day Trading Your price position · Market sentiment · Entry signals — all on one screen In One Line DoubleBB MARSI integrates the three essentials of day trading — daily reference levels · RSI sentiment · Double Bollinger Band signals — into a single chart, helping traders make faster and more confident decisions. Three Benefits You Get DoubleBB MARSI is more than a basic indicator — it gives you everything you need across the entire da
Orderflow Super Candles - Simple Footprint Chart Indicator Platform: MetaTrader 5 (MT5)  (The last screenshot shows the use of the DOM tool in conjunction with the product.) 1. Product Introduction Orderflow Super Candles is a professional charting tool based on underlying Tick data analysis, designed to provide traders with a deep "X-ray" view of the market. By parsing the buy and sell volume distribution within each candlestick, this indicator visualizes the hidden market microstructure. It
The indicator determines the state of the market: trend or flat. The state of the market is determined by taking into account volatility. The flat (trading corridor)is displayed in yellow. The green color shows the upward trend. The red color shows the downward trend. The height of the label corresponds to the volatility in the market. The indicator does not redraw . Settings History_Size   - the amount of history for calculation. Period_Candles  - the number of candles to calculate the indicat
This indicator has a unique support and resistance calculation program, which is a unique trading system. Index characteristics Imagine if you can accurately determine the important trading support and resistance areas and points in advance, how will your trading improve? Based on a unique calculation method, the indicator analyzes the trend, analyzes the current support and resistance, and obtains the current important support resistance and single direction, the calculated stop profit and sto
This is the Super Trend Dashboard MT5. This dashboard will scan multiple timeframes in MT5 platform, from M1 chart to D1 chart. It will send the buy/sell signals by alert on the platform or sending notification to your phone or message you via a email. The buy signal is generated when the super trend line flip from SELL to BUY. The sell signal is is generated when the super trend line flip from BUY to SELL. The up trend color will be displayed depending on the current Super Trend value.
Here’s a tight ~300-character text : A trendline break signals a potential shift in market direction. However, entry should only be taken after a confirmation candle. A strong bullish or bearish close beyond the trendline validates the breakout and reduces false signals, improving trade accuracy and confidence.    ShowPatterns ShowBullEngulf ShowBearEnguIf ShowHammer ShowShootingStar ShowMorningStar ShowEveningStar ShowMarubozu
The indicator monitors the Dinapoli MACD trend in multiple timeframes for the all markets filtered and shows the results on Dashboard. Key Features Indicator can be used for all markets Monitors every timeframe, from 1 Min to Monthly Parameters UseMarketWatch: Set true to copy all symbols available in market watch MarketWatchCount : Set the number of symbols that you want to copy from the market watch list. CustomSymbols: Enter the custom symbols that you want to be available in dashboard. Ti
Multi Indi Signal Mhw
Muhammad Amir Azri Bin Samani
Multi Indi Signal Mhw is a multi-timeframe analysis and signal indicator for MetaTrader 5. It combines Support Becomes Resistance Zones (SR Flip), Fibonacci, BBMA and a Confirmation Zone Meter into one tool. Instead of reading each tool separately on several charts, the indicator analyses them together across timeframes and gives a BUY or SELL signal only when they agree. SR Flip zones is used to identify entry zones with the potential to become strong entry points with less floating loss . Fibo
Product Name: FXmans Pro SMC Structure Description: Navigate the markets with institutional precision. FXmans Pro SMC Structure is an advanced, algorithmically optimized indicator designed to decode Smart Money Concepts (SMC) directly on your chart. Built on a highly secure and lightweight engine, this tool avoids the lag of standard pivot points by utilizing Bill Williams' Fractal logic for laser-accurate market structure mapping. Whether you are a day trader or a swing trader, this indicator f
MTF Connecting Fractals Multi-Timeframe Market Structure. One Glance. Real Decisions. MTF Connecting Fractals is not just another arrow-printing indicator. It’s a complete multi-timeframe market structure intelligence system designed to answer the most important trading questions in real time - clearly, visually, and without clutter. Built around fractals as objective structure anchors, this tool gives traders a decisive edge by combining price action, structural context, proximity risk, and
In the context of trading, Malaysia SNR (Support and Resistance) refers to the technical analysis of support and resistance levels in financial markets, particularly for stocks, indices, or other assets traded. This is single timeframe version. Multiple timeframe version is avaiable here . There are three type of Malaysia SNR level Classic , GAP and Flipped 1. Classic Support is the price level at which an asset tends to stop falling and may start to rebound. It acts as a "floor" where demand is
Bu ürünün alıcıları ayrıca şunları da satın alıyor
ARIPoint
Temirlan Kdyrkhan
1 (4)
ARIPoint is a powerful trading companion designed to generate high-probability entry signals with dynamic TP/SL/DP levels based on volatility. Built-in performance tracking shows win/loss stats, PP1/PP2 hits, and success rates all updated live. Key Features: Buy/Sell signals with adaptive volatility bands Real-time TP/SL/DP levels based on ATR Built-in MA Filter with optional ATR/StdDev volatility Performance stats panel (Success, Profit/Loss, PP1/PP2) Alerts via popup, sound, push, or email Cu
Boba Analysis Suite
Trade Ready Solutions LLC
5 (2)
Boba Analysis Suite Boba Analysis Suite, MetaTrader 5 için geliştirilmiş bir analiz göstergesidir. Piyasa yapısını, önemli fiyat bölgelerini ve genel piyasa bağlamını tek bir grafik görünümünde bir araya getirir. Trader ve trading eğitmeni olarak edinilen uygulamalı deneyimden yola çıkarak geliştirilmiştir. Piyasanın yönünü değerlendirme, önemli seviyeleri belirleme ve birden fazla zaman dilimini birlikte inceleme gibi adımlardan oluşan sistematik bir analiz sürecini destekler. Piyasa Bağlamını
Neuro Poseidon MT5
Daria Rezueva
4.75 (52)
Neuro Poseidon is a new indicator by Daria Rezueva. It combines precise trading signals with adaptive TP/SL levels - creating best possible trades as a result! Message me and get  Neuro Poseidon Assistant  as a gift to automize your trading process! What makes it stand out? 1. Proven profitability on all assets and timeframes 2. Only confirmed BUY and SELL signals present on the chart 3. Adaptive TP & SL levels generated by the software for each trade 4. Easy to understand - suitable for al
Azimuth Pro
Ottaviano De Cicco
5 (7)
Azimuth Pro V2: Synthetic Fractal Structure and Confirmed Entries for MT5 Overview Azimuth Pro is a multi-level swing structure indicator by Merkava Labs . Four nested swing layers, swing-anchored VWAP, ABC pattern detection, three-timeframe structural filtering, and closed-bar confirmed entries — one chart, one workflow from micro-swings to macro-cycles. This is not a blind signal product. It is a structure-first workflow for traders who care about location, context, and timing. Halloween P
Matreshka
Dimitr Trifonov
5 (2)
Matreshka self-testing and self-optimizing indicator: 1. Is an interpretation of the Elliott Wave Analysis Theory. 2. Based on the principle of the indicator type ZigZag, and the waves are based on the principle of interpretation of the theory of DeMark. 3. Filters waves in length and height. 4. Draws up to six levels of ZigZag at the same time, tracking waves of different orders. 5. Marks Pulsed and Recoil Waves. 6. Draws arrows to open positions 7. Draws three channels. 8. Notes support and re
Merhaba yatırımcılar! Birçok bireysel yatırımcı yavaş web komut dosyaları kullanıyor. Kârlı işlem yapmak için sistematik bir yaklaşım şarttır. Astro AI göstergesi sadece bir grafik üzerindeki görselleştirme değildir. Doğrudan terminal içinde çalışan iki ajandan oluşan gelişmiş bir sinir ağıdır. Sistemin teknik detayları: 1. Ajan 1: Analist (Grafiksel Sinir Ağı – GNN) Piyasa, tek tek fiyat çubuklarından değil, birbirine bağlı verilerden oluşan bir ağdan oluşur. İşlev: Ajan 1, bu karmaşık, d
RelicusRoad Pro MT5
Relicus LLC
4.96 (25)
İşlemlerinizi tahminle yapmayı bırakın. Ne zaman gireceğinizi, nereden çıkacağınızı ve piyasanın hangi yöne eğildiğini, hepsini tek grafikte görün. RelicusRoad Pro, neredeyse yirmi aracı tek bir göstergede toplar; işlem tarzınıza uyan araçları açarsınız. Net girişler. Net çıkışlar. Her grafikte bir plan. Tanıdık geliyor mu? Alım yaparsınız, bir dakika sonra fiyat aleyhinize döner. Erken kapatırsınız, sonra hareketin sizsiz devam ettiğini izlersiniz. Grafikte beş gösterge, beş farklı cevap. Zarar
UZFX {SSS} Scalping Smart Signals v5.0 MT5, hızlı hareket eden piyasalarda doğru ve gerçek zamanlı sinyaller bekleyen scalperlar, günlük işlemciler ve swing işlemciler için tasarlanmış, yeniden çizilmeyen yüksek performanslı bir işlem göstergesidir. (UZFX-LABS) tarafından geliştirilen bu gösterge, fiyat hareketi analizi, trend teyidi ve akıllı filtrelemeyi bir araya getirerek tüm döviz çiftleri ve zaman dilimlerinde yüksek olasılıklı alım ve satım sinyalleri, Uyarı Sinyalleri ve Trend Devam Fırs
ARICoins
Temirlan Kdyrkhan
ARICoin is a powerful trading companion designed to generate high-probability entry signals with dynamic TP/SL/DP levels based on volatility. Built-in performance tracking shows win/loss stats, PP1/PP2 hits, and success rates all updated live. Key Features: Buy/Sell signals with adaptive volatility bands Real-time TP/SL/DP levels based on ATR Built-in MA Filter with optional ATR/StdDev volatility Performance stats panel (Success, Profit/Loss, PP1/PP2) Alerts via popup, sound, push, or email Cust
AriFocus
Temirlan Kdyrkhan
AriFocus - Non-Repainting Buy/Sell Signals AriFocus - one clear signal. AriFocus marks buy and sell signals directly on the chart and suggests a stop-loss level for each one. Every signal is confirmed on bar close and never repaints. - Buy/sell arrows, confirmed on bar close - Suggested stop-loss level for every signal - Trend band and candle coloring to show direction at a glance - 10 ready-made presets, or your own settings (14 calculation methods) - Pop-up, push and email alerts with entr
Spike Fakeout Detector
Brighton Mufaro Mudzingwa
PainX 400 FAKEOUT DETECTOR MT5 Custom Indicator  ·  Sell-Side Bias  ·  Scalping  ·  RSI(6) Filtered   OVERVIEW   The Spike Fakeout Detector is a non repaint precision technical indicator built exclusively for Crash / PainX synthetic indices on the platform. It is engineered around one of the most consistent and exploitable patterns on this instrument — the false breakout above resistance followed by a sharp price drop. Crash/PainX is a growing index that produces a significant price drop appr
OrderFlow Absorption – MT5 için Profesyonel Delta ve Absorpsiyon Sinyal Göstergesi OrderFlow Absorption ile gerçek emir akışı analizinin gücünü keşfedin – MetaTrader 5 için nihai delta histogramı ve absorpsiyon sinyal göstergesi. Fiyat hareketlerinin arkasında gerçekte neler olduğunu görmek isteyen traderlar için tasarlanan bu araç, piyasayı hareket ettiren gizli alım/satım baskısını ve absorpsiyon olaylarını ortaya çıkarır. Özellikler Delta Histogramı Görselleştirme:   Alım ve satım baskısını a
CGE Trading Suite
Carl Gustav Johan Ekstrom
5 (2)
Institutional-Grade Analytics for MT5 The full analytical edge of a professional trading desk, built into your MT5 chart. A full guided tour walks you through every feature step by step. Live Signal:   Daily Capital Flow Bets , automated trading driven by the CGE Trading Suite's analysis. Standard retail platforms lack the depth required for professional market analysis. The CGE Trading Suite bridges this gap, transforming MetaTrader 5 into a comprehensive workspace. By integrating 18 proprieta
Ace Trend
Mikhail Sergeev
5 (3)
Size trend ticareti dünyasında oyunun kurallarını değiştiren devrim niteliğinde bir gösterge sunuyoruz. Gösterge, performansı yeniden düşünmek ve ticaret deneyiminizi benzeri görülmemiş bir yüksekliğe çıkarmak için tasarlanmıştır. Göstergemiz, onu rakiplerinden ayıran benzersiz bir gelişmiş özellik kombinasyonuna sahiptirize trend ticareti dünyasında oyunun kurallarını değiştiren devrim niteliğinde bir gösterge sunuyoruz. Gösterge, performansı yeniden düşünmek ve ticaret deneyiminizi benzeri gör
Gem SIGNAL
Shengzu Zhong
5 (1)
GEM Signal Pro GEM Signal Pro, MetaTrader 5 için geliştirilmiş bir trend takip göstergesidir ve daha net sinyaller, daha düzenli işlem kurulumları ve daha pratik risk yönetimini doğrudan grafik üzerinde görmek isteyen yatırımcılar için tasarlanmıştır. Sadece basit bir ok göstermek yerine, GEM Signal Pro işlem fikrinin tamamını daha temiz ve daha okunabilir bir şekilde sunmaya yardımcı olur. Koşullar onaylandığında, gösterge giriş fiyatını, stop loss seviyesini ve take profit hedeflerini grafik ü
MetaTrader 5 için Chimera Volume Gelişmiş Hacim Analizi ve Piyasa Aktivitesi Görselleştirme Chimera Volume, normalleştirilmiş hacim aktivitesini analiz etmek ve dinamik bir görsel çerçeve aracılığıyla piyasa katılımındaki değişiklikleri göstermek için tasarlanmış, MetaTrader 5'e özel bir göstergedir. Gösterge, tick hacim verilerini adaptif normalleştirme algoritmaları kullanarak işler ve hacim yoğunluğu, birikim evreleri ve farklı piyasa koşullarındaki aktivite değişimlerinin yapılandırılmış bir
Meravith Scanner
Ivan Stefanov
5 (3)
MERAVITH SCANNER, MetaTrader 5 için profesyonel bir finansal piyasa göstergesidir ve birden fazla analiz aracını tek bir entegre sistemde birleştirir. Tüm hesaplamaları, özel hacim ağırlıklı ortalama fiyat (VWAP) metodolojisini kullanarak otomatik olarak gerçekleştirir ve subjektif yorumları tamamen ortadan kaldırır. Bu gösterge, tüm varlık sınıflarında (Forex, Hisseler, Endeksler, Emtialar, Kripto Paralar) ve M1’den Aylık’a kadar tüm zaman dilimlerinde çalışır. Temel prensip, fiyatın hacmi taki
TrendMaestro5
Stefano Frisetti
note: this indicator is for METATRADER4, if you want the version for METATRADER5 this is the link:  https://www.mql5.com/it/market/product/108106 TRENDMAESTRO ver 2.5 TRENDMAESTRO recognizes a new TREND from the start, he never makes mistakes. The certainty of identifying a new TREND is priceless. DESCRIPTION TRENDMAESTRO identifies a new TREND in the bud, this indicator examines the volatility, volumes and momentum to identify the moment in which there is an explosion of one or more of these da
Meravith MT5
Ivan Stefanov
5 (3)
MERAVITH, MetaTrader 5 için çok zaman dilimli bir hacim ve likidite göstergesidir; her zaman diliminde trendi, destek ve direnç bölgelerini, girişi, hedefleri ve stop loss seviyesini gösterir. Size piyasanın tam bir likidite haritasını, hedge fon tarzı bir likidite aracını verir ve tüm hesaplamaları kendine özgü bir hacim ağırlıklı ortalama fiyat yöntemiyle otomatik yapar, bu yüzden öznel yorum yoktur. Forex, altın (XAUUSD), endeksler ve kriptoda, her zaman diliminde çalışır. Satın alma sonrası
Cycles Plotter
Edoardo Centorame
Cycles Plotter Hareketli Ortalamalar ve Başlangıç Tarihi ile Özelleştirilebilir Döngüler Göstergesi Cycles Plotter, yalnızca kullanıcının inputuna bağlı olarak tamamen özelleştirilebilir iki sinüzoidal döngü çizen gelişmiş bir teknik göstergedir. Döngüleri otomatik olarak üretmez: tüm döngüler yalnızca kullanıcı tarafından ayarlanan parametrelere göre hesaplanır, traderlara fiyat salınımlarını ve potansiyel trend değişikliklerini incelemek için görsel bir araç sunar, otomatik sinyaller veya tahm
Quantum Momentum Guard (QMG) Breakout and Momentum Indicator for MetaTrader 5 Overview Quantum Momentum Guard (QMG) is a technical indicator for MetaTrader 5 designed to identify potential breakout opportunities by combining momentum analysis, breakout conditions, and mathematical validation. The indicator evaluates market conditions to generate directional signals when its configured criteria are met. It is designed primarily for XAUUSD (Gold) and can also be used on other financial instruments
AriX
Temirlan Kdyrkhan
1 (4)
AriX Indicator for MT5 A powerful trend-following and signal-evaluation tool AriX is a custom MT5 indicator that combines Moving Averages and ATR-based risk/reward logic to generate clear buy/sell signals. It visualizes dynamic SL/TP levels, evaluates past trade outcomes, and displays win/loss statistics in a clean on-chart panel. Key features include: Buy/Sell signals based on MA crossovers ATR-based SL/TP1/TP2/TP3 levels with visual lines and labels Signal outcome tracking with real-time stat
Piyasanın Gerçekte Ne Yaptığını Görün.   3 piyasa evresini gözünüzün önünde canlı izleyin (Sıkışma, Genişleme, Trend) ve Trend evresinin erken aşamasında daha iyi   girişler yapın.      Tahmin etmeyi bırakın. Piyasayı kurumların ve akıllı paranın okuduğu gibi okumaya başlayın.   MT5 için Apex Market Structure Pro, gürültüyü ayıklayan ve her mumun altındaki gerçek yapıyı gösteren hassas bir akıllı para   analiz aracıdır: likidite, yapı değişimleri, birikim bölgeleri ve trend eğilimi — hepsi tek
Title:FX-AIEA Supply and Demand Zone Indicator (MT5) — Technical Overview Version: 2.51 | Platform: MetaTrader 5 Introduction Supply and demand zones are considered a core manifestation of institutional order flow, providing a more direct reflection of buying and selling pressure than traditional support/resistance levels. This indicator attempts to automate the identification of high-probability supply and demand zones using an adaptive ZigZag algorithm, reducing the subjectivity and time asso
ORB Seeker MT5
Marcela Goncalves De Oliveira
Ürünün sınırlı sayıda bulunmasını ve kıtlığını korumak için özel fiyat! Sadece 599 dolar! Satın alma işleminden sonra, bonus ORB Seeker EA ve kişisel olarak optimize edilmiş set dosyalarını almak için benimle iletişime geçin. Temiz antrenman seanslarında güvenle mola verin! ORB Seeker MT5, doğruluk, sadelik, esneklik ve net grafik yapısı isteyen yatırımcılar için tasarlanmış profesyonel bir Açılış Aralığı Kırılımı (ORB) göstergesidir. Otomatik olarak herhangi bir enstrüman için piyasa öncesi v
Volume Arrow Signal Product Description Volume Arrow Signal is a smart trading indicator designed to help traders identify potential buy and sell opportunities using price action, volume behavior, and directional arrow signals. The indicator places clear arrows directly on the chart, making it easy to spot possible market reversals, trend continuations, and entry opportunities without spending hours analyzing charts manually. Whether you are trading Gold (XAUUSD) , Forex pairs, Indices, or Crypt
Footprint is an indicator for order flow and volume analysis. It helps identify market structure at the cluster level, find key zones with increased activity, and work with filters directly on the chart without constantly opening the settings window. Footprint Indicator Features cluster-based Bid x Ask and Delta charts; on-chart control panel; sliders for filter adjustments; Absorption; Initiative; Stacked Imbalances; Big Trades; dPOC / Dynamic Point of Control; Delta; side market profile; cumul
Zain Gold ScalpingV5
Ahmed Gamal Abdel Nasser Mohamed
Zain Gold Scalping V5 is a technical analysis indicator for MetaTrader 5 designed for Forex and Gold markets. It provides chart-based market information, trend analysis, signal conditions, and an on-screen dashboard to help traders analyze price movement across multiple timeframes. Main Features The indicator supports multiple timeframes, including M1, M5, M15, M30, H1 and higher timeframes. It can be used with Gold (XAUUSD), Forex currency pairs, indices and other supported instruments. The in
IQ FX Gann Levels a precision trading indicator based on W.D. Gann’s square root methods . It plots real-time, non-repainting support and resistance levels to help traders confidently spot intraday and scalping opportunities with high accuracy. William Delbert Gann (W.D. Gann) was an exceptional market analyst, whose trading technique was based on a complex blend of mathematics, geometry, astrology, and ancient mathematics which proved to be extremely accurate. We don't offer free or bonus indic
KenKem Master Volume Profiler - Brief Introduction A Display-only volume-profile cockpit for XAUUSD, BTCUSD and other liquid symbols. Draws profile structure, multi-timeframe flow, EMA trend and study-only setup markers. Places no orders. Not a signal service.  It maps where the market has actually traded and reads recent order flow, so you can see structure and lean at a glance.  What it shows: Master and local volume profiles (POC and value-area high/low) - the price shelves that matter. A liv
Yazarın diğer ürünleri
Yoshi Pro Rejection Zones: A Smarter Way to Read Support, Resistance and Price Rejection on MetaTrader 5 In trading, one of the most important skills is knowing where the market is likely to react. Whether a trader focuses on forex, gold, indices, crypto, or CFDs, price often responds around meaningful support and resistance areas. These areas can become turning points, breakout zones, retest levels, or simply locations where traders should pay closer attention. The challenge is that most charts
FREE
Liquidity Delta Profiler Yoshi Read liquidity-zone interaction with a four-part relative delta view on MetaTrader 5 Many indicators draw a line and leave the trader to decide what the next touch means. In live trading, the difficult part is not locating every swing. It is judging how price behaves after it reaches an area where liquidity may be resting. A brief test, a decisive sweep and a failed breakout can look similar at first, yet they call for different decisions. Liquidity Delta Profiler
FREE
Yoshi Order Blocks and Breaker Blocks A structured MT5 framework for tracking Order Block zones and their transition into Breaker Blocks Key Features • Bullish and bearish Order Block visualization • Order Block to Breaker Block transition tracking • Adjustable Swing Lookback • Independent recent bullish and bearish zone controls • Full-candle or candle-body zone construction • Configurable zone colors and opacity • Optional Historical Polarity Stars with separate colors • Maximum Calculation Ba
FREE
Pinbar Yoshi Pro – Clean Multi-Timeframe Pin Bar Detection for MetaTrader 5 Pinbar Yoshi Pro is a clean and practical MT5 indicator designed for traders who use price action, candlestick rejection, support and resistance, market structure and multi-timeframe analysis in their daily trading routine. The purpose of this tool is simple: to help traders detect bullish and bearish Pin Bar candles more clearly, more consistently and with less manual chart scanning. In real trading, a Pin Bar is not
FREE
Yoshi Adaptive RSI Adaptive Confirmed Momentum for MetaTrader 5 Momentum tools are useful only when their signals are read in context. A standard RSI can react quickly to small price changes while the current candle is still forming. That may tempt traders to act before the move is confirmed. The real challenge is not simply finding an overbought or oversold reading, but understanding whether momentum is holding, weakening, or leaving an extreme area at a meaningful point on the chart. Yoshi Ada
FREE
Ichiyoshi Trend Pullback Framework for MT5 — Version 2.3 Holy Grail Inspired Trend-Pullback Indicator Ichiyoshi Trend Pullback Framework for MT5 — Version 2.3 is a professional trend-pullback indicator created for traders who want to read the market with structure, discipline and context. The framework is inspired by the practical logic of the well-known Holy Grail trend-pullback approach, widely associated with Linda Raschke’s professional trading philosophy. The idea is simple, but powerful: i
ORBYoshi V1.26 – Professional Opening Range Breakout Framework for MetaTrader 5 The Opening Range Breakout (ORB) is one of the most respected intraday trading concepts in modern market history. Popularized through the research and trading work of renowned traders such as Toby Crabel , Larry Williams , and Mark Fisher , the ORB methodology focuses on identifying directional opportunities that emerge after the market establishes its initial opening range. ORBYoshi was developed to bring this timel
Price Action Structure Yoshi for MetaTrader 5 Introduction Price Action Structure Yoshi is a professional Price Action and Market Structure Indicator designed for MetaTrader 5. This MT5 Indicator helps traders visualize market structure, liquidity areas, order blocks, liquidity sweeps, and trendline relationships directly on the chart in a clear and organized manner. Inspired by widely recognized Price Action Analysis and Market Structure concepts, the indicator focuses on helping traders unders
UT Bot Yoshi Trend ATR MT5 – Professional ATR Trailing Stop Trend Indicator for MetaTrader 5 UT Bot Yoshi Trend ATR MT5 is a professional trend-following indicator for MetaTrader 5, designed to help traders read market direction, follow volatility-based trailing stop behavior, and organize Buy/Sell trading ideas with a clean visual structure. The indicator is built around a practical and well-known trading concept: ATR trailing stop logic . Instead of trying to predict the market or identify per
ATR-based trend signals, structured trade planning and higher-timeframe price-action context in one MetaTrader 5 indicator. LTYoshi_Pro is a decision-support indicator built around an ATR trailing-stop engine. It is designed to help traders organize trend signals, risk levels and market context without mixing every chart element into a single automatic decision. The indicator separates its work into independent layers. The core engine produces raw Buy/Sell events when the selected price source
SMC ICT Yoshi v2.19 Smart Money Concepts, Market Structure, Order Blocks and Fair Value Gaps for MetaTrader 5 SMC ICT Yoshi v2.19 is a multi-layer Smart Money Concepts (SMC) and ICT-style market structure indicator for MetaTrader 5. It brings market structure, liquidity references, Order Blocks, Fair Value Gaps, premium and discount zones, higher-timeframe context and session timing into one clear analytical workflow. The product is designed for traders who want more than isolated BOS, CHoCH or
MA Yoshi Pro Moving Average Trend, Momentum and Price Action Confirmation for MetaTrader 5 A Clearer Way to Evaluate Trend Setups Many traders do not struggle because they lack indicators. The harder problem is deciding which information deserves attention, which signal should be ignored, and when it is better to wait. A moving average crossover may appear during a choppy phase. A strong candle may form in the wrong location. MA Yoshi Pro was created to bring these separate observations into o
Yoshi SMC Trend Planner Y02 for MT5 Market Structure, Trend Context and Structured Trade Planning for MetaTrader 5 Trade With Context, Not Isolated Signals A trading signal is easy to notice. The harder part is deciding whether that signal makes sense within the current market structure, price location and higher-timeframe direction. Many traders can identify a Buy or Sell arrow, yet still hesitate because the surrounding context is unclear. Yoshi SMC Trend Planner Y02 was designed to bring tho
Yoshi MTF Candlestick Patterns is a visual Price Action indicator for MetaTrader 5 that combines Three-Line Strike, Momentum Engulfing and closed-bar Pin Bar recognition in one clean chart workspace. A compact multi-timeframe panel reviews the latest closed candle on M1, M5, M15, M30, H1, H4 and D1, helping traders check candle-pattern context without repeatedly switching charts. Yoshi MTF Candlestick Patterns is a visual Price Action indicator for MetaTrader 5. It brings Three-Line Strike, Mome
Volatility-Adaptive Trend Signals and Visual Trade Planning for MetaTrader 5 TrendYoshi is a manual decision-support indicator for MetaTrader 5 that combines ATR-based trend states, clear Buy/Sell transitions, session context, alerts and structured visual trade plans. A Clearer Way to Move from Trend Signal to Trade Plan A direction change alone is rarely enough. Traders still need to know where the trend reference sits, how much room exists between entry and invalidation, whether the setup appe
Trading a pullback often looks simple after the move is complete. In real time, however, traders must decide which swing matters, where the retracement should be measured from, and whether price is returning to a meaningful area or merely moving through noise. Manual Fibonacci drawing can become inconsistent, especially when the market extends to a new high or low. Yoshi ICT Fibonacci OTE was created to bring more structure to that process. Product Overview Yoshi ICT Fibonacci OTE is a manual de
Market Structure, Liquidity and Price Action Analysis for MetaTrader 5 A chart can contain plenty of information and still leave a trader without a clear decision. A BOS label may appear, liquidity may be nearby, and an order block may remain active, yet the real challenge is understanding how those elements relate to one another. ICT Yoshi Pro organizes that process into a cleaner, more disciplined MetaTrader 5 workflow. What ICT Yoshi Pro Does ICT Yoshi Pro is a manual decision-support indicat
Structured ICT Market Analysis for MetaTrader 5 Reading a chart is rarely difficult because price lacks information. The real challenge is deciding which information matters now. A Break of Structure can support continuation, but the same event may mean something different near liquidity, inside an imbalance, or during an active session. Yoshi ICT Framework Y1.01 brings these elements into one organized MetaTrader 5 workspace, helping discretionary traders evaluate structure, location, timing, a
Reading market structure is rarely difficult because of the terminology. The real challenge is applying the same rules every time: deciding which swing matters, whether price has genuinely broken it, and what to do after a Break of Structure or Change of Character appears. Without a consistent process, charts become crowded and traders can react to isolated labels instead of evaluating the full setup. SMC Yoshi Pro is a market structure indicator for MetaTrader 5 built for manual traders who wan
Yoshi Opening Range Breakout Navigator Structured ORB Analysis for MetaTrader 5 Trading the Open Is Simple in Theory—Not in Practice The Opening Range gives intraday traders a clear starting point: define the early-session high and low, then observe how price behaves around those boundaries. The concept is straightforward. The execution is not. In live trading, ranges are often drawn inconsistently, an intrabar spike can be mistaken for a confirmed breakout, and traders may chase price before th
Filtrele:
Değerlendirme yok
Değerlendirmeye yanıt