Yoshi Adaptive MA Cloud

  • Indicateurs
  • Le Quang Thanh
    Le Quang Thanh
    Professional Trading Tools for MetaTrader 5
    I specialize in developing high-quality indicators and Expert Advisors for MetaTrader 5, inspired by well-known trading methodologies used by professional traders and market researchers around the world.
  • Version: 1.1
  • Activations: 10

A structured MT5 trend, momentum and pullback framework for clearer manual trading decisions

Moving-average trading often looks simple until the market becomes less cooperative. A crossover may appear after a move is extended, timeframes may disagree, and a clean signal can turn into whipsaw inside a narrow range. The challenge is rarely a lack of indicators. It is the lack of an orderly way to connect trend, momentum, market regime, confirmation and risk.

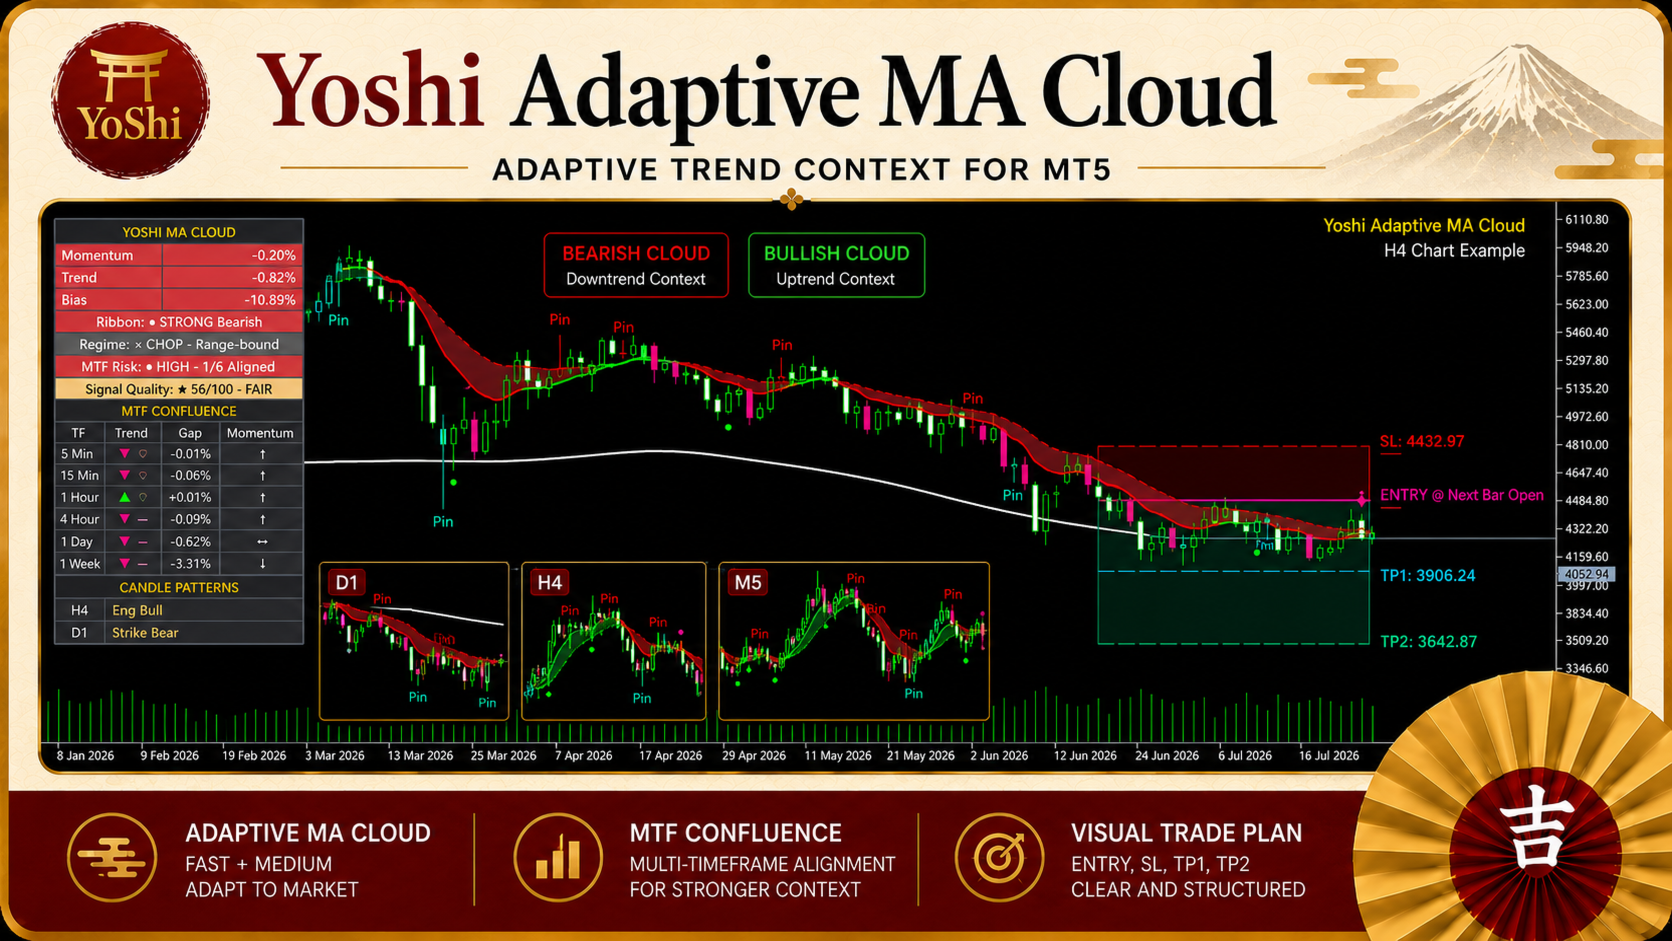
Yoshi Adaptive MA Cloud is a MetaTrader 5 indicator designed to organize those decisions in one practical chart workflow. It combines a configurable moving average cloud with volatility-aware momentum analysis, multi-timeframe context, confirmed signal events, candlestick information and a visual Trade Plan. It does not open or manage trades automatically. The final decision remains with the trader.

A clearer view of trend and regime

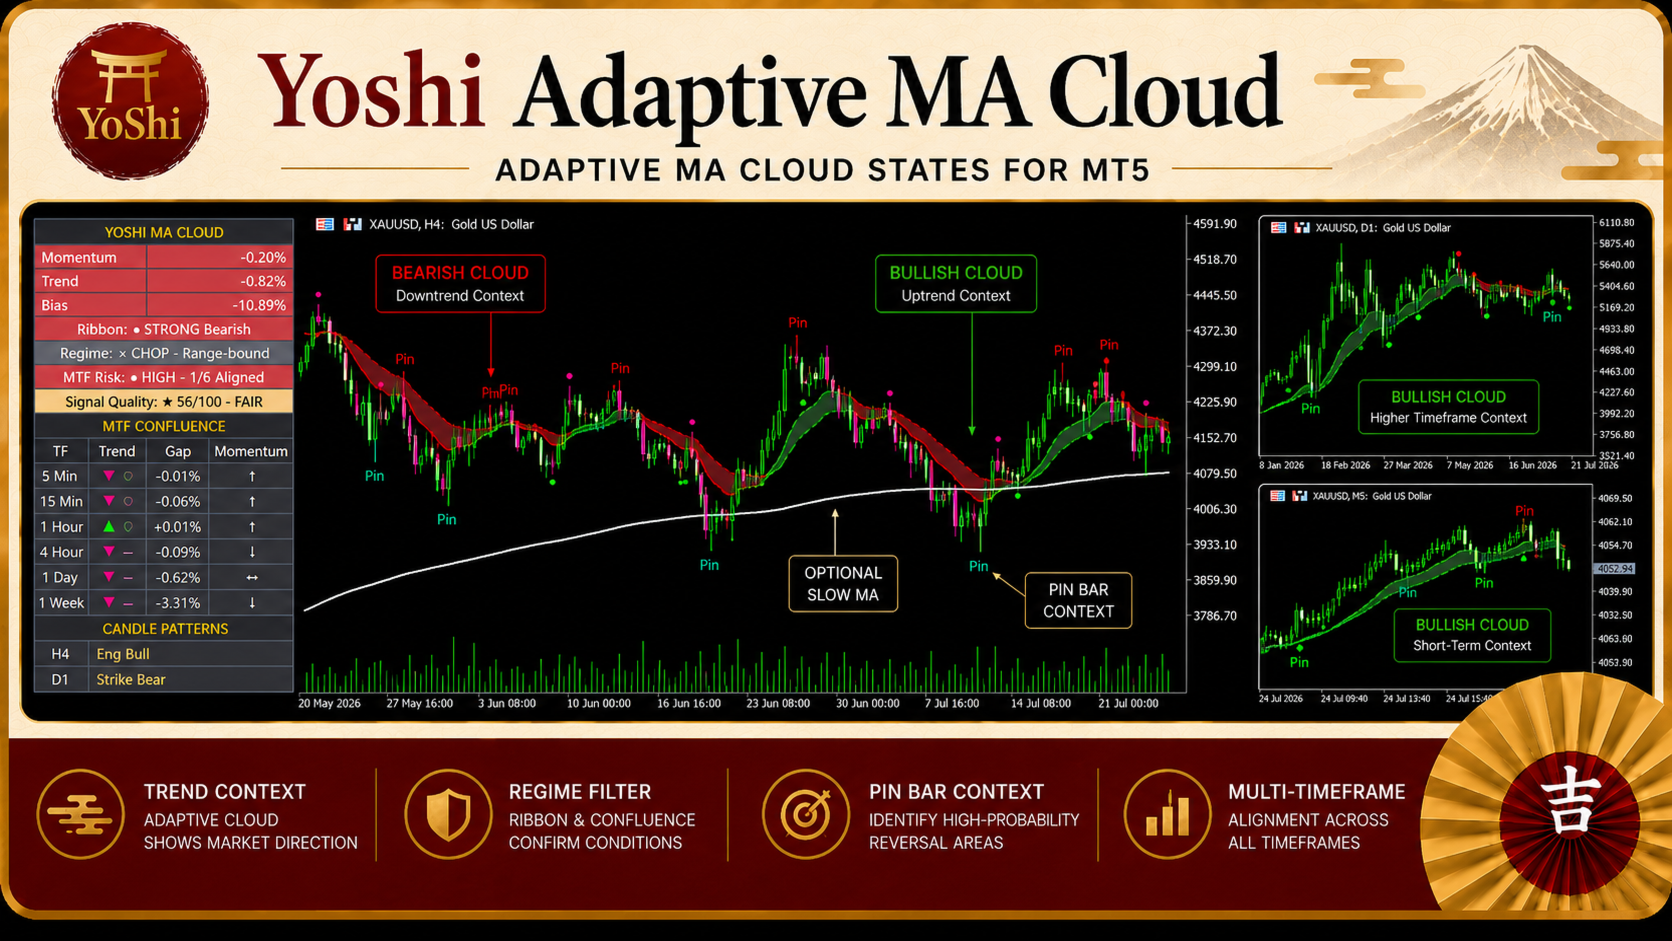
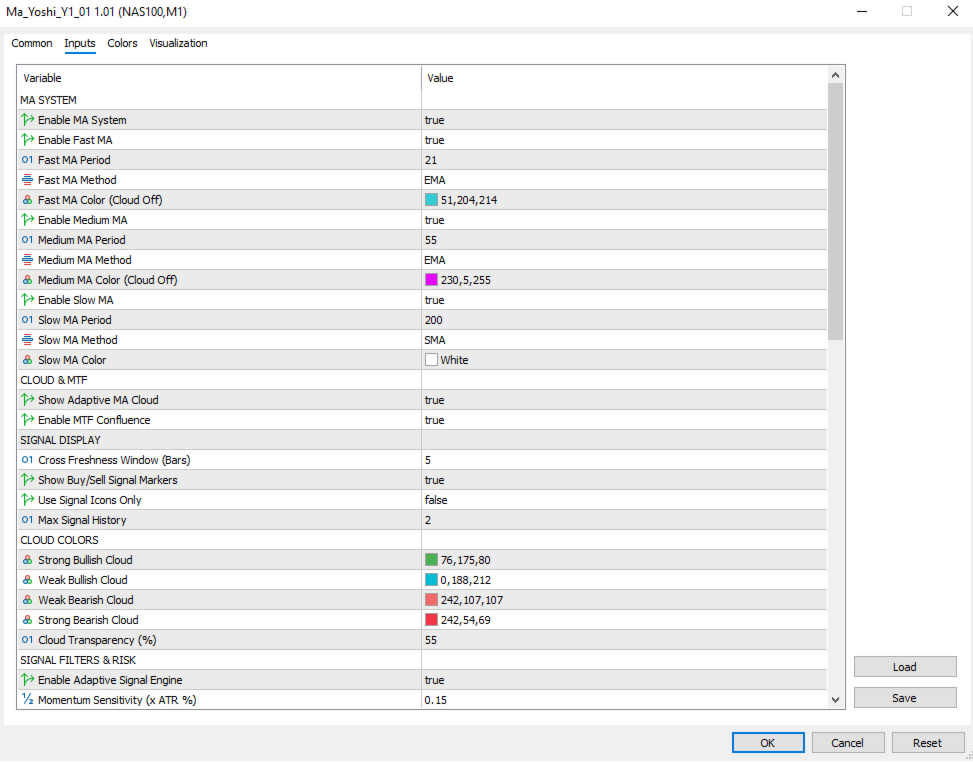
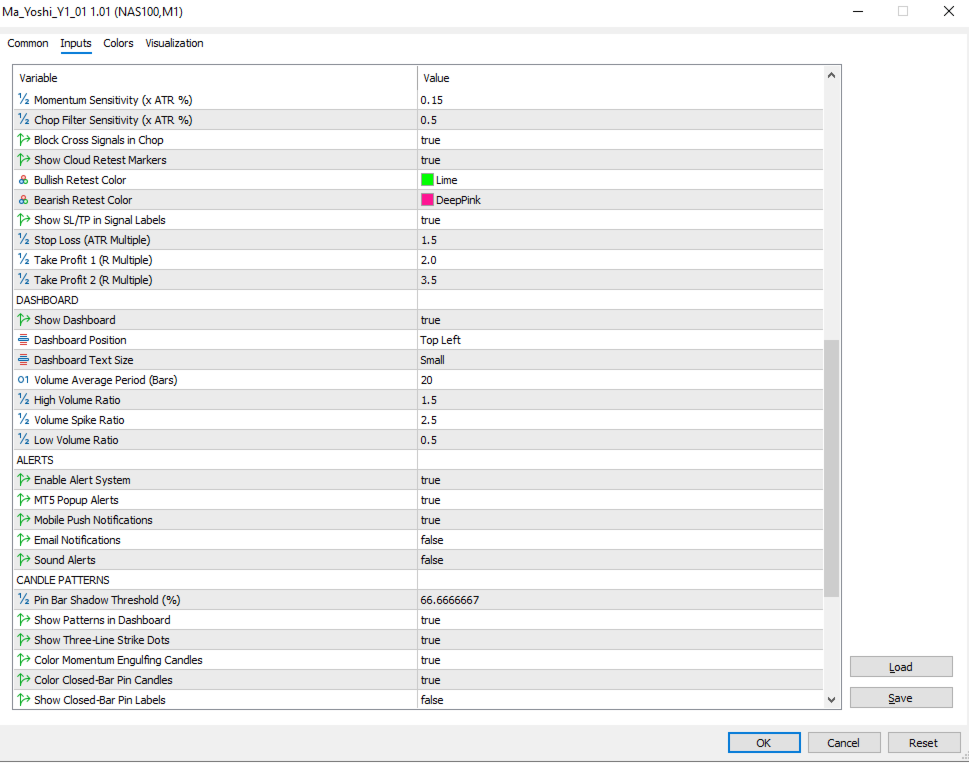
Fast and Medium moving averages form the adaptive cloud, while an optional Slow MA can provide broader bias. Six methods are available: EMA, SMA, WMA, VWMA, RMA and HMA.

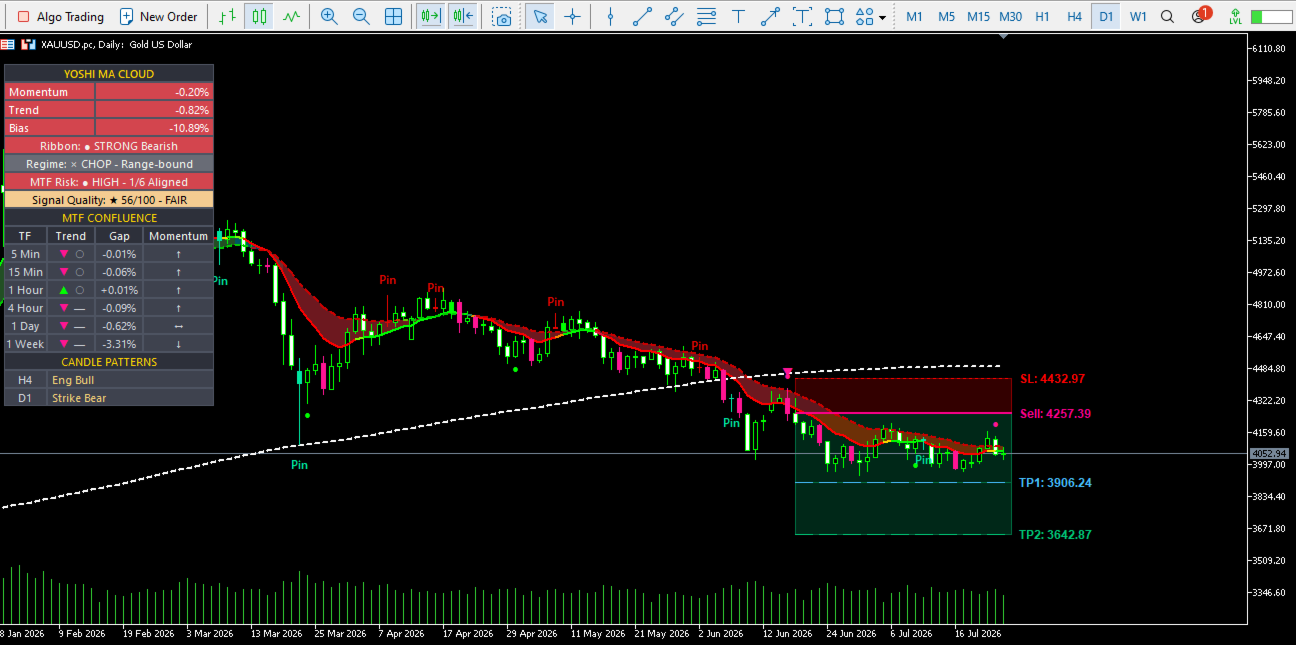
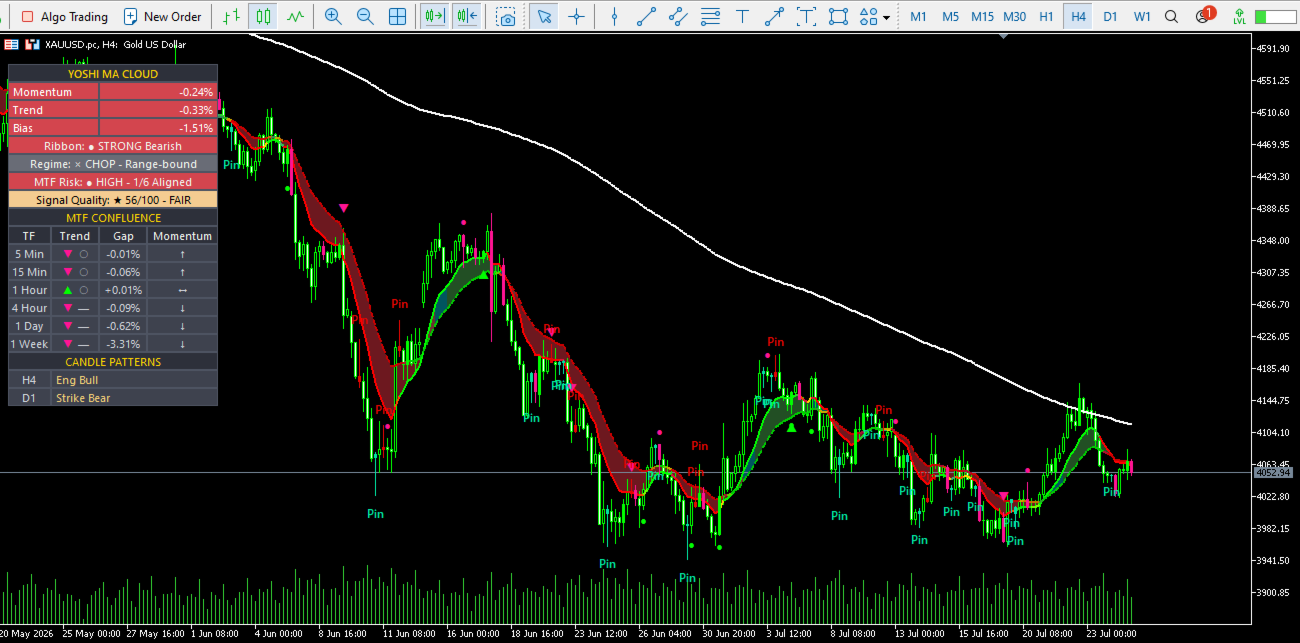
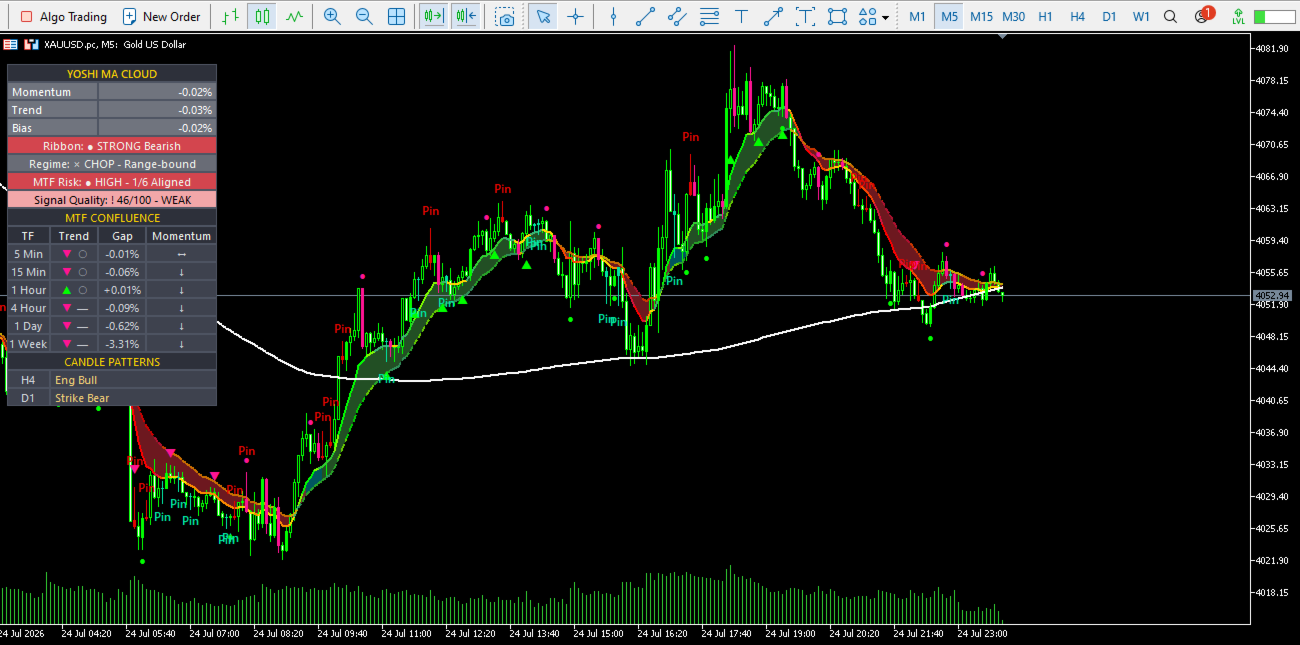
Instead of showing only which average is above the other, the cloud summarizes four states: strong bullish, weak bullish, weak bearish and strong bearish. Its momentum threshold can adapt to ATR-based volatility, helping the framework respond as market speed changes.

The indicator also compares cloud width with current volatility. When the averages become too compressed, the dashboard can identify a range-bound or choppy regime. This does not remove every false crossover, but it gives the trader a reason to pause before treating each signal as equally meaningful.

Key features

Configurable Fast, Medium and optional Slow moving averages

Volatility-aware four-state MA cloud

Six-timeframe confluence across M5, M15, H1, H4, D1 and W1

Buy and Sell crossover events confirmed after the chart candle closes

Cloud Retest signals for pullback continuation setups

Signal Quality assessment using alignment, volume, cloud strength, MA separation and freshness

Candlestick context with Three-Line Strike, Momentum Engulfing and Pin Bar observations

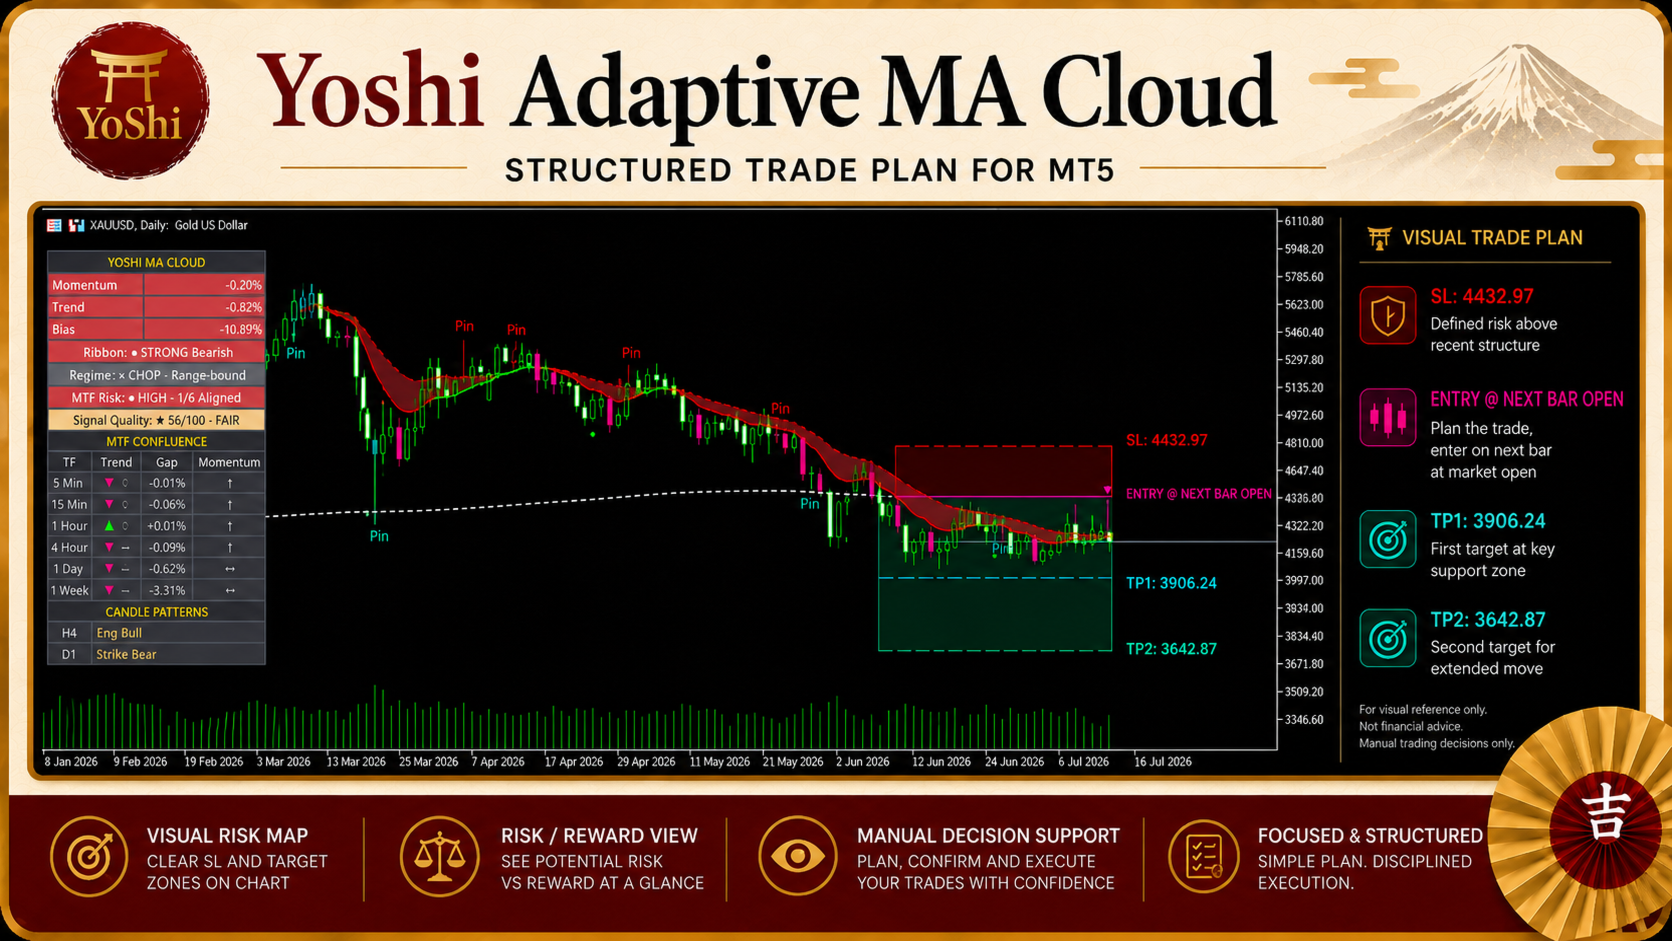
Visual Trade Plan with Entry, Stop Loss, TP1 and TP2 references

From signal to context

A Buy or Sell marker should not be treated as a command. Yoshi Adaptive MA Cloud separates the signal event from the surrounding market context.

The multi-timeframe dashboard shows whether Fast and Medium averages are aligned across six fixed timeframes. MA distance rows show where price sits relative to the selected averages. Volume context, cloud strength and MA separation are combined into a structured Signal Quality score.

This score is a confluence assessment, not a win-rate forecast. It helps compare a fresh crossover in a clean trend with one appearing during compressed or conflicting conditions.

Cloud Retest signals provide a second setup type. They look for price to pull back into the cloud and close back outside it in the prevailing direction. This can suit traders who prefer continuation entries rather than entering at the first crossover.

A practical workflow

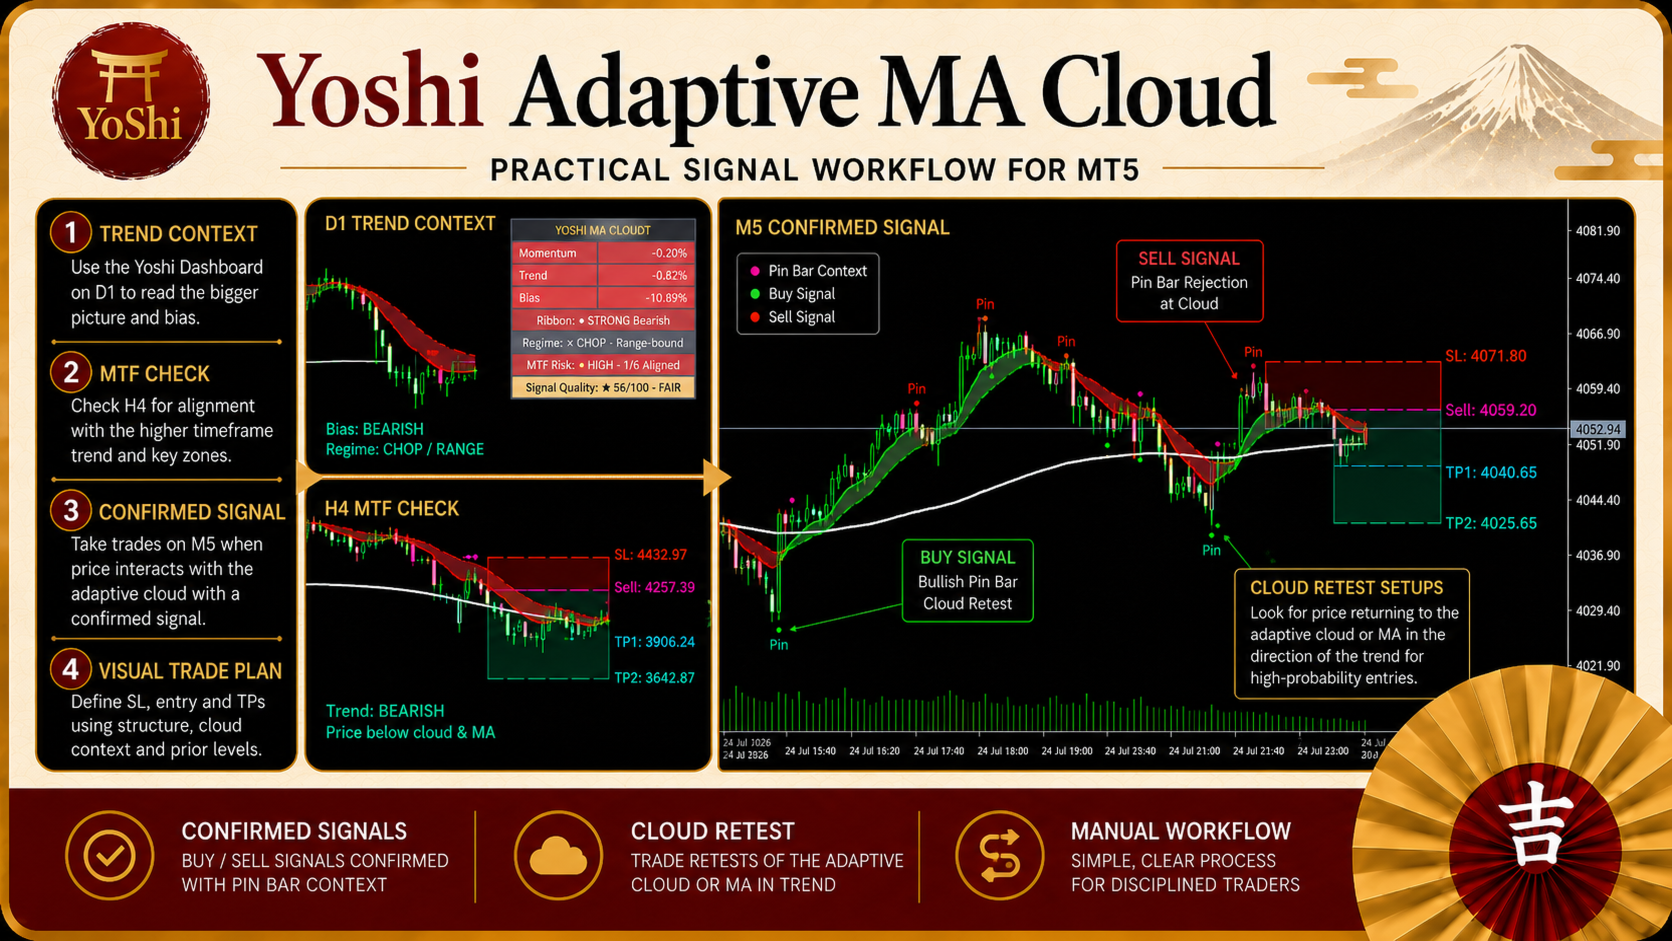
1. Start with the cloud state and optional Slow MA to understand directional context.

2. Check the regime row. A clean trend and a compressed range should not be approached in the same way.

3. Review multi-timeframe alignment instead of judging the setup from one chart alone.

4. Wait for a confirmed crossover or Cloud Retest, then assess volume, MA distance, pattern context and Signal Quality.

5. Review the visual Entry, Stop Loss and target references, and act only when the setup fits your method and risk limits.

Visual planning without automatic execution

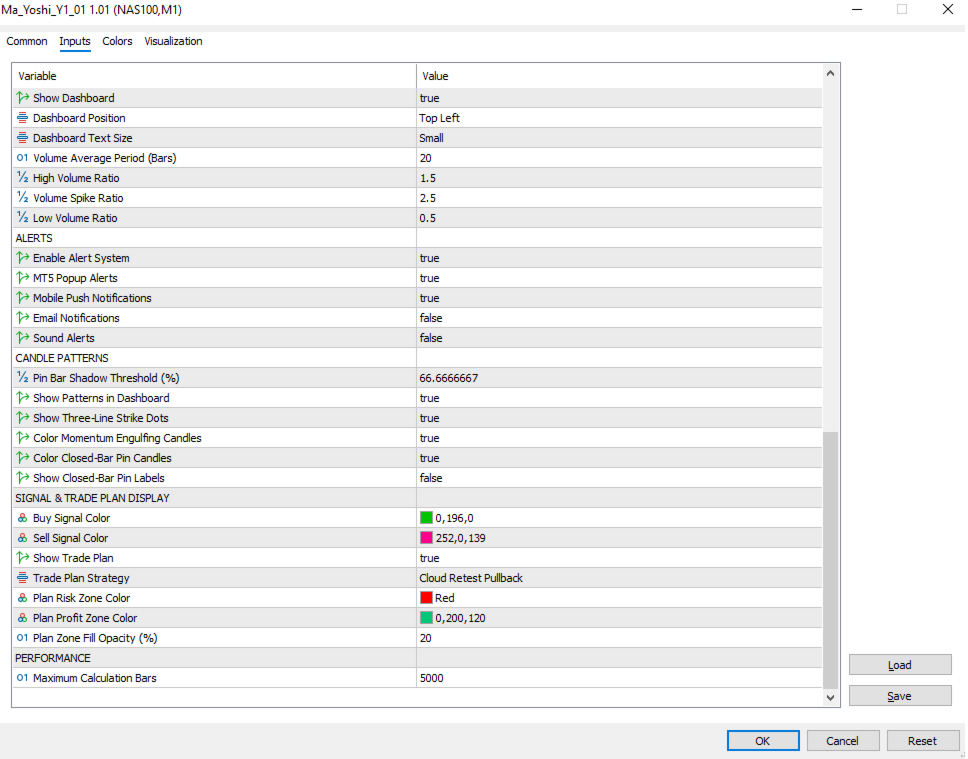
When the selected setup creates a Trade Plan, the indicator can draw Entry, Stop Loss, TP1 and TP2 levels together with risk and profit zones. Only one active plan is maintained at a time, keeping the chart focused on the current idea.

Optional popup, push, email and sound notifications can inform the user when a new Trade Plan is created. These notifications support timely chart review; they are not automated orders.

Who may find it useful

Yoshi Adaptive MA Cloud is intended for manual traders who use trend-following, crossover or pullback methods and want a structured way to evaluate context. It can support intraday and higher-timeframe analysis on selected liquid markets, but settings and behavior should be tested for each symbol and timeframe.

The indicator is not designed for blind signal following, exact top or bottom prediction, or guaranteed outcomes. Moving averages remain lagging tools, and sideways markets can still be difficult.

Important risk note

Trading involves risk. Use the indicator as a decision-support tool, test it in the MetaTrader 5 Strategy Tester or on a demo account, and apply independent confirmation, position sizing and disciplined risk management.

More strategy tools Explore more strategy indicators and trading tools on the Yoshi MQL5 Seller page
Plus de l'auteur
Yoshi Pro Rejection Zones: A Smarter Way to Read Support, Resistance and Price Rejection on MetaTrader 5 In trading, one of the most important skills is knowing where the market is likely to react. Whether a trader focuses on forex, gold, indices, crypto, or CFDs, price often responds around meaningful support and resistance areas. These areas can become turning points, breakout zones, retest levels, or simply locations where traders should pay closer attention. The challenge is that most charts
FREE
Liquidity Delta Profiler Yoshi Read liquidity-zone interaction with a four-part relative delta view on MetaTrader 5 Many indicators draw a line and leave the trader to decide what the next touch means. In live trading, the difficult part is not locating every swing. It is judging how price behaves after it reaches an area where liquidity may be resting. A brief test, a decisive sweep and a failed breakout can look similar at first, yet they call for different decisions. Liquidity Delta Profiler
FREE
Pinbar Yoshi Pro – Clean Multi-Timeframe Pin Bar Detection for MetaTrader 5 Pinbar Yoshi Pro is a clean and practical MT5 indicator designed for traders who use price action, candlestick rejection, support and resistance, market structure and multi-timeframe analysis in their daily trading routine. The purpose of this tool is simple: to help traders detect bullish and bearish Pin Bar candles more clearly, more consistently and with less manual chart scanning. In real trading, a Pin Bar is not
FREE
Ichiyoshi Trend Pullback Framework for MT5 — Version 2.3 Holy Grail Inspired Trend-Pullback Indicator Ichiyoshi Trend Pullback Framework for MT5 — Version 2.3 is a professional trend-pullback indicator created for traders who want to read the market with structure, discipline and context. The framework is inspired by the practical logic of the well-known Holy Grail trend-pullback approach, widely associated with Linda Raschke’s professional trading philosophy. The idea is simple, but powerful: i
ORBYoshi V1.26 – Professional Opening Range Breakout Framework for MetaTrader 5 The Opening Range Breakout (ORB) is one of the most respected intraday trading concepts in modern market history. Popularized through the research and trading work of renowned traders such as Toby Crabel , Larry Williams , and Mark Fisher , the ORB methodology focuses on identifying directional opportunities that emerge after the market establishes its initial opening range. ORBYoshi was developed to bring this timel
Price Action Structure Yoshi for MetaTrader 5 Introduction Price Action Structure Yoshi is a professional Price Action and Market Structure Indicator designed for MetaTrader 5. This MT5 Indicator helps traders visualize market structure, liquidity areas, order blocks, liquidity sweeps, and trendline relationships directly on the chart in a clear and organized manner. Inspired by widely recognized Price Action Analysis and Market Structure concepts, the indicator focuses on helping traders unders
UT Bot Yoshi Trend ATR MT5 – Professional ATR Trailing Stop Trend Indicator for MetaTrader 5 UT Bot Yoshi Trend ATR MT5 is a professional trend-following indicator for MetaTrader 5, designed to help traders read market direction, follow volatility-based trailing stop behavior, and organize Buy/Sell trading ideas with a clean visual structure. The indicator is built around a practical and well-known trading concept: ATR trailing stop logic . Instead of trying to predict the market or identify per
ATR-based trend signals, structured trade planning and higher-timeframe price-action context in one MetaTrader 5 indicator. LTYoshi_Pro is a decision-support indicator built around an ATR trailing-stop engine. It is designed to help traders organize trend signals, risk levels and market context without mixing every chart element into a single automatic decision. The indicator separates its work into independent layers. The core engine produces raw Buy/Sell events when the selected price source
SMC ICT Yoshi v2.19 Smart Money Concepts, Market Structure, Order Blocks and Fair Value Gaps for MetaTrader 5 SMC ICT Yoshi v2.19 is a multi-layer Smart Money Concepts (SMC) and ICT-style market structure indicator for MetaTrader 5. It brings market structure, liquidity references, Order Blocks, Fair Value Gaps, premium and discount zones, higher-timeframe context and session timing into one clear analytical workflow. The product is designed for traders who want more than isolated BOS, CHoCH or
MA Yoshi Pro Moving Average Trend, Momentum and Price Action Confirmation for MetaTrader 5 A Clearer Way to Evaluate Trend Setups Many traders do not struggle because they lack indicators. The harder problem is deciding which information deserves attention, which signal should be ignored, and when it is better to wait. A moving average crossover may appear during a choppy phase. A strong candle may form in the wrong location. MA Yoshi Pro was created to bring these separate observations into o
Yoshi SMC Trend Planner Y02 for MT5 Market Structure, Trend Context and Structured Trade Planning for MetaTrader 5 Trade With Context, Not Isolated Signals A trading signal is easy to notice. The harder part is deciding whether that signal makes sense within the current market structure, price location and higher-timeframe direction. Many traders can identify a Buy or Sell arrow, yet still hesitate because the surrounding context is unclear. Yoshi SMC Trend Planner Y02 was designed to bring tho
Yoshi MTF Candlestick Patterns is a visual Price Action indicator for MetaTrader 5 that combines Three-Line Strike, Momentum Engulfing and closed-bar Pin Bar recognition in one clean chart workspace. A compact multi-timeframe panel reviews the latest closed candle on M1, M5, M15, M30, H1, H4 and D1, helping traders check candle-pattern context without repeatedly switching charts. Yoshi MTF Candlestick Patterns is a visual Price Action indicator for MetaTrader 5. It brings Three-Line Strike, Mome
Trend Yoshi
Le Quang Thanh
Volatility-Adaptive Trend Signals and Visual Trade Planning for MetaTrader 5 TrendYoshi is a manual decision-support indicator for MetaTrader 5 that combines ATR-based trend states, clear Buy/Sell transitions, session context, alerts and structured visual trade plans. A Clearer Way to Move from Trend Signal to Trade Plan A direction change alone is rarely enough. Traders still need to know where the trend reference sits, how much room exists between entry and invalidation, whether the setup appe
Trading a pullback often looks simple after the move is complete. In real time, however, traders must decide which swing matters, where the retracement should be measured from, and whether price is returning to a meaningful area or merely moving through noise. Manual Fibonacci drawing can become inconsistent, especially when the market extends to a new high or low. Yoshi ICT Fibonacci OTE was created to bring more structure to that process. Product Overview Yoshi ICT Fibonacci OTE is a manual de
Market Structure, Liquidity and Price Action Analysis for MetaTrader 5 A chart can contain plenty of information and still leave a trader without a clear decision. A BOS label may appear, liquidity may be nearby, and an order block may remain active, yet the real challenge is understanding how those elements relate to one another. ICT Yoshi Pro organizes that process into a cleaner, more disciplined MetaTrader 5 workflow. What ICT Yoshi Pro Does ICT Yoshi Pro is a manual decision-support indicat
Structured ICT Market Analysis for MetaTrader 5 Reading a chart is rarely difficult because price lacks information. The real challenge is deciding which information matters now. A Break of Structure can support continuation, but the same event may mean something different near liquidity, inside an imbalance, or during an active session. Yoshi ICT Framework Y1.01 brings these elements into one organized MetaTrader 5 workspace, helping discretionary traders evaluate structure, location, timing, a
Reading market structure is rarely difficult because of the terminology. The real challenge is applying the same rules every time: deciding which swing matters, whether price has genuinely broken it, and what to do after a Break of Structure or Change of Character appears. Without a consistent process, charts become crowded and traders can react to isolated labels instead of evaluating the full setup. SMC Yoshi Pro is a market structure indicator for MetaTrader 5 built for manual traders who wan
Yoshi Opening Range Breakout Navigator Structured ORB Analysis for MetaTrader 5 Trading the Open Is Simple in Theory—Not in Practice The Opening Range gives intraday traders a clear starting point: define the early-session high and low, then observe how price behaves around those boundaries. The concept is straightforward. The execution is not. In live trading, ranges are often drawn inconsistently, an intrabar spike can be mistaken for a confirmed breakout, and traders may chase price before th
Yoshi Order Blocks and Breaker Blocks A structured MT5 framework for tracking Order Block zones and their transition into Breaker Blocks Key Features • Bullish and bearish Order Block visualization • Order Block to Breaker Block transition tracking • Adjustable Swing Lookback • Independent recent bullish and bearish zone controls • Full-candle or candle-body zone construction • Configurable zone colors and opacity • Optional Historical Polarity Stars with separate colors • Maximum Calculation Ba
FREE
Filtrer:
Aucun avis
Répondre à l'avis