ICT Yoshi Pro
- Göstergeler
-
Le Quang Thanh
 Professional Trading Tools for MetaTrader 5
I specialize in developing high-quality indicators and Expert Advisors for MetaTrader 5, inspired by well-known trading methodologies used by professional traders and market researchers around the world. - Sürüm: 1.15
- Etkinleştirmeler: 10
Market Structure, Liquidity and Price Action Analysis for MetaTrader 5
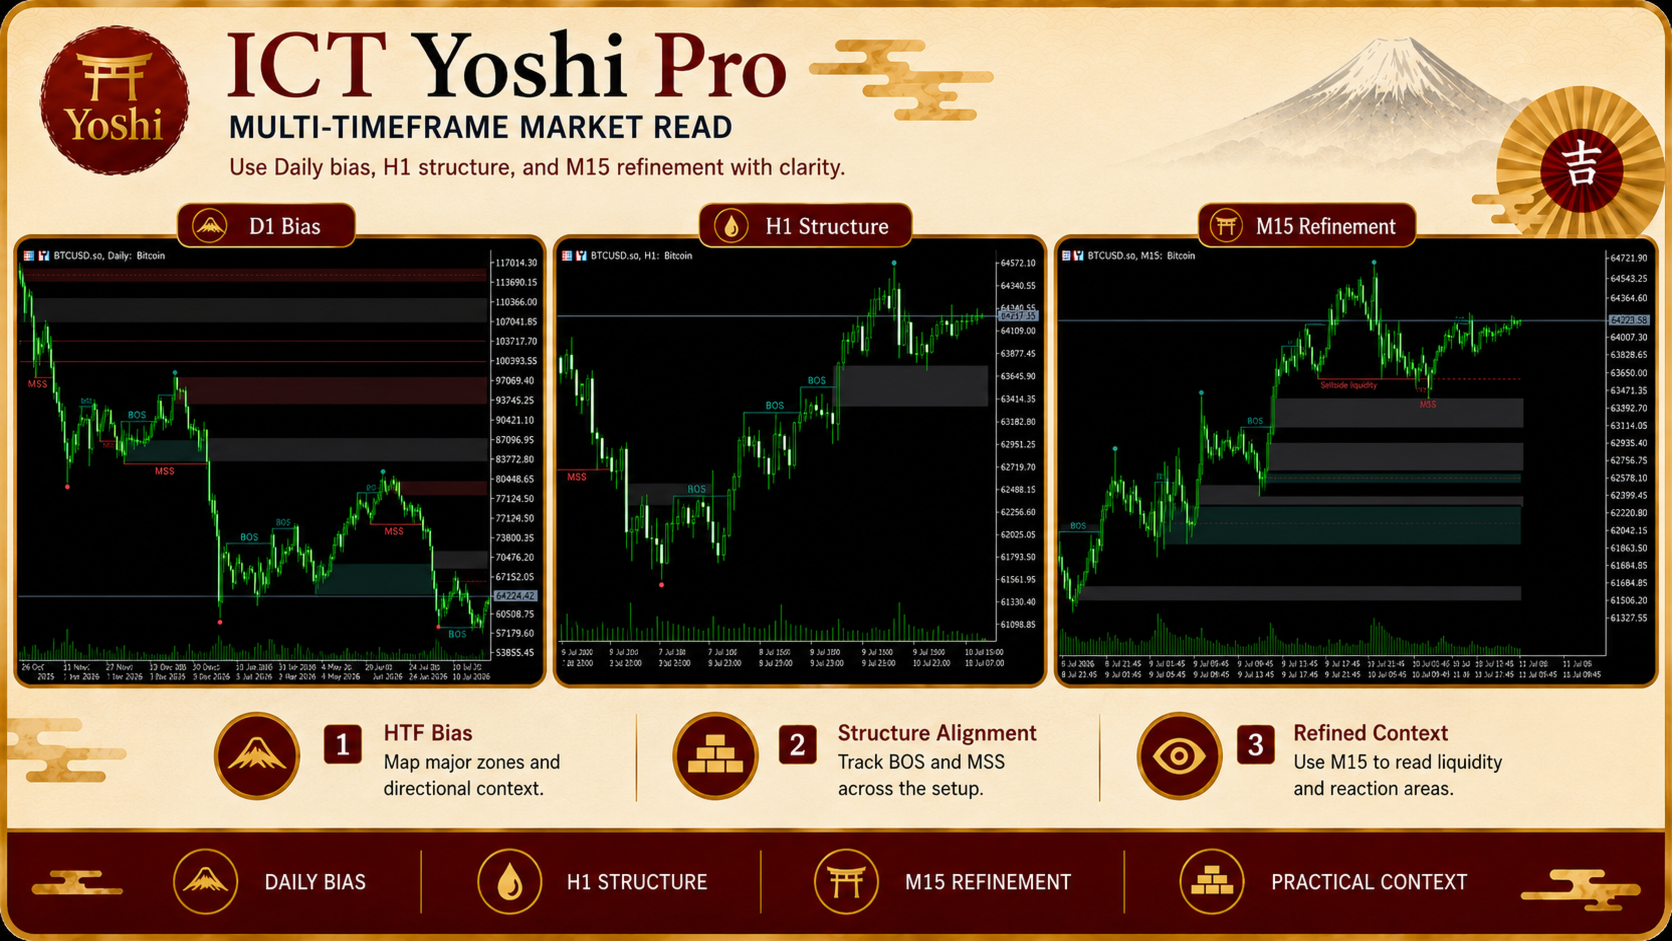
A chart can contain plenty of information and still leave a trader without a clear decision. A BOS label may appear, liquidity may be nearby, and an order block may remain active, yet the real challenge is understanding how those elements relate to one another. ICT Yoshi Pro organizes that process into a cleaner, more disciplined MetaTrader 5 workflow.
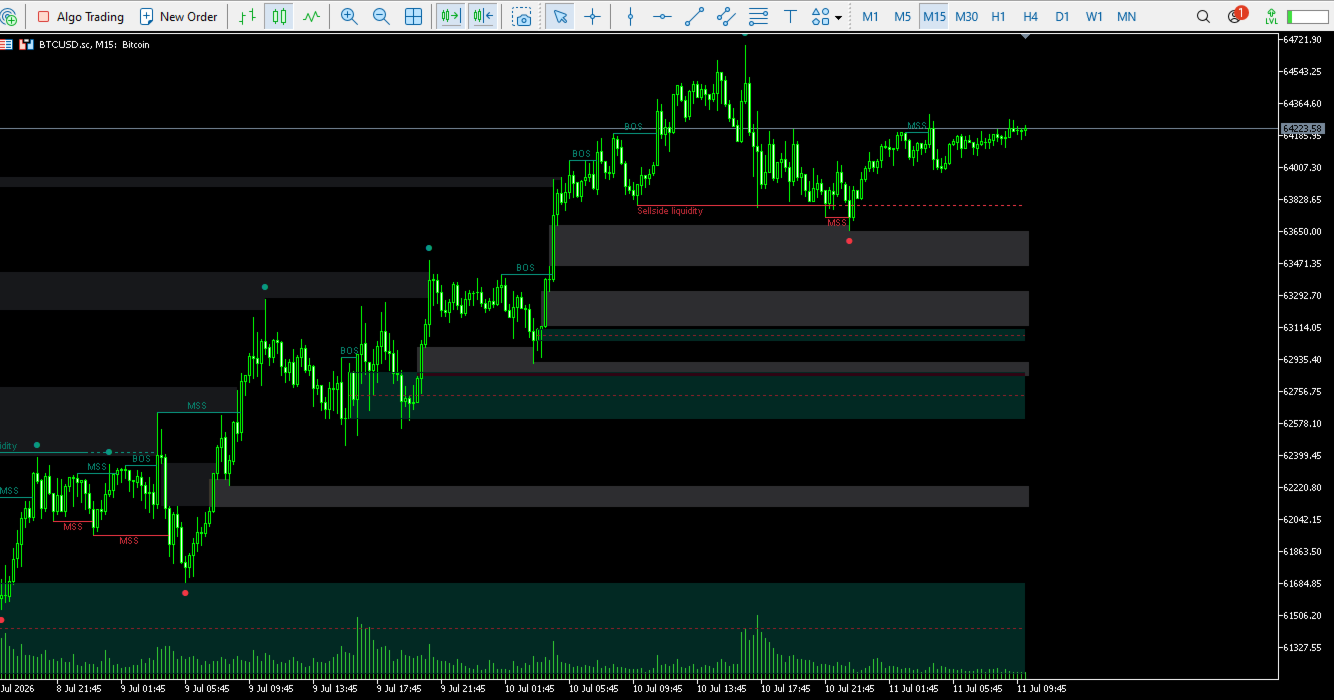
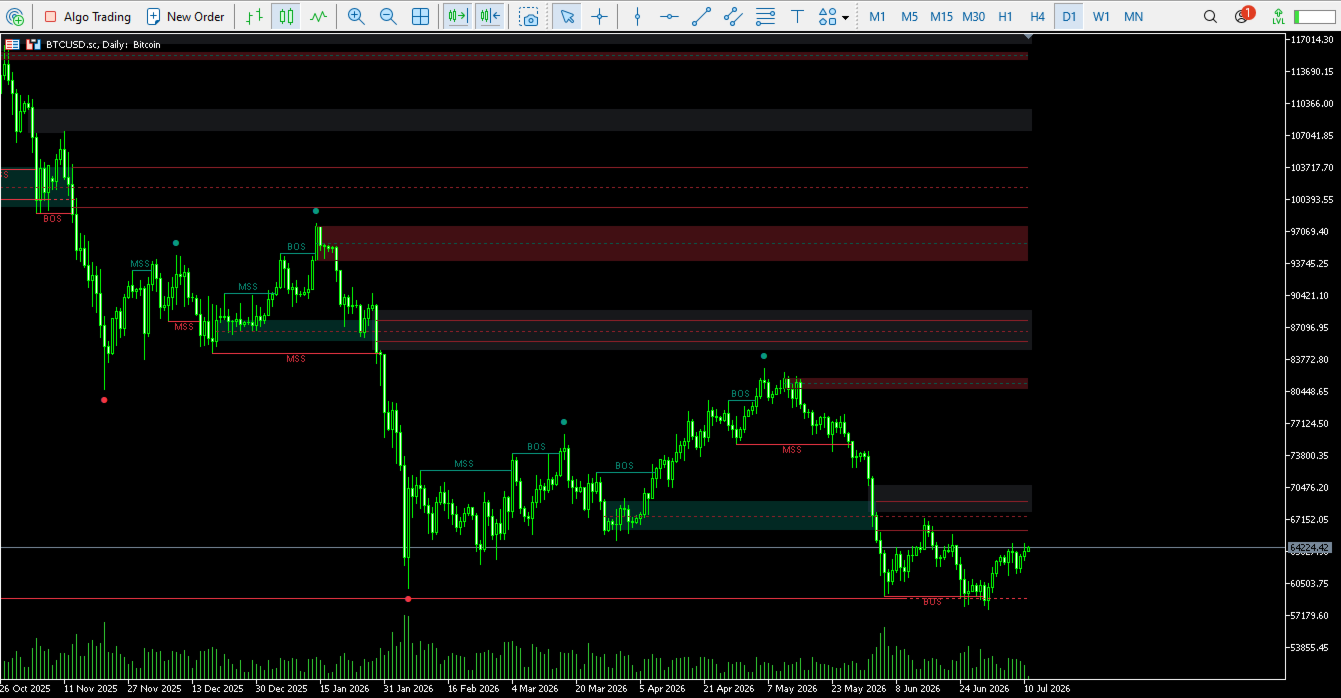
What ICT Yoshi Pro DoesICT Yoshi Pro is a manual decision-support indicator for MetaTrader 5. It does not open, manage or close trades. Its purpose is to help discretionary traders read price action through five connected layers: market structure, swing hierarchy, buy-side and sell-side liquidity, order and breaker blocks, and liquidity voids.
Instead of filling the chart with generic entry arrows, the indicator evaluates price through defined structural and volatility conditions. Short-, intermediate- and long-term swing levels form the foundation. ATR-adjusted thresholds then help qualify liquidity clusters and price imbalances. This creates a more selective visual framework while leaving confirmation, execution and risk under the trader’s control.
Key Features• Short Term, Intermediate Term and Long Term structure analysis
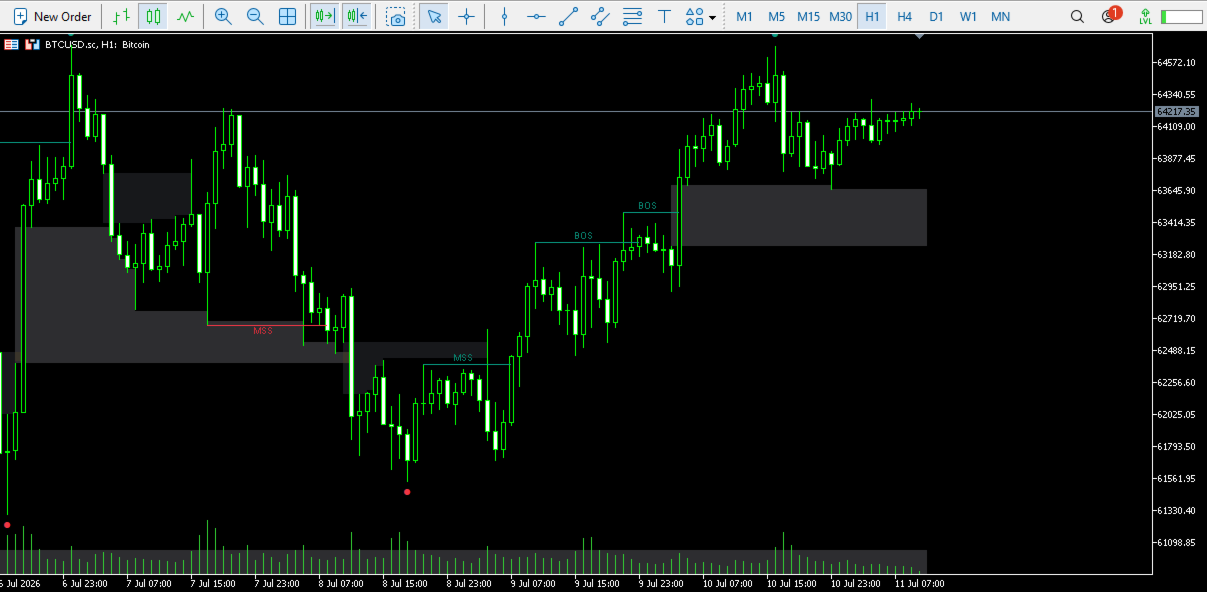
• Bullish and bearish Break of Structure (BOS) and Market Structure Shift (MSS)
• Configurable swing-high and swing-low markers
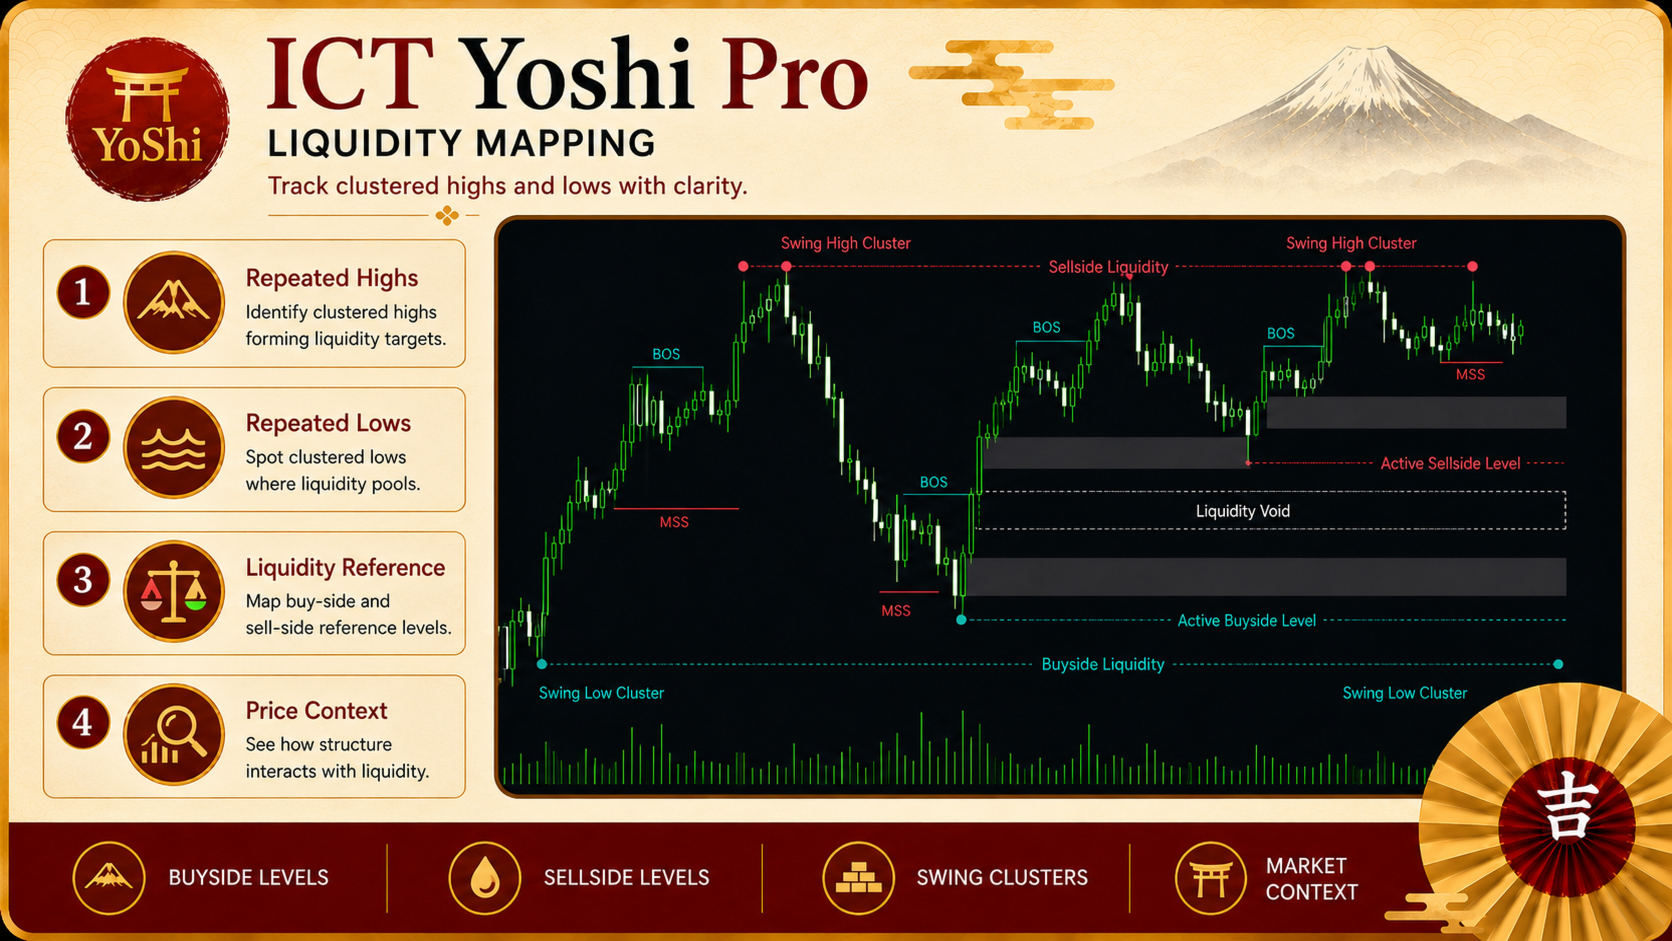
• Buy-side and sell-side liquidity mapping from clustered swing points
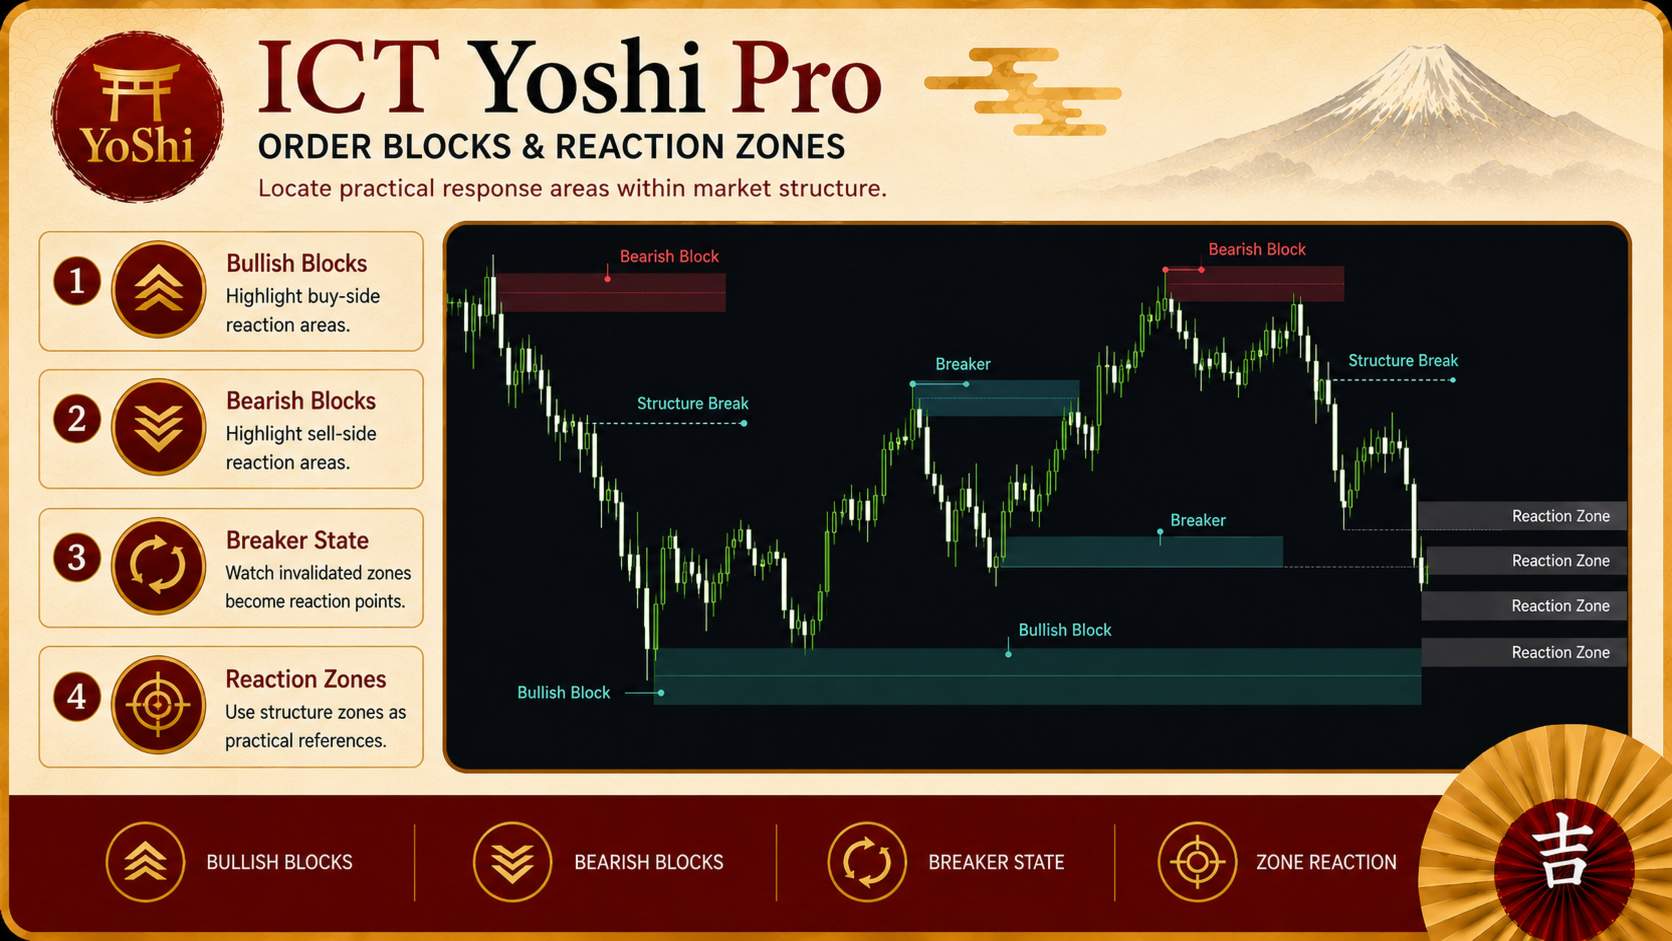
• Bullish and bearish order blocks with breaker-block transitions
• ATR-filtered liquidity void detection
• Independent visibility, color, line-style and display controls
• Responsive chart-object updates for practical daily use
Structure Before SignalMany trading mistakes begin with reacting to one mark on the chart without asking where it sits in the broader structure. ICT Yoshi Pro starts from a hierarchy of confirmed swing points. Short-term pivots form the first layer, intermediate swings are built from them, and long-term swings provide a broader view on the same chart.
When price closes beyond the active swing level, the indicator records a bullish or bearish structure event. A break in the existing structural direction is shown as BOS. A break against the previous direction is shown as MSS, drawing attention to a possible change in market behavior.
These labels are analytical references, not trade commands. A BOS does not guarantee continuation, and an MSS does not guarantee reversal. Their practical value comes from reading them beside nearby liquidity and reaction zones.
Liquidity and Reaction ZonesBuy-side liquidity is identified from groups of swing highs within a volatility-adjusted margin. Sell-side liquidity is built from clustered swing lows. This helps traders see where repeated highs or lows may attract attention, stops or future price interaction without claiming to identify real institutional orders.
Order blocks are mapped from the candle range associated with a confirmed swing break. The user can choose between the candle body and the full high-to-low range. If price invalidates a block under the indicator’s rules, it changes into a breaker-block display, preserving how that area developed.
Liquidity voids highlight three-candle imbalances that exceed an ATR-based threshold. They can be reviewed over a recent working range or across the available historical window. These zones may help locate inefficient movement, but they do not mean price must return.
A Practical Trading Workflow1. Choose the structure and swing level that matches the detail required for the chart.
2. Read BOS and MSS as a sequence, not as isolated signals.
3. Check whether the event is near liquidity, an order or breaker block, or a liquidity void.
4. Wait for confirmation from your own method, such as candle behavior, trend context, momentum or session timing.
5. Define entry, invalidation, position size and risk before taking action.
This separates analysis from execution. ICT Yoshi Pro organizes the market information; the trader decides whether the setup is valid.
Important NotesLive structure, block, liquidity-sweep and void displays may update while the current candle is forming. Swing markers are placed on the historical pivot after confirmation becomes available, so the plotted position is not the detection time. The indicator does not provide alerts, a dashboard, trade execution, Stop Loss or Take Profit management. One instance per chart is recommended.
ICT Yoshi Pro is suited to traders who want an MT5 market structure indicator, an MT5 liquidity indicator and a configurable price-action workspace without handing control to an automated system.
Explore More from IchiyoshiFor more strategy indicators and analytical tools, visit the official Ichiyoshi MQL5 Seller page:
Official Ichiyoshi MQL5 Seller Page
Risk Disclaimer Trading Forex, CFDs and other leveraged instruments involves substantial risk. This indicator provides technical information only and does not guarantee direction, signal accuracy or profitability. Test settings carefully, use appropriate position sizing and follow your own trading plan and risk tolerance.