MTF Trend Matrix Panel With Heatmap

Trend Matrix Panel is a multi-timeframe technical indicator for MetaTrader 5 that compresses an entire trading session's structural picture into a single panel. Rather than flipping between charts to read M1, M15, H1, and D1 separately, the panel shows the trend state of three configurable moving averages across twelve timeframes simultaneously, with a heatmap that draws your eye to the genuinely strong signals and away from noise.
The core idea is simple: every cell in the matrix tells you how many bars a moving average has been trending in its current direction on a given timeframe. Five bars of bullish slope on M15 is meaningful; eighty bars of bullish slope on D1 is structural. The heatmap fades weak counts toward the background and saturates strong counts to full color, so a glance at the panel tells you which timeframes are doing real work and which are just chopping.
The indicator surfaces information through four complementary channels — the matrix tells you what's structural across timeframes, the volume tags on the chart tell you what's significant in the moment, the MA lines and their right-edge labels tell you which trend is which, and the heatmap fade keeps the noise quiet. None of the channels overlap, and the panel is designed so a single glance gives you the read.

The matrix:
The matrix is a grid of timeframes (rows) by MA columns. The first column is split into TF and Volume cells — the timeframe label paired with that timeframe's volume ratio versus its rolling average. The next three columns are the configured moving averages, each cell showing the count of consecutive bars the MA has been trending in its current direction.
Cells are colored bull (default green) or bear (default red) based on slope, then heatmap-faded by their count. A count of 1 means the trend just flipped this bar; the cell shows as a faint tint. A count of 10 or more means the trend is well-established; the cell shows at full saturation. The transition is smooth, not stepped, so you read the matrix as a heatmap rather than a binary on/off grid.

The two-row column header — bias gradient and split votes:
Each MA column has a header that occupies two rows. The top row shows the MA name (e.g. "EMA-20") on a background that tints continuously based on the column's directional bias: dark grey when there's no clear lean, gradually shifting to bull or bear color as alignment builds, reaching full saturation when every qualifying timeframe agrees. The text auto-flips between black and white based on background brightness to stay readable across the full color range.
The bottom row is split into three sub-cells — bull · bear · total — showing the live qualifying votes. The bull number renders in the column's bull color, the bear number in its bear color, the total in the default font color. Crucially, this row's background stays at a fixed neutral grey regardless of bias state, which keeps the numbers always legible and forms a static visual anchor between the dynamic top header and the matrix below. When consensus pulses, the contrast between the moving top row and the still bottom row makes it stand out like a neon sign rather than blending into a continuous gradient.
This separation also fixes a class of misreads. Earlier versions showed a single 9/12 ratio, which was easy to misinterpret as "9 of 12 in directional consensus" when it actually meant "9 of 12 had enough bar history to vote." The new bull/bear/total split makes vote alignment unambiguous: 5/2/12 cannot be mistaken for consensus, and 11/0/12 is clearly a strong directional signal.

Moving average lines and their chip labels:
The three configured moving averages are drawn directly on the chart in their column colors, each at a configurable line width. At the right edge of the chart pane, a small dark chip with a colored border identifies each line by name (e.g. "EMA-20"). The chip text is rendered in the line's color so the text itself matches the line — your eye picks up correspondence at a glance. The chip's vertical position tracks each MA's current value, so labels glide with the moving averages as the market moves; the X coordinate stays anchored to the chart pane in screen-space, so labels remain visible regardless of how far you pan or zoom.

Per-bar volume tags:
On the chart itself, bars whose tick volume meets a configurable ratio threshold get a small tag below their wick showing that bar's ratio (e.g. "1.4x"). Tags are placed only on the most recent N bars (default 60), forming a rolling window that walks forward as new bars print — the oldest tag drops off, new qualifying bars get tagged. This deliberately avoids cluttering the chart with tags on every bar; only the bars where volume actually mattered get marked.
The tags are particularly useful for spotting climactic volume sequences. A run of escalating tags (1.2x, 1.5x, 2.0x) into a swing high tells you distribution; a steady stream of moderate tags (1.1x, 1.2x, 1.1x, 1.3x) along a trending move tells you healthy participation. These are signatures you cannot read from the candles alone.
Tags update only on bar transitions — historical data doesn't change intra-bar, so updating every tick would be wasted work. This keeps performance light even on lower timeframes.

The footer: volume snapshots, spread, and timer:
Below the matrix, two compact rows display live market state. The top footer row shows three volume snapshots side by side: the current bar's tick count and ratio, the previous bar's, and the bar before that. Each is colored independently based on its own ratio against the rolling average — so you can see at a glance whether volume is building, fading, or stable across three consecutive bars.
The bottom footer row splits into spread on the left (with a configured threshold visible inline and three-tier color coding — green well below, amber approaching, red over) and the next-bar countdown on the right (also three-tier — green most of the bar, amber in the final 20%, red in the final 10%).

How to read the panel at a glance:
There's a natural reading order once you've used the panel for a while:
Scan the column headers first: are they tinted? Which way? Strongly?
Read the split row beneath each header to confirm the directional split — strong consensus shows imbalanced numbers (e.g. 11/0/12).
Scan the column you care about top-to-bottom: are the cells consistent in color and saturation, or mixed?
Glance at the TF/Vol column on the left: which timeframes are showing high volume right now (Lavender to Lime tints)?
Check the volume footer: is current volume building or fading versus the previous two bars?
Check the chart for recent volume tags: where did high-volume bars cluster?
Confirm spread is acceptable before trading.
The panel is designed to deliver this read in under two to five seconds. If you find yourself studying it for longer than that, the market itself is probably ambiguous and waiting is usually the right move.
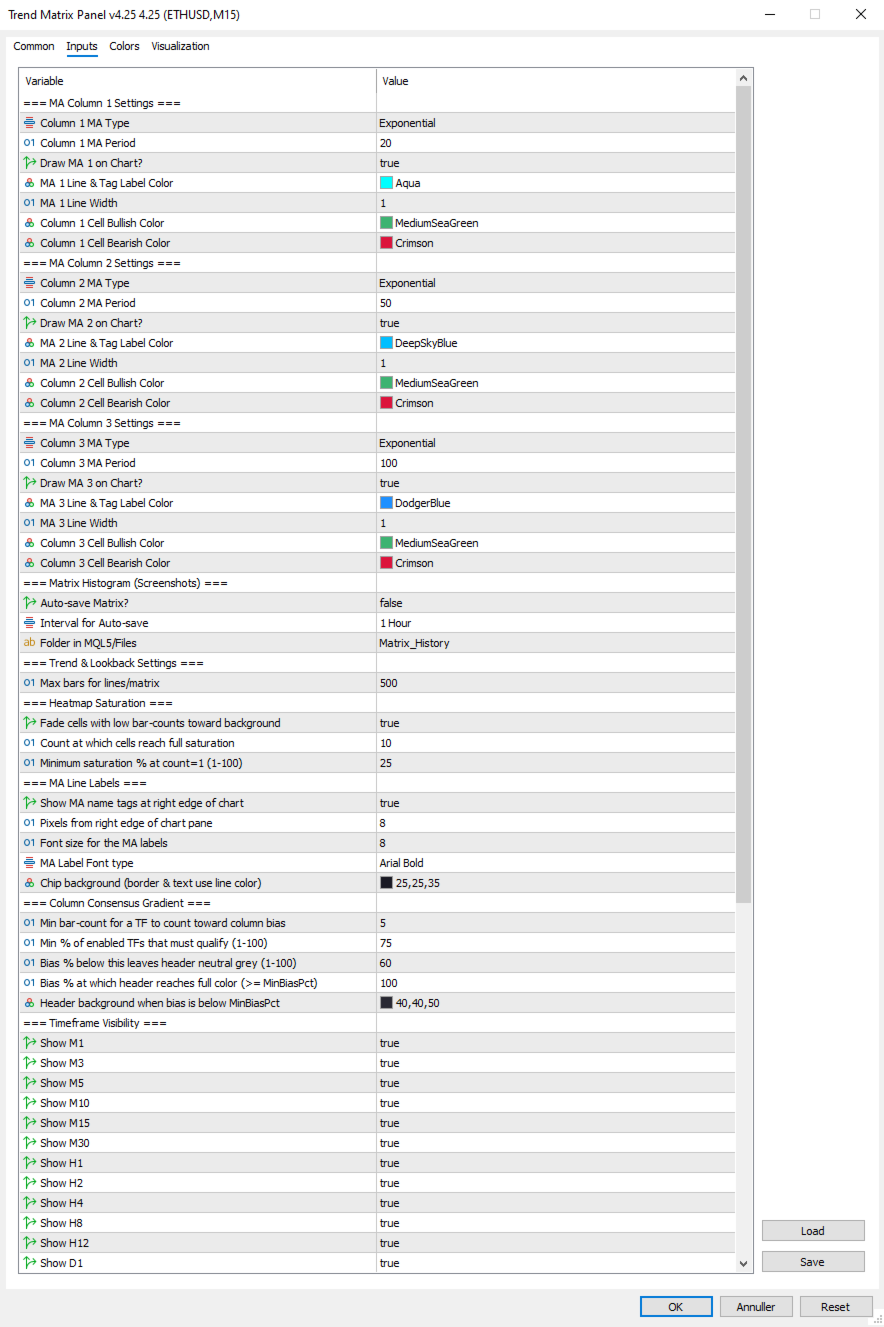

The settings:
=== MA Column 1 Settings ===
  1. Column 1 MA Type: Select MA type for Column 1 (SMA/EMA/SMMA/LWMA).
  2. Column 1 MA Period: Select the period (lookback bars) for the Column 1 MA calculation.
  3. Draw MA 1 on Chart?: Set true to draw MA 1 on the chart, false to hide the line and its right-edge label.
  4. MA 1 Line & Tag Label Color: Select the color for the MA 1 line on the chart and its right-edge chip label.
  5. MA 1 Line Width: Select the width in pixels for the MA 1 line.
  6. Column 1 Cell Bullish Color: Select the color for matrix cells in Column 1 when the MA is sloping up.
  7. Column 1 Cell Bearish Color: Select the color for matrix cells in Column 1 when the MA is sloping down.

=== MA Column 2 Settings ===
  1. Column 2 MA Type: Select MA type for Column 2 (SMA/EMA/SMMA/LWMA).
  2. Column 2 MA Period: Select the period (lookback bars) for the Column 2 MA calculation.
  3. Draw MA 2 on Chart?: Set true to draw MA 2 on the chart, false to hide the line and its right-edge label.
  4. MA 2 Line & Tag Label Color: Select the color for the MA 2 line on the chart and its right-edge chip label.
  5. MA 2 Line Width: Select the width in pixels for the MA 2 line.
  6. Column 2 Cell Bullish Color: Select the color for matrix cells in Column 2 when the MA is sloping up.
  7. Column 2 Cell Bearish Color: Select the color for matrix cells in Column 2 when the MA is sloping down.

=== MA Column 3 Settings ===
  1. Column 3 MA Type: Select MA type for Column 3 (SMA/EMA/SMMA/LWMA).
  2. Column 3 MA Period: Select the period (lookback bars) for the Column 3 MA calculation.
  3. Draw MA 3 on Chart?: Set true to draw MA 3 on the chart, false to hide the line and its right-edge label.
  4. MA 3 Line & Tag Label Color: Select the color for the MA 3 line on the chart and its right-edge chip label.
  5. MA 3 Line Width: Select the width in pixels for the MA 3 line.
  6. Column 3 Cell Bullish Color: Select the color for matrix cells in Column 3 when the MA is sloping up.
  7. Column 3 Cell Bearish Color: Select the color for matrix cells in Column 3 when the MA is sloping down.

=== Matrix Histogram (Screenshots) ===
  1. Auto-save Matrix?: Set true to automatically capture chart screenshots at regular intervals.
  2. Interval for Auto-save: Select the timeframe interval between automatic screenshots (e.g. PERIOD_H1 = one per hour).
  3. Folder in MQL5/Files: Subfolder name under MQL5/Files where screenshots are saved (created automatically if absent).

=== Trend & Lookback Settings ===
  1. Max bars for lines/matrix: Maximum bar history used for line drawing and trend-count detection (cap, not minimum).

=== Heatmap Saturation ===
  1. Fade cells with low bar-counts toward background: Master toggle for the heatmap effect; false reverts to flat full-saturation cells.
  2. Count at which cells reach full saturation: Bar count at which a cell shows at full color; lower = matrix lights up faster.
  3. Minimum saturation % at count=1 (1-100): Saturation percentage for freshly-flipped trends; lower = weaker cells fade more toward invisible.

=== MA Line Labels ===
  1. Show MA name tags at right edge of chart: Master toggle for the colored chip labels next to each MA line.
  2. Pixels from right edge of chart pane: Horizontal padding between the chip's right edge and the chart pane's right edge.
  3. Font size for the MA labels: Font size for the chip text.
  4. InpMALabelFont: Font face dropdown for the chip labels (Arial / Arial Bold / Tahoma Bold / Verdana Bold / Segoe UI Bold / Consolas).
  5. Chip background (border & text use line color): Background color for the chip pill; border and text always match the MA line color.

=== Column Consensus Gradient ===
  1. Min bar-count for a TF to count toward column bias: Timeframes below this count abstain from the directional vote.
  2. Min % of enabled TFs that must qualify (1-100): Minimum quorum of enabled TFs that must have enough history before any bias is registered.
  3. Bias % below this leaves header neutral grey (1-100): Directional bias percentage below which the column header stays neutral.
  4. Bias % at which header reaches full color (>= MinBiasPct): Directional bias percentage at which the header reaches full saturation.
  5. Header background when bias is below MinBiasPct: Background color for the column header in neutral state and for the split-vote row.

=== Timeframe Visibility ===
  1. Show M1: Set true to include the M1 row in the matrix.
  2. Show M3: Set true to include the M3 row in the matrix.
  3. Show M5: Set true to include the M5 row in the matrix.
  4. Show M10: Set true to include the M10 row in the matrix.
  5. Show M15: Set true to include the M15 row in the matrix.
  6. Show M30: Set true to include the M30 row in the matrix.
  7. Show H1: Set true to include the H1 row in the matrix.
  8. Show H2: Set true to include the H2 row in the matrix.
  9. Show H4: Set true to include the H4 row in the matrix.
  10. Show H8: Set true to include the H8 row in the matrix.
  11. Show H12: Set true to include the H12 row in the matrix.
  12. Show D1: Set true to include the D1 row in the matrix.

=== Panel Aesthetics ===
  1. Panel Background Color: Background color for the panel; also serves as the heatmap fade target.
  2. Panel Text Color: Default text color for non-tinted panel areas (cell counts, TF labels, total-vote number, footer).
  3. Matrix Font Size: Base font size for the matrix cells.
  4. Panel Anchor Point: Which corner of the chart the panel anchors to (top-left / top-right / bottom-left / bottom-right).
  5. X-Axis Offset: Horizontal pixel offset of the panel from its anchor corner.
  6. Y-Axis Offset: Vertical pixel offset of the panel from its anchor corner.

=== Volume Settings ===
  1. Volume Average Lookback (bars): Number of prior bars used to compute the rolling volume average for ratio calculations.
  2. Low-volume Threshold (ratio vs avg): Ratio at or below which volume is classified as Low (e.g. 0.7 = 70% of average).
  3. High-volume Threshold (ratio vs avg): Ratio at or above which volume is classified as High (e.g. 1.5 = 150% of average).
  4. Color: Above Average Threshold: Text color used for volume readings above the High threshold.
  5. Color: Below Average Threshold: Text color used for volume readings below the Low threshold.
  6. Color: Average Threshold : Text color used for volume readings between the Low and High thresholds.

=== Per-Bar Volume Tags ===
  1. Show ratio tags below high-volume bars: Master toggle for the per-bar volume tags on the chart.
  2. How many recent bars to consider for tagging: Size of the rolling window of recent bars eligible for tagging.
  3. Min ratio to tag (>=); 1.1 = anything 110% of average: Minimum volume ratio for a bar to receive a tag.
  4. Tag text color: Color used for the volume tag text below qualifying bars.
  5. Tag font size: Font size for the volume tag text.
  6. Tag Font type: Font face dropdown for the volume tags (same options as MA label font).

=== Spread Settings ===
  1. Max Spread Treshold: Spread threshold in raw points; spread above this turns the spread display red.
  2. % of threshold at which spread tints amber (1-100): Percentage of the spread threshold at which the display tints amber instead of green (1-100).atrix Cell when in Bearish Trend.


Tips & Operational Notes
First attach behavior
On a fresh attach, the indicator needs a moment for the MA sub-indicator handles to warm up across all twelve timeframes. The matrix may briefly show "SYNC" cells, the MA lines may take a tick or two to draw, and volume tags will populate after the first bar transition. Higher timeframes (especially D1) may take longer if the broker is still loading history. The panel will fully populate within seconds on a live market and within a second or two on closed markets — the OnTimer retry path handles both cases automatically.

Closed market behavior
The panel works correctly on weekends and holidays. The matrix and MA lines update from the most recently completed data; the volume footer shows the last live bars; spread reads as broker-reported (often zero on closed markets). The next-bar timer continues to count down assuming the next bar will arrive on schedule. Volume tags remain in place from the last live session.

Re-attach optimization
Removing and re-adding the indicator is safe and clean — all panel objects, MA chips, and volume tags are removed in OnDeinit, and they all rebuild fresh on OnInit. Use this if you change settings that affect layout (timeframe visibility, anchor corner, etc.) and want to see the updated panel immediately.

Multiple instances
The indicator uses a single shared object name prefix ("TMTX_"), which means running two instances on the same chart is not supported — they would collide. Running one instance per chart is fully supported.

Recommended timeframe choices
The default 12 timeframes are intentionally broad. Common refinements:
Scalping: hide H8, H12, D1 (rarely relevant for sub-15-minute trades). Keep M1 through H4.
Intraday/swing: hide M1, M3 (mostly noise for trades held longer than a few minutes). Focus on M5 through D1.
Position trading: hide M1, M3, M5, M10, M15. Focus on M30 through D1, where structural moves play out.

Tuning the heatmap
The default settings (FullCount=10, MinSaturation=25) balance detail with focus on a typical liquid market. Adjust based on personal taste:
If the matrix feels too washed out: lower FullCount to 6–8 (cells reach full color sooner) or raise MinSaturation to 35–40 (weak cells more visible).
If the matrix feels too loud: raise FullCount to 15–20 (full color requires longer trends) or lower MinSaturation to 10–15 (weak cells almost vanish).
Heatmap off entirely: set InpHeatmapEnabled = false. Useful for verifying raw signal direction before tuning.

Tuning the consensus gradient
Two knobs control how aggressively the column header announces directional bias:
MinBiasPct higher (e.g. 75): headers stay neutral longer, only tinting on stronger leans. Calmer panel, fewer false alarms.
MaxSatAt lower (e.g. 80): headers reach full color at 80% bias instead of 100%. More dramatic, fires earlier.
Tightening the band (e.g. MinBias=80, MaxSat=100): creates a sharper transition — headers stay grey until clearly aligned, then quickly saturate. "On/off" feel within a continuous system.

Tuning the volume tags
The default threshold of 1.1x is permissive enough that you'll see most participating bars get marked. Tune based on chart density and your trading style:
Threshold 1.0: tags every average-or-above bar — useful for studying full sessions, but busy.
Threshold 1.3 or 1.5: only tags bars with notable volume — great for spotting climactic moves and absorption.
Window 30 bars: tighter focus on the immediate session — old tags drop off faster.
Window 200 bars: longer history for after-the-fact session review. Watch the object count if you push much beyond 200.

Spread threshold per instrument
The default 20-point threshold is appropriate for major forex pairs on tight-spread brokers. For other instruments, tune accordingly: 10–15 for very tight pairs, 30–50 for indices and metals, 50+ for exotics. The amber warning tier at 80% of threshold gives you advance notice when spread is widening — useful around news events when costs spike before liquidity dries up entirely.

Knowing when to ignore the panel
The matrix is a structural read; it cannot tell you about news, session changes, or imminent reversals. Three situations where the panel's signal should be ignored or weighted down:
Around scheduled high-impact news (NFP, FOMC, CPI). The matrix's recent counts reflect pre-news structure that the news will likely break.
During session transitions (Asian → London, London → New York). Volume regime changes can flip multi-TF alignment within a few bars.
On illiquid instruments or off-session hours. A perfect-looking matrix on a thin market means very little — wait for real participation.
The volume footer is the panel's primary tool for catching these situations. Three consecutive low-ratio bars in the footer should temper any structural signal the matrix is showing. The volume tags on the chart give you a longer view of the same — a stretch of recent bars with no tags at all suggests low-conviction action you should treat with caution.
Önerilen ürünler
Algo Trading Indicaor MT5 The ATC ALGO indicator has been developed to work on the MetaTrader 5 platform. It has the same specifications and zones as the MetaTrader 4 version. There may be slight lag, which we believe is due to differences in MetaTrader 5 programming. We will work on improving it, God willing. MT5 Version                    https://www.mql5.com/en/market/product/170028 MT4 Version                    https://www.mql5.com/en/market/product/88034 With this indicator , you’ll have
Smart Currency Strength is a powerful yet simple indicator that measures the strength of individual currencies. It features a graphic panel that lists the main currencies and their strength in each timeframe, ranging from 0 (most oversold) to 100 (most overbought). The strength for all currencies in the current timeframe is also shown in a separate window as a multi-line graph, where each currency is represented with a different color, this allows you to monitor the evolution of strength trend
Hybrid Assisted Trading Engine Manual Trading. Machine Discipline. The Hybrid Assisted Trading Engine is an institutional-grade manual trade management system designed to protect traders from emotional mistakes — without taking control away from them. You decide when to enter . The engine decides how the trade is managed . What It Does This system continuously monitors your manual trades and enforces professional-level trade management rules in real time: Smart Breakeven logic R-based trai
MQL5 Blogları: https://www.mql5.com/en/blogs/post/761446 MT4 Sürümü: https://www.mql5.com/en/market/product/136790 MT5 Sürümü: https://www.mql5.com/en/market/product/136791 Time Wizard, hız, zamanlama ve işlem kontrolünü tek bir temiz kontrol panelinde bir araya getirmek isteyen yatırımcılar için tasarlanmış profesyonel bir işlem asistanıdır. Bu Uzman Danışman, olay bazlı işlem, planlı işlem ve hızlı yarı otomatik emir yönetimi için tasarlanmıştır. Emirlerinizi önceden hazırlamanıza, tam işle
Trillion Pips Pro MT5
Sivaramakrishnan Natarajan
TRILLION PIPS ELITE PRO INDICATOR  Advanced Wave-Based Auto Trend System Built with   12+ Years of Real Market Experience , this is not just an indicator — it’s a   complete market intelligence system   designed to give   accurate levels + auto trend direction with precision and confidence .    UNIQUE POWER OF THIS INDICATOR Proprietary Strategy – Only from Trillion Pips Advanced   Wave-Based Market Structure Engine   Auto Trend Detection System   (No manual analysis needed) Built-in   Tr
CONTACT AND SUPPORT At TPFX, we understand that every trader has unique requirements and that efficiency is the key to success. Therefore, I cordially invite you to send me a private message regarding any questions, functional errors, or needs for personalized adjustments. I am committed to providing fast and decisive technical assistance, ensuring your tool is always in perfect condition. Personalized adjustments to adapt the system to your specific strategy can be made at no additional cost
Price Alerts Advanced Price Target Notifications
Elsayed Mohamed Kamal Elsayed Abdelwadod
Price Alerts - Advanced Price Target Notifications Never miss important price levels again! Price Alert Pro lets traders: • Set unlimited price target alerts • Receive instant desktop and mobile notifications • Visually track progress to each target • Customize alert sounds and frequencies • Manage all alerts from an intuitive panel Perfect for: - Breakout traders waiting for key levels - News traders monitoring reaction points - Position traders managing multiple targets - All traders who c
Live broadcast of the indicator on YouTube. Please click on the link below for more credibility. There are also videos of the indicator that you can watch. Note that the broadcast is late, do not rely on it. Only a review of the indicator is only a review of the indicator’s accuracy, which does not lose almost and the profit rate reaches 95%. I will work with great accuracy on the CRASH coin 1000 INDICES
Kiobi
Firas Al-qasimi
KIOBI VISION KIOBI VISION is a multi-factor analysis indicator designed for professional traders who want a clear and structured view of the market across multiple time frames. Objective The indicator offers a unique summary table that combines several technical tools (RSI, MACD, Stochastics, Vortex, Momentum, PSAR, DMI, MFI, Fisher, and general trend) to provide reliable and quick-to-interpret buy and sell signals. Key Features Multi-timeframe analysis (M1 → MN): a consolidated view of the
Volume Data on Candles Indicator for MetaTrader 5 Maximize your trading insights with the Volume Data on Candles indicator for MetaTrader 5. This powerful tool provides real-time volume data directly on each candle, allowing you to identify significant shifts in market activity. When the volume of a candle exceeds the average of the last 50 candles, it will be clearly highlighted , ensuring you don't miss out on potential high-volume movements. Key Features: Real-Time Volume Data : Displays volu
FREE
FFXMV Forex Dashboard Indicator MT5
Opengates Success International
FULL FOREX MARKET VIEW Gösterge Panosu MT5 Bu, MT5 platformu için oluşturulmuş özel bir göstergedir ve yatırımcılara piyasada neler olup bittiğine dair tam bir görünüm sağlar. Piyasayı analiz etmek ve başarılı bir işlem için gerekli tüm bilgileri göstermek için gerçek zamanlı veriler kullanır. KURULUM: Bu göstergiyi grafik penceresine eklemeden önce, MT5'inizdeki "Piyasa İzleme" paneline gidin ve ihtiyaç duymadığınız veya işlem yapmadığınız tüm döviz çiftlerini GİZLEYİN, yalnızca gerekli olanlar
Binance Spot datalarını anlık olarak Metatrader 5 de görebilir ve üzerinde Metatraderın size sağlamış olduğu tüm özelliklerini kullanmanıza imkan sağlar. Binance Spot listelenen tüm sembollerin datasına ulaşabilirsiniz. Timezone ayarlamayı unutmayın. Binance it's 00:00 UTC. Kendi ülkenize göre düzeltmeniz gerekli Bedava olan Binance Spot Symbol List eklentisini yüklemeniz gerekmekte.  https://www.mql5.com/tr/market/product/83507 Yükleme yaptıktan sonra belirttiğiniz tarihten itibaren piyasa göz
Introducing the 'Global Forex Session Highlighter' , a powerful tool designed to enhance your trading strategy by providing a visual representation of the Three major Forex trading sessions: Tokyo, London, and New York. This indicator is designed to help traders understand the dynamics of the global Forex market by highlighting the trading sessions directly on your MT5 chart. It provides a clear view of when each session starts and ends, allowing you to strategize your trades around the most act
SuperIndices MT5
Stanislav Korotky
5 (1)
This cluster indicator is MT5 version of SuperIndices for MT4. It allows for processing mixed clusters, where symbols from various markets can be included. For example, it can handle Forex, indices, CFDs, spot at the same time. Number of visible lines increased to 16. An interactive ruler can be enabled to measure signals' strength on the history. The indicator creates a set of embedded cluster indicators (CCFpExtraIndices) with carefully selected periods and combines their results using smart w
G Channels – Efficient Adaptive Channel Indicator Introduction Channel indicators are widely used in technical analysis, offering valuable insights into price movements, trend identification, and volatility. Most channel-based indicators, such as Bollinger Bands and Keltner Channels, rely on a central tendency estimator (e.g., a moving average) combined with a volatility component to define upper and lower bands. The G Channels indicator takes this concept further by leveraging a highly efficie
EAs Manager
Abdeljalil El Kedmiri
5 (1)
The   Ultimate EAs Manager   is a professional risk management and trade assistance tool designed to monitor, control, and optimize all trading activities on your MT5 account. It acts as a   central command center   that oversees every trade - whether opened by other Expert Advisors or manually by you. How it's work with other EAs : Blog post  MT4 version:  https://www.mql5.com/en/market/product/167007 Only 10 copies will be sold at the early-bird price. After 10 copies, the price jumps directly
Stop guessing and start executing with precision. Learning complex trading methodologies takes years of screen time—until now. The Propfolio Strategy Mentor OS is an elite, on-chart analytical dashboard that acts as your live digital trading mentor. It doesn't just draw lines on your chart; it actively scans the market, identifies high-probability setups across 8 different institutional strategies , and tells you exactly what to look for in real-time via the Live Mentorship Terminal. Whether you
Powerful trend indicator provided with all necessary for trade and it is very easy to use. Everyone has probably come across indicators or Expert Advisors that contain numerous input parameters that are difficult to understand. But here, input parameters are simple and it is no need to configure anything — neural network will do all for you. Difference from a classic version The real-time multi time frame panel is added, so you can check a trend for other timeframes without switching the schedu
Devrim niteliğindeki İşlemler Zaman Yöneticisi ile işlem rutininizin kontrolünü zahmetsizce elinize alın. Bu güçlü araç, belirlenen zamanlarda emir gerçekleştirmeyi otomatikleştirerek alım satım yaklaşımınızı dönüştürür. Satın alma işleminden emir belirlemeye kadar çeşitli ticaret eylemleri için manuel müdahale olmadan kişiselleştirilmiş görev listeleri oluşturun. Trades Time Manager Kurulum ve Girdiler Kılavuzu EA hakkında bildirim almak istiyorsanız, URL'mizi MT4/MT5 terminaline ekleyin (ekran
Bu, işlemlerinizi yönetmenize yardımcı olacak bir araçtır. Hedef 1, 2, 3'ü puan ve bu hedeflerde kapatmak istediğiniz lot büyüklüğünün yüzdelik oranı olarak belirleyebilirsiniz. Örneğin, 1, 2, 3 hedeflerini 5$, 10$ ve 15$ olarak %40, %30, %30 olarak belirlediniz. Şimdi, 4220'de XauUSD'ye 0,1 lotla giriş yaparsanız, 5$ hedefinde 0,04 lot, 10$ hedefinde 0,03 lot ve kalan miktar 15$ hedefinde kapanacaktır. Zaman olarak da zarar durdurucu belirleyebilirsiniz. Zaman durdurucu ve hedef, işlem yaptı
Gann Box MT5
Frederic Jacques Collomb
Gann Box göstergesi, trader'ların piyasanın kilit seviyelerini tanımlamalarına ve bunlardan yararlanmalarına yardımcı olmak için tasarlanmış güçlü ve çok yönlü bir araçtır. Bu gösterge, grafiğe bir dikdörtgen çizmeyi sağlar ve bu dikdörtgen otomatik olarak stratejik seviyeler olan 0, 0.25, 0.50, 0.75, 1 ile birkaç bölgeye ayrılır. Fiyat bu seviyelerden birine ulaştığında, alarmlar tetiklenir ve bu, ticaret kararları için değerli bir destek sağlar. Çizdiğiniz bölgeye göre piyasanın gelişimini an
The Institutional Flow Sentinel (Net Sentiment Volume AKA NSV) SEE VOLUME HAPPENING ON THE GO!!!!!!! Overview Retail traders look at price. Institutions look at order flow . The Institutional Flow Sentinel is a high-precision algorithmic system designed to decode the hidden battle between buyers and sellers. By analyzing real-time volume delta and identifying supply/demand imbalances, this system allows you to stop guessing and start trading with the "Smart Money." Why Order Flow? Price charts
N/B: All our product purchase comes with our free ‘’DAILY   SCALPER EA’’ Whatsapp Developer for yours after successful purchase   THE ARCHITECTURE OF A PERFECT TRADING SYSTEM Let me break down how all the components in this Ultimate Semafor system work together like a Swiss watch mechanism. This is a multi-layered confirmation system where each piece validates the others.   SYSTEM PHILOSOPHY: "TRIPLE CONFIRMATION" This system follows a simple but powerful principle: No single indicator can
SweetSpot Gold Units MT5 Indicator – Precision Psychological Levels for Gold Scalping and Intraday Trading If you are looking for profitable Gold EA checkout my best EA so far -  https://www.mql5.com/en/market/product/167535? SweetSpot Gold Units is a professional-grade MetaTrader 5 indicator designed to automatically plot dynamic psychological price levels directly on your chart. Built specifically for XAUUSD (Gold) traders, this MT5 indicator draws clean, structured minor and major unit levels
Ai Breakout X
Aleksandr Makarov
5 (1)
GERÇEK BİR TRADING HESABINDAN CANLI SİNYAL: Tam şeffaflığı sağlamak için, size gerçek zamanlı olarak performansını herhangi bir manipülasyon olmaksızın izlemenize olanak tanıyan canlı bir yatırımcı hesabına erişim sağlıyorum. Sadece 1 emir Zarar durdurma: 200 pip Kar alma: 2500 pip Takip eden başlangıç: 200 pip LIVE SIGNAL: XAUUSD   Ai Breakout X M5 Broker : Exness Server : Exness-MT5Real25 Account Number : 183814864 Investor Password:   GBp(N/5y5T51 Danışmanın kurulum talimatlarını almak içi
Trade Utility Pro is a bot utility designed to help you manage trades more easily, quickly, and accurately. This utility features a control panel interface and supports MetaTrader 5 exclusively. This utility does not link to any account information or external sources, ensuring safety. Main Features: Open Trade Support: Lot size calculation Fixed Lot: Custom input lot required Money Risk Lot: Automatically calculated based on stop loss and money risk Account % Risk Lot: Automatically calculated
FREE
The Supply and Demand Zone Indicator is a powerful and easy-to-use tool designed to help traders identify critical supply and demand zones on the chart. These zones can provide valuable insight into potential market reversals, breakouts, and important price levels where buyers or sellers are likely to take control. The best   FREE Trade Manager . If you want to create your own Hedging or Grid strategies without any coding make sure to check out the   ManHedger Key Features: Automatic Zone Detect
FREE
Correlation Matrix Pro - Çoklu Döviz Hedge Tarayıcı Döviz çiftleri arasındaki ilişkileri gerçek zamanlı olarak anlayın! 6 döviz çifti arasındaki istatistiksel ilişkileri aynı anda görselleştirmenize yardımcı olan güçlü bir analiz aracıdır. Portföy yönetimi, risk çeşitlendirmesi ve hedge stratejileri için mükemmeldir. TEMEL ÖZELLİKLER - Logaritmik getiriler kullanan gerçek zamanlı Pearson korelasyonu - Aynı anda 6 döviz çiftini izleme - Otomatik zaman dilimi algılama - Ayarlanabilir geriye bakış
FREE
Hard Scalping Assistant is a semi-automatic Expert Advisor for MetaTrader 5 created for traders who want to keep making their own decisions, but with a much more advanced, organized and professional execution. It does not enter the market on its own: you choose the direction, define the trade idea and adjust the zone directly on the chart, while the assistant automatically calculates the risk, lot size and the full execution structure. With just a few clicks, you can prepare BUY or SELL trades
FF4 Scalper
Valerii Gabitov
Ea does not use martingale or grid and has a stop loss for every position.  Symbols: EURCHF, EURCAD, USDCHF and other. Time frame: M15 Best results on EURCAD M15. Live signals and other products here -  https://www.mql5.com/ru/users/leron34/seller#products The EA should run on a VPS continuously without interruption.  Multicurrency advisor. You can enter pairs in the EA settings for tests. I recommend the default settings. You can install an adviser on any pair on M15. The EA has a news filter
Bu ürünün alıcıları ayrıca şunları da satın alıyor
ARIPoint
Temirlan Kdyrkhan
ARIPoint is a powerful trading companion designed to generate high-probability entry signals with dynamic TP/SL/DP levels based on volatility. Built-in performance tracking shows win/loss stats, PP1/PP2 hits, and success rates all updated live. Key Features: Buy/Sell signals with adaptive volatility bands Real-time TP/SL/DP levels based on ATR Built-in MA Filter with optional ATR/StdDev volatility Performance stats panel (Success, Profit/Loss, PP1/PP2) Alerts via popup, sound, push, or email Cu
Azimuth Pro
Ottaviano De Cicco
5 (7)
Azimuth Pro V2: Synthetic Fractal Structure and Confirmed Entries for MT5 Overview Azimuth Pro is a multi-level swing structure indicator by Merkava Labs . Four nested swing layers, swing-anchored VWAP, ABC pattern detection, three-timeframe structural filtering, and closed-bar confirmed entries — one chart, one workflow from micro-swings to macro-cycles. This is not a blind signal product. It is a structure-first workflow for traders who care about location, context, and timing. V2 Launch Offe
SignalTech MT5 is a trading system for EURUSD, USDCHF, USDJPY, AUDUSD, NZDUSD, EURJPY, AUDJPY, NZDJPY, CADJPY H2 and H3 Timeframe.  All the winning trades with chart setups are published on the comments page. 2025-12 1174 Pips 2026-01 2624 Pips 2026-02 2937 Pips 2026-03 2165 Pips 2026-04 2243 Pips It can generate signals with Buy/Sell Arrows and Pop-Up/Sound Alerts. Each signal has clear Entry and Stop Loss levels, which should be automatically flagged on the chart, as well as potential Targets
OmniSync Projection
Antonio-alin Teculescu
5 (1)
Chronos Fractal Engine is an innovative price projection indicator for MetaTrader 5, designed to transform your technical analysis by intelligently identifying and projecting historical price patterns. Built upon an advanced correlation algorithm and the fractal principles of the market, this powerful tool visualizes potential future price movements, giving you a unique edge in your trading decisions. What is Chronos Fractal Engine? At its core, the Chronos Fractal Engine employs a sophisticat
RelicusRoad Pro: Kantitatif Piyasa İşletim Sistemi ÖMÜR BOYU ERİŞİMDE %70 İNDİRİM (SINIRLI SÜRE) - 2.000+ TRADER'A KATILIN Neden çoğu trader "mükemmel" indikatörlere rağmen başarısız olur? Çünkü tekil kavramları boşlukta trade ederler. Bağlamı olmayan bir sinyal kumardır. Sürekli kazanmak için KONFLÜANS (UYUM) gerekir. RelicusRoad Pro basit bir ok indikatörü değildir. Tam bir Kantitatif Piyasa Ekosistemi dir. Tescilli volatilite modellemesini kullanarak fiyatın ilerlediği "Adil Değer Yolu"nu har
KT Alpha Hunter Arrows MT5
KEENBASE SOFTWARE SOLUTIONS
Çoğu ok göstergesi size yalnızca bir sinyal verir ve geri kalan her şeyi sizin çözmenizi bekler. KT Alpha Hunter Arrows ise size tam bir işlem planı sunar. Her sinyal oku, hazır çizilmiş tam bir planla birlikte görünür: giriş çizgisi, stop loss, dört take profit seviyesi ve bu sembol ile zaman diliminin o anda işlem yapmaya değer olup olmadığını gösteren canlı edge değerlendirmesi. Dahil edilen Trade Manager EA, siz işleme girdikten sonra yönetimi üstlenir. Böylece piyasa gürültülü ve stresli ha
ARICoins
Temirlan Kdyrkhan
ARICoin is a powerful trading companion designed to generate high-probability entry signals with dynamic TP/SL/DP levels based on volatility. Built-in performance tracking shows win/loss stats, PP1/PP2 hits, and success rates all updated live. Key Features: Buy/Sell signals with adaptive volatility bands Real-time TP/SL/DP levels based on ATR Built-in MA Filter with optional ATR/StdDev volatility Performance stats panel (Success, Profit/Loss, PP1/PP2) Alerts via popup, sound, push, or email Cust
Meravith MT5
Ivan Stefanov
5 (1)
Göstergе, herhangi bir noktadan hacmi analiz eder ve bu hacim için piyasanın tükeniş seviyelerini hesaplar. Meravith’in ana çizgileri: Boğa hacim tükeniş çizgisi – hedef olarak kullanılır. Ayı hacim tükeniş çizgisi – hedef olarak kullanılır. Trend çizgisi – piyasa trendini gösterir. Piyasanın boğa mı ayı mı olduğuna bağlı olarak rengi değişir ve trend desteği görevi görür. Nasıl kullanılır: Mor dikey çizgiye çift tıklayın ve istediğiniz konuma taşıyın. Her şeyi analiz edebilirsiniz – trendleri v
CGE Trading Suite
Carl Gustav Johan Ekstrom
5 (2)
Institutional-Grade Analytics for MT5 C GE Trading Suite delivers the analytical edge typically reserved for professional trading desks. The platform integrates a full suite of analytical tools into one seamless workflow: dynamic grid mapping, liquidity behavior analysis, ECM, trend lines, MIDAS, trade cycles, and directional channel projections. Together, these provide a unified view of market structure and momentum. Directional clarity is further enhanced by the capital flow index, which meas
AriX
Temirlan Kdyrkhan
1 (4)
AriX Indicator for MT5 A powerful trend-following and signal-evaluation tool AriX is a custom MT5 indicator that combines Moving Averages and ATR-based risk/reward logic to generate clear buy/sell signals. It visualizes dynamic SL/TP levels, evaluates past trade outcomes, and displays win/loss statistics in a clean on-chart panel. Key features include: Buy/Sell signals based on MA crossovers ATR-based SL/TP1/TP2/TP3 levels with visual lines and labels Signal outcome tracking with real-time stat
" Dynamic Scalper System MT5 " göstergesi, trend dalgaları içinde işlem yapmak için scalping yöntemi için tasarlanmıştır. Başlıca döviz çiftleri ve altın üzerinde test edilmiştir, diğer işlem araçlarıyla uyumluluğu mümkündür. Ek fiyat hareketi desteğiyle trend boyunca pozisyonların kısa vadeli açılması için sinyaller sağlar. Göstergenin prensibi. Büyük oklar trend yönünü belirler. Küçük oklar şeklinde scalping için sinyaller üreten bir algoritma trend dalgaları içinde çalışır. Kırmızı oklar yü
Footprint is an indicator for order flow and volume analysis. It helps identify market structure at the cluster level, find key zones with increased activity, and work with filters directly on the chart without constantly opening the settings window. Footprint Indicator Features cluster-based Bid x Ask and Delta charts; on-chart control panel; sliders for filter adjustments; Absorption; Initiative; Stacked Imbalances; Big Trades; dPOC / Dynamic Point of Control; Delta; side market profile; cumul
Kalman Adaptive Zones — Niceliksel Olasılık Bantları Fiyatın nereye gideceğini tahmin etmeyi bırakın. Artık istatistiksel olarak nerede “olması gerektiğini” anlayın. Kalman Adaptive Zones (KAZ), fiyatın etrafına akıllı olasılık bantları çizen profesyonel bir niceliksel göstergedir — bu bantlar piyasa koşullarına gerçek zamanlı olarak otomatik şekilde uyum sağlar. Bollinger Bands veya Keltner Channels gibi sabit geçmiş periyotlarına dayanan göstergelerin aksine, KAZ birden fazla niceliksel anali
Pantera Indicator
Temirlan Kdyrkhan
5 (1)
A tool for on-chart strategy backtesting and performance analysis. A utility for developing, debugging, and testing custom trading ideas and indicator functions. An indicator designed to quickly test trading concepts and visualize the effectiveness of different input parameters. An all-in-one sandbox for testing everything from simple crossovers to complex, multi-condition trading systems.
Göstergemiz, piyasada ilgi gösterilen bölgeleri vurgular ve ardından emir birikim bölgelerini gösterir. Büyük ölçekli bir emir defteri (order book) gibi çalışır. Bu, büyük sermaye için geliştirilmiş bir göstergedir. Performansı olağanüstüdür. Piyasada ne tür bir ilgi olursa olsun, onu görürsünüz . (Bu, tamamen yeniden yazılmış ve otomatikleştirilmiş bir versiyondur – artık manuel analiz gerekmez.) İşlem Hızı (Transaction Speed) , piyasada büyük emirlerin nerede ve ne zaman biriktiğini gösteren v
TrendMaestro5
Stefano Frisetti
note: this indicator is for METATRADER4, if you want the version for METATRADER5 this is the link:  https://www.mql5.com/it/market/product/108106 TRENDMAESTRO ver 2.5 TRENDMAESTRO recognizes a new TREND from the start, he never makes mistakes. The certainty of identifying a new TREND is priceless. DESCRIPTION TRENDMAESTRO identifies a new TREND in the bud, this indicator examines the volatility, volumes and momentum to identify the moment in which there is an explosion of one or more of these da
IVISTscalp5
Vadym Zhukovskyi
5 (6)
iVISTscalp5 — Zaman bazlı piyasa tahmin sistemi iVISTscalp5 sıradan bir gösterge değildir. MetaTrader 5 için geliştirilmiş bir zaman bazlı tahmin sistemidir ve piyasanın ne zaman hareket edeceğini belirlemeye odaklanır. Özellikler  • Hassas zamanlama  • BUY / SELL sinyalleri  • Ortalama kâr potansiyeli  • Haftalık tahminler  • 120+ enstrüman ⸻ Temel fikir Piyasa sadece fiyatla değil, zamanla da hareket eder ⸻ iVISTscalp5 — Zamanda avantajınız
Premium seviye, %80'den fazla doğru tahmin doğruluğuna sahip benzersiz bir göstergedir! Bu gösterge en iyi Ticaret Uzmanları tarafından iki aydan uzun süredir test edilmiştir! Yazarın göstergesini başka hiçbir yerde bulamazsınız! Ekran görüntülerinden bu aracın doğruluğunu kendiniz görebilirsiniz! 1, sona erme süresi 1 mum olan ikili opsiyon ticareti için harikadır. 2 tüm döviz çiftleri, hisse senetleri, emtialar, kripto para birimleri üzerinde çalışır Talimatlar: Kırmızı ok göründüğü an
ZIVA Signal Intelligence
Hassan Abdullah Hassan Al Balushi
ZIVA Signal Intelligence An Adaptive, Modular Market Intelligence System ZIVA Signal Intelligence is not positioned as a conventional trading indicator. It is a fully integrated, proprietary market intelligence system engineered to deliver structured, high-precision interpretation of price behavior within a controlled analytical environment. Developed through an independent architectural approach, ZIVA does not rely on, derive from, or replicate existing indicators. It represents a standalone
FX Analysis is an all-in-one MT5 indicator dashboard that combines eight analytical tools in a single panel, helping traders identify high-probability setups without switching between charts or indicators. Designed for standard forex pairs on MetaTrader 5. Best results on M15 - H4 timeframes when all components are used together as part of the included workflow. Components Volatility Analyzer Displays historical average movement by hour and by day of the week. A real-time Pip Balance shows the
TraderHUD
Justino Porto Neto
TraderHUD — Trader için Eksiksiz Panel TraderHUD , bir trader'ın grafik üzerinde görmesi gereken her şeyi tek bir dosyada bir araya getiren eksiksiz bir görsel göstergedir: mum zamanlayıcısı, gerçek zamanlı spread, özelleştirilebilir filigran, kaydedilen fiyatlı tam saat işareti ve M5 mum başlangıç işaretçisi. Grafiği karmaşıklaştırmadan yüksek düzeyde yapılandırılabilir. Özellikler Zamanlayıcı ve Spread Mevcut mumun kalan süresi için geri sayım, her 500ms'de güncellenir — yeni ticklerden bağıms
Introduction to X3 Chart Pattern Scanner X3 Cherart Pattern Scanner is the non-repainting and non-lagging indicator detecting X3 chart patterns including Harmonic pattern, Elliott Wave pattern, X3 patterns, and Japanese Candlestick patterns. Historical patterns match with signal patterns. Hence, you can readily develop the solid trading strategy in your chart. More importantly, this superb pattern scanner can detect the optimal pattern of its kind. In addition, you can switch on and off individu
SunSignal ML — AI Gold Signals with Multi-Timeframe Confluence SunSignal ML is an advanced AI-powered signal indicator purpose-built for XAUUSD gold trading. It combines a proprietary adaptive trend algorithm with six machine learning models trained on confirmed price pivots to produce high-confidence entry signals with multi-timeframe validation. The indicator runs efficiently on M1, M5 and M15 timeframes and is designed for traders who want precision entries guided by data rather than guesswor
PredictHUD_GOLD — A Future‑Driven AI Line That Moves Before the Market PredictHUD_GOLD is a GOLD‑specialized indicator that runs a true 1‑second AI model internally and visualizes a “leading trend line” directly on your 1‑minute chart. Because the AI reacts before the candlesticks move, you can visually capture reversals, accelerations, and momentum shifts in advance. Key Features 1. Zero Optimization Needed — Market‑Condition Independent PredictHUD_GOLD is powered by an AI model trained o
ARIScalping
Temirlan Kdyrkhan
ARIScalp is a powerful trading companion designed to generate high-probability entry signals with dynamic TP/SL/DP levels based on volatility. Built-in performance tracking shows win/loss stats, PP1/PP2 hits, and success rates all updated live. Key Features: Buy/Sell signals with adaptive volatility bands Real-time TP/SL/DP levels based on ATR Built-in MA Filter with optional ATR/StdDev volatility Performance stats panel (Success, Profit/Loss, PP1/PP2) Alerts via popup, sound, push, or email Cus
OrderFlow Absorption – MT5 için Profesyonel Delta ve Absorpsiyon Sinyal Göstergesi OrderFlow Absorption ile gerçek emir akışı analizinin gücünü keşfedin – MetaTrader 5 için nihai delta histogramı ve absorpsiyon sinyal göstergesi. Fiyat hareketlerinin arkasında gerçekte neler olduğunu görmek isteyen traderlar için tasarlanan bu araç, piyasayı hareket ettiren gizli alım/satım baskısını ve absorpsiyon olaylarını ortaya çıkarır. Özellikler Delta Histogramı Görselleştirme:   Alım ve satım baskısını a
MT4 / MT5 için Astronomi Göstergesini Tanıtıyoruz: En İleri Göksel Ticaret Arkadaşınız Ticaret deneyiminizi göksel seviyelere yükseltmeye hazır mısınız? MT4 için devrim niteliğindeki Astronomi Göstergemizi arayın. Bu yenilikçi araç karmaşık algoritmaları kullanarak eşsiz astronomik içgörüler ve hassas hesaplamalar sunmak için geleneksel ticaret göstergelerini aşmaktadır. Bilgi Evreni Parmaklarınızın Ucunda:   Göksel verilerin hazinelerini açığa çıkaran kapsamlı bir paneli gözlemleyin. Gezegenl
Pointer Trend Switch — precision trend reversal indicator Pointer Trend Switch is a high-precision arrow indicator designed to detect key moments of trend reversal based on asymmetric price behavior within a selected range of bars. It identifies localized price impulses by analyzing how far price deviates from the opening level, helping traders find accurate entry points before a trend visibly shifts. This indicator is ideal for scalping, intraday strategies, and swing trading, and performs equa
Weis Wave with Alert MT5
Trade The Volume Waves Single Member P.C.
4.94 (17)
Rental/Lifetime Package Options and Privileges  Rent Monthly Six Months   Yearly/Lifetime Weis Wave with Speed with Alert+Speed Index x x x Manual  x x x Quick Set up Video x x x Blog x x x Lifetime Updates x x x Setup and Training Material x x Discord Access Channel "The SI traders"          x Rectangle Break Alert Tool      x How to trade with it:    http://www.tradethevolumewaves.com   ** If you purchase please contact me to setup your  : Training Room and  complete manual access.  Wei
GEM Signal Pro GEM Signal Pro, MetaTrader 5 için geliştirilmiş bir trend takip göstergesidir ve daha net sinyaller, daha düzenli işlem kurulumları ve daha pratik risk yönetimini doğrudan grafik üzerinde görmek isteyen yatırımcılar için tasarlanmıştır. Sadece basit bir ok göstermek yerine, GEM Signal Pro işlem fikrinin tamamını daha temiz ve daha okunabilir bir şekilde sunmaya yardımcı olur. Koşullar onaylandığında, gösterge giriş fiyatını, stop loss seviyesini ve take profit hedeflerini grafik ü
Yazarın diğer ürünleri
This is a simple Trade Manager Panel with a clean UI. Features include: Movable GUI Panel, with changeable background color. Lot Size setting, with 2 decimals (If broker supports it). Stop Loss setting. Take Profit 1 in either Points or Percent. Take Profit 2 in either Points or Percent. Take Profit 3 as either close trade or as Trailing Stop Loss. Auto-Break Even when TP1 is hit. Auto-Stop Loss moved to TP1 when TP2 is hit.  Auto-Stop Loss moved to TP2 when TP3 is hit. Auto (Pair-TF-Direction
Filtrele:
Değerlendirme yok
Değerlendirmeye yanıt