SmartRR Visual Planner
- Yardımcı programlar
-
Raymond Paul Raphael
 Specializes in high-performance trading tools designed for the modern MQL5 environment.
 - Sürüm: 1.0
- Etkinleştirmeler: 5
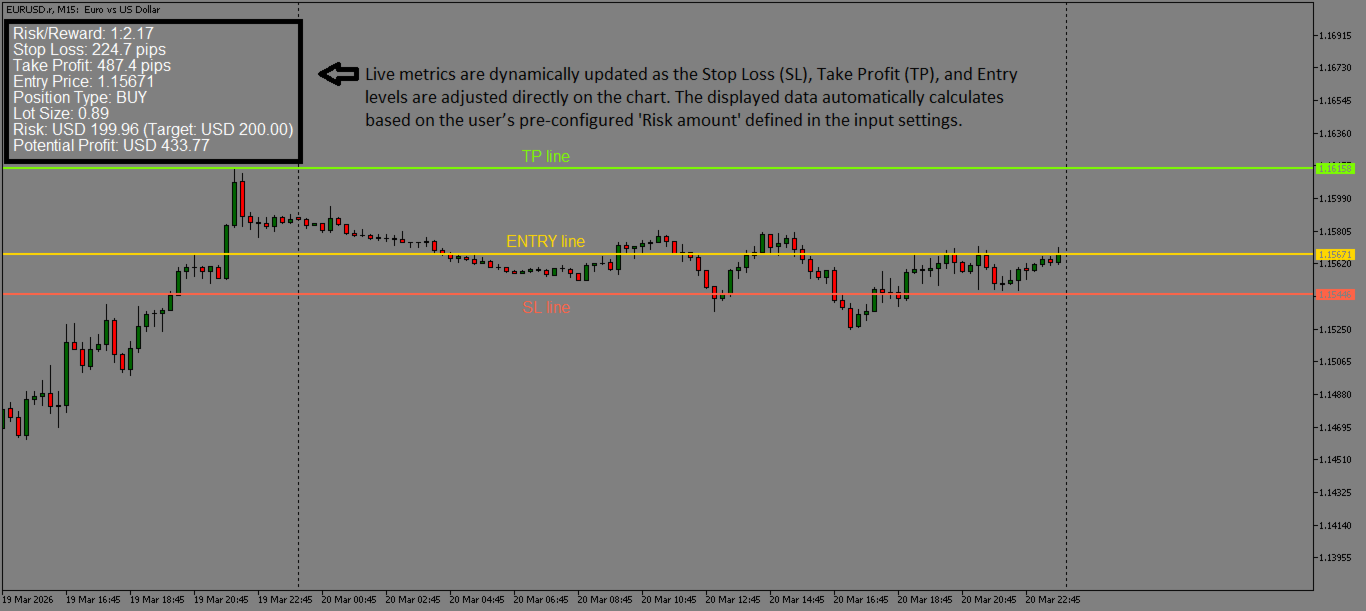
SmartRR Visual Planner is a high-performance utility designed to eliminate manual calculations and human error from your trading workflow. Built for speed and precision, it allows you to visually map out trades using a drag-and-drop interface while providing real-time professional risk metrics.
KEY FEATURES
1. Interactive Visual Planning
Stop guessing your levels. With one click, the tool generates three distinct, selectable lines (Entry, Stop Loss, and Take Profit) directly on your chart.
- Seamless Drag-and-Drop: Adjust any level manually to align with market structure.
- Real-Time Recalculation: The dashboard updates instantly (every 100ms) as you move lines, showing exactly how your reward ratio and lot size change with every pip.
2. Advanced Risk Management Suite
Unlike basic planners, SmartRR calculates professional-grade position metrics based on your specific account balance:
- Automatic Lot Size Calculation: Instantly see the required lot size to match your target risk (e.g., $30.00).
- Profit & Loss Projection: View your potential profit and exact risk amount in your account’s base currency.
- Volatility Index Optimization: Special logic included for Synthetic Indices (Boom, Crash, Step, and Jump) with adjustable contract sizes.
3. Intelligent Direction Detection
The tool automatically detects whether you are planning a BUY or SELL trade based on the position of your Stop Loss relative to the Entry price.
4. Comprehensive Dashboard & Alerts
- Live Metrics: Displays Risk-to-Reward Ratio (1:X), SL/TP distances in pips, and current Entry price.
- Error Notifications: Built-in validation prevents invalid trade setups (e.g., SL above Entry for a Buy) with on-screen error messages.
- Fully Customizable: Tailor the UI to your chart template—adjust colors, font sizes, dashboard positioning (Top-Left or Bottom-Left), and toggle specific metrics on or off.
TECHNICAL SPECIFICATIONS (INPUT PARAMETERS)
| Parameter | Description | Default |
| Line Colors | Custom colors for Entry, SL, and TP levels. | Gold / Tomato / Green |
| Panel Position | Choose Top-Left or Bottom-Left corner. | Top Left |
| Risk Amount | Your target risk in account currency. | 30.0 |
| Volatility Adjustment | Toggle specialized math for Synthetic Indices. | Enabled |
| Information Toggle | Show/Hide RR, Pips, Entry, Lot Size, etc. | All Enabled |
| Error Notifications | Visual alerts for invalid line placements. | Enabled |
HOW TO USE
- Initialize: Attach the indicator to any MetaTrader 5 chart.
- Activate: Click anywhere on the chart. The tool will instantly place the planning lines at the current Bid price.
- Plan: Drag the SL (Red) and TP (Green) lines to your desired structural levels.
- Execute: Check the dashboard for the calculated Lot Size and Risk/Reward to ensure the trade meets your plan.
- Reset: To restart, simply remove the indicator or delete the lines; the tool will prompt you for a new click.
Remember Professional traders know that risk management is the only "holy grail."
ABOUT THE DEVELOPER
RAYLURKS FX specializes in high-performance trading tools designed for the modern MQL5 environment. For support, setup guides, feature requests, troubleshooting, or to explore my other trading utilities please visit my profile and send me a direct message—I am happy to assist you in optimizing your trading setup: RAYLURKS FX MQL5 Profile