All in One Multi Indicator MT4

Overview

Comprehensive technical analysis indicator combining 20+ essential trading tools in a single chart display.

Moving Averages

  • EMA (Exponential Moving Average): 9, 21, 50, 200 periods
  • SMA (Simple Moving Average): configurable period
  • Customizable colors and line widths
  • Price position indicators (above/below)

Oscillators & Momentum

  • RSI (Relative Strength Index): adjustable overbought/oversold levels
  • MACD (Moving Average Convergence Divergence): customizable fast/slow/signal periods
  • Stochastic Oscillator: %K, %D, slowing parameters
  • KDJ Indicator: K, D, J calculations
  • CCI (Commodity Channel Index): configurable period
  • Momentum: customizable period
  • Real-time signal status (bullish/bearish/neutral)

Trend Analysis

  • ADX (Average Directional Index): trend strength measurement
  • +DI/-DI indicators
  • Parabolic SAR: step and maximum adjustable
  • Automatic trend detection (uptrend/downtrend/sideways/consolidation)
  • Trend strength confirmation
  • Multi-timeframe trend analysis

Volatility Measurements

  • ATR (Average True Range): configurable period
  • Bollinger Bands: adjustable period and deviation
  • Volatility percentage calculation
  • Standard deviation analysis

Volume Analysis

  • Volume ratio: current vs moving average
  • OBV (On Balance Volume)
  • VWAP (Volume Weighted Average Price): daily reset
  • Volume MA: customizable period
  • High/low/normal volume detection

Support & Resistance

  • Dynamic support/resistance levels: swing-based calculation
  • Daily pivot points: P, R1-R3, S1-S3
  • Adjustable strength parameters
  • Historical bars analysis
  • Automatic level updates

Information Panel

  • Real-time indicator values
  • Color-coded signals: red (bearish/overbought), green (bullish/oversold), white (neutral)
  • Customizable position (4 corners)
  • Adjustable font size
  • Compact display layout
  • Live timestamp updates

Customization Options

  • Individual indicator on/off toggles
  • Adjustable periods for all indicators
  • Custom color schemes
  • Line width settings
  • Threshold levels (RSI, ADX, etc.)
  • Panel corner positioning
  • Font size control

Technical Features

  • Single-file implementation
  • Minimal chart clutter
  • Efficient calculation methods
  • No external dependencies
  • Works on all timeframes
  • Compatible with all instruments (forex, stocks, commodities, crypto)

Display Elements

  • Chart indicators: lines, bands, dots
  • Horizontal lines: pivots, S/R levels
  • Text panel: indicator readings
  • Arrow markers: SAR signals

Configuration Groups

  • EMA settings
  • SMA settings
  • Bollinger Bands parameters
  • Pivot points
  • Support/Resistance detection
  • RSI configuration
  • MACD parameters
  • Stochastic settings
  • KDJ parameters
  • ATR settings
  • ADX configuration
  • Parabolic SAR
  • CCI settings
  • Momentum parameters
  • OBV options
  • VWAP display
  • Volume analysis
  • Trend detection
  • Volatility analysis
  • Display preferences
Önerilen ürünler
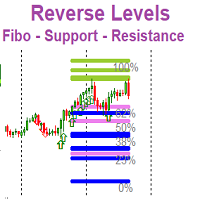
Possible Price reversals levels - based on  Fibonacci + Support +  Resistance Levels Auto levels drawn based on input index (Bars Count )  ---->>> Price Over 50% Fibo line ---> UP TREND ---> BUY when price drop near Support Lines  ---->>> Price Down 50% Fibo line ---> DOWN TREND ---> SELL when price goes up  near Resistance Lines  --->>> The more close price levels ----> the more possibility for price reversals --->>> are you a scalper --> try it on M1 charts with big index like 5000 bars  or
Tiger Trend
Leandro Bernardez Camero
Tiger Trend – Dinamik Aralığa Dayalı Trend Tersine Dönüş Göstergesi Güncellemelerden haberdar olmak için kanala katılın: https://www.mql5.com/en/channels/forexnewadvisor Tiger Trend , son fiyat aralıklarından hesaplanan uyarlanabilir destek ve direnç seviyelerine dayalı olarak potansiyel trend dönüşlerini tespit etmek için tasarlanmış dinamik bir trend göstergesidir. Bu gösterge, fiyatların bu dinamik eşiklere göre kapanışlarını analiz ederek momentumun değişip değişmediğini belirlemenize yardı
Fiyat seviyelerine göre işlem görselleştirme. Hesaplama için herhangi bir dönemi ayarlayabilirsiniz: iki dikey çizgi arasında veya sabit bir zaman aralığı. Histogram seviyeleri görecelidir: daha geniş bir çubuk daha fazla işlem hacmini ifade eder. Dağılım uçları destek ve direnç seviyeleri olarak kullanılabilir. Tüm stiller, boyutlar ve renkler özelleştirilebilir. Çok fonksiyonlu araç : 66+ fonksiyon içerir  |   Sorularınız için bana ulaşın  |  MT5 sürümü Göstergenin ayarlarında şunları yapıla
The indicator's source code is for sale; those interested can contact me via PM. Supply & Demand Retest Alert – Institutional Trading Simplified Supply & Demand Retest Alert (MT4) is a precision-driven trading tool designed for traders who focus on institutional price behavior and high-probability market zones. Built on the core principles of supply and demand trading, this indicator automatically identifies key imbalance areas where strong buying or selling previously occurred—zones where price
Holy Trend PRO
Bianca Seara
5 (1)
About Holy Trend was developed to identify trend and strength. VIDEO (information and tips) [HERE] Features Identifies trend Identifies strength of trend Identifies lines of support and resistance Easy to analyze Fast signals All timeframes Not repaint (when candle close) No settings required Can be used in Renko charts Can be used with indicator Holy Renko PRO Alerts, email and push notifications Advantages Sensitive identifier of trend able to identify the long, short movements and correc
NQX Retracement Entry Burst MT4, MetaTrader 4 için bir sinyal göstergesidir: düzeltme girişi sinyalleri (yalnızca volatilite son ortalamasının üzerine genişlerken sinyal verir). Önemli bir düzeltme bölgesine yapılan ve tutunan geri çekilmeyi tespit eden özel NQX mantığı. Yalnızca volatilite son ortalamasının üzerine genişlerken sinyal verir. Önerilen girişi, kısa bir stopu ve uzak hedefleri (3:1, 5:1, 10:1, swing'de 20:1'e kadar) çizer; kararı siz verirsiniz. Grafikte neler çizer - Kapanmış siny
Mood
Gevorg Hakobyan
This indicator is designed for trend trading and it helps in determining the best entry points. To identify the points, it is necessary to follow the signal line. Once the line crosses the zero level upwards - buy, and when it crosses downwards - sell. In addition to the signal line, the indicator also displays the so-called market "mood" in real time in the form of a histogram. The indicator works on all timeframes and with all instruments. The indicator operation required the Moving Average in
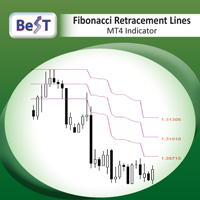
BeST_Fibonacci Retracement Lines is an MT4 Indicator that by default is based on common  Fibonacci levels but it can also draw any 3 desired levels of Retracement or Support of a trending move. It can be used to identify pullback points but also additionally as a kind of a Trailing Stop . BeST_Fibonacci Retracement Lines indicator: • by default draws 38.2%, 50% and 61.8% Retracement Levels of the current price move defined using the Highest High (HH) and Lowest Low (LL) of a desired Look Back Pe
Stop relying on a single oscillator for your reversals!   Divergence Pro is a professional-grade analytical tool designed to spot high-probability market reversal points by finding   confluence across 11 powerful oscillators . Instead of getting fake signals from just one RSI or MACD, Divergence Pro scans the market and only alerts you when multiple indicators agree on a divergence at the exact same time. It filters out the noise and leaves you with only the strongest setups.   KEY FEATURES:
RQL_BOX Indicator — English Description (How to Use) What it does RQL_BOX   is a   manual range box tool   controlled by two draggable vertical lines: LEFT handle (v-line):   selects a candle on a chosen timeframe and sets the box   High/Low to that candle’s wicks . RIGHT handle (v-line):   defines   how far to extend   the box to the right (projection end). It then draws: the main box (range), optional   top/bottom 20% zones , an optional   50% midpoint line , and an on-chart   info panel   wit
FREE
This is no ordinary channel. Everyone should analyze it and find a way to use it in their trading strategies. Like all channels, it has a middle line as well as a high and low line. This channel is worth watching for its unusual behavior. The use of the Channel Reliable indicator allows the trader to react in time to the price going beyond the boundaries of the channel set for it. This corridor is built on the basis of the analysis of several candles, and changes in the parameter of the number
MQL5 Blogları = https://www.mql5.com/en/blogs/post/774983 MT4 Sürümü = https://www.mql5.com/en/market/product/193085 MT5 Sürümü = https://www.mql5.com/en/market/product/193086 KELTNER LIQUIDITY [tambangEA]; Keltner Kanalı trend yapısını, Alım Yönlü Likidite (BSL), Satım Yönlü Likidite (SSL) ve onaylanmış likidite süpürme (sweep) sinyalleriyle birleştiren profesyonel bir piyasa yapısı ve likidite analiz göstergesidir. Bu gösterge, yatırımcıların fiyatın olası bir reddedilme veya dönüş hareketi
XFibo Auto Fibonacci
Welinton Dos Reis Goncalves
5 (1)
Use with disciplined risk management. Fibonacci entry system based on the golden zone 38.2 - 61.8 where the entry is confirmed at 23.6 with indications of Take Profit 3:1. Automatically plotted Fibonacci contains retracement and expansion Fibonacci in a single indicator. Up to 77% win rate with this system. FTMO challenge pass with 0.50% risk and 1.50% R:R.
MQL5 Blogları: https://www.mql5.com/en/blogs/post/770443 MT4 Sürümü: https://www.mql5.com/en/market/product/157434 MT5 Sürümü: https://www.mql5.com/en/market/product/178388 RANGE LADDER [tambangEA], görünür grafik aralığı içindeki piyasa aktivitesinin daha net bir görünümünü isteyen yatırımcılar için geliştirilmiş profesyonel bir görsel analiz göstergesidir. Gösterge, fiyat bölgeleri arasında tick hacmi aktivitesinin nasıl dağıldığını gösteren birinci sınıf bir aralık merdiveni panosu oluşturu
VaviStar is an indicator based on trend retracements determined by ZigZag segments. It is theorized, and statistics confirm, that stocks react to certain retracement levels. Many use Fibonacci retracement levels (23.6%, 38.2%, 61.8%). It is assumed that once the price goes beyond the 61.8% retracement, we can already speak of a trend reversal. This indicator allows you to comfortably chart a segment of the ZigZag with the relative operating levels chosen. With a reversal mindset , you can use it
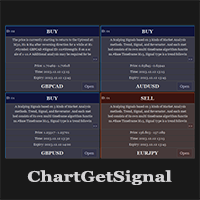
Provides instant signals on the chart in panel form. Equipped with signal description and trading analysis tools such as drawing auto trendlines, support/resistance area, regression channel, Fibonacci levels, Pivot levels and current signal price, signal time, signal expiry and stoploss recommendation. Also sending alert messages to all available mt4 alert tool. A detailed description panel provides information about where the signal comes from and what indicators are behind the signal. Includin
XLines MT4
Farid Shyhaliev
5 (2)
X-Lines 2.0 Pro I want to present for your attention a new and completely updated and expanded version of X-Lines indicator. Version 2.0 Pro has many new features and can make your analysis more productive. Please read full instructions here . Please before purchasing try free version. Free and limited version (you can set only one alert): here 1) Multi-timeframe settings and user-friendly control panel. You can dynamically select and save indicator settings not only for each currency pairs
Rocket Two – Entry Point Indicator for MT4 Identify Market Direction. Track Dynamic Stops. Recognize Potential Entry Opportunities. Rocket Two is a technical analysis indicator for MetaTrader 4 designed to help traders identify potential changes in market direction through dynamic stop levels and visual Buy/Sell signals. With a clear chart display and configurable parameters, Rocket Two helps traders monitor market trends and evaluate potential trading opportunities across different financial in
Zakirulbd Candle Timer V7   Professional trader utilities. Minimal design. Maximum clarity. Zakirulbd Candle Timer V7 is a professional MT5 indicator designed to display the remaining time of the current candle directly on your chart in a clean, distraction-free format. One of the most common frustrations among traders is not knowing exactly how much time remains before a candle closes. Many traders moving from other platforms actively look for a reliable candle countdown timer before fully ado
FREE
Effect
Maryna Shulzhenko
The Effect indicator shows the points of potential market reversal. Simple, visual and efficient trend detection. Ready-made trading system. The intelligent algorithm of the indicator determines the trend with good probability. Uses just one parameter for settings. The indicator does not redraw and does not lag. Works on all currency pairs and all timeframes. You should remember that using a combination of forecasting tools, it is advisable to choose 2-3 indicators for trading. Otherwise, thei
PowerXXX
Marco Fornero Monia
PowerXXX measures the power of the current candlestick and displays it in numerical format and colors. The indicator can cover multiple timeframes and can be placed on the main chart or on the charts of the underlying indicators. The number of timeframes is selectable, as well as the color levels according to the power expressed. In the latest version, the power can be expressed as a function of the opening of the candle itself or as a function of the opening of the total candles before. There
MQL5 Blogları: https://www.mql5.com/en/blogs/post/768823 MT4 Sürümü: https://www.mql5.com/en/market/product/171247 MT5 Sürümü: https://www.mql5.com/en/market/product/171248 FIBONACCI PROJEKSİYONU [tambangEA], yatırımcıların piyasa yapısını, Fibonacci projeksiyon hedeflerini, hacim tepki bölgelerini ve yönsel devam alanlarını doğrudan grafik üzerinde belirlemelerine yardımcı olmak için tasarlanmış profesyonel bir gösterge paneli tabanlı işlem analiz aracıdır. Araç, en son salınım yapısını otom
The Chart Mechanics SMC Indicator for MetaTrader 4 marks market structure on your chart: supply and demand zones, breaks of structure, liquidity grabs and fair value gaps. Everything is calculated from closed candles. What it shows Fresh supply and demand zones, extended to the right until price returns to them, with the option to also show zones that have been revisited Breaks of structure (BOS) and liquidity grabs (LQG, where price runs a recent high or low and turns back), labelled next to re
Moving Wizard indicator will guide you to work with Trend and give pure Entry point depending on crossing on the chart it work on all currency and all Timeframe you can use it daily or scalping or swing its good with all and This indicator you can make it your strategy  i work on it on H1 Timframe and make a good money you can take alook on it and you see a great resault on chart  .Gold moving is to Know the Trend of price other moving below it mean we looking to sell orders . if above it we loo
NO REPAINT ADVANCED CHART PATTERN INDICATOR By definition, a price ( chart)  pattern is a recognizable configuration of price movement that is identified using a series of  trendlines  and/or curves. When a price pattern signals a change in trend direction, it is known as a reversal pattern; a continuation pattern occurs when the trend continues in its existing direction following a brief pause. Advanced Chart Pattern Tracker is designed to find the MOST ACCURATE patterns. A special script is a
Reincarnations
Maryna Shulzhenko
The Reincarnations trend indicator is used to determine the strength and direction of a trend and to find price reversal points. This tool scans the market looking for the correct entry. You can see and evaluate it yourself, perhaps it will suit you for a number of tasks related to forecasting price movements. It uses only price data and analytics to calculate entry points. Does not use auxiliary indicators. It has two parameters for customization. Indicator setting. Interval - price analysis
Overview This is the DELUXE version in the Pivot Point Plotter Series. It is a robust indicator that dynamically calculates and plots any of the 4 major pivot points on your chart irrespective of intra day timeframe on which the indicator is placed. This indicator is capable of plotting STANDARD, CAMARILLA, FIBONNACI or WOODIE daily pivot points. Whichever you use in your trading, this indicator is your one-stop shop. Kindly note that it is a DAILY Pivot Point Plotter for DAY TRADERS who trade o
Quantum VWAP Pro
QUANTUM TRADING SOFTWARE LIMITED
The VWAP indicator is another of our suite of volume indicators and one which was first referred to in 1988 when it appeared in an article entitled “The Total Cost Of Transactions On The NYSE” in the March edition of the Journal Of Finance from that year, which went on to explain its importance, particularly from an institutional perspective, which underpins its significance in appreciating the power and importance of this indicator. In many ways, it is akin to the volume price analysis methodol
The indicator plots flexible support and resistance levels (dots). A special phase of movement is used for construction. Levels are formed dynamically, that is, each new candle can continue the level or complete it. The level can provide resistance or support to the price even where it is no longer there. Also, support and resistance levels can change roles. The importance of levels is affected by: the amount of time the level is formed and the number of touches. The significance of these lev
Fibonacci Trend Marker —  mevcut mumun önceki mumların Yüksek-Düşük (High-Low, HL) aralığına göre davranışını Fibonacci geri çekilme seviyelerini kullanarak analiz eden bir trend göstergesidir. Trendin gücünü görsel olarak takip eder ve mum renginin değişimiyle olası zayıflama veya tersine dönüş sinyalleri verir. Özellikler: Trend odaklı traderlar için tasarlanmıştır ve Fibonacci seviyelerine dayanarak trend değişikliklerini hızlıca tespit etmeye yardımcı olur. Piyasada yeterli volatilite olduğ
Bu ürünün alıcıları ayrıca şunları da satın alıyor
Currency Strength Wizard , başarılı ticaret için size hepsi bir arada çözüm sağlayan çok güçlü bir göstergedir. Gösterge, birden çok zaman dilimindeki tüm para birimlerinin verilerini kullanarak şu veya bu forex çiftinin gücünü hesaplar. Bu veriler, şu veya bu para biriminin gücünü görmek için kullanabileceğiniz, kullanımı kolay para birimi endeksi ve para birimi güç hatları biçiminde temsil edilir. İhtiyacınız olan tek şey, işlem yapmak istediğiniz tabloya göstergeyi eklemektir ve gösterge size
Trend SniperX MT4
Sarvarbek Abduvoxobov
5 (6)
Trend Sniper X , işlemcilerin trend yönünü ve olası dönüş noktalarını netlik ve hassasiyetle belirlemelerine yardımcı olan MetaTrader 5 için çoklu zaman dilimli bir trend takip göstergesidir. MT5 İçin: https://www.mql5.com/en/market/product/181101 Fiyat Bilgisi: Mevcut fiyat tanıtım amaçlıdır ve gelecek güncellemeler ile yeni özellikler eklendikçe değişebilir. Code2Profit Kanalı Çoklu Zaman Dilimi Analizi ile Piyasaya Hakim Olun! Trend Sniper X ile Kazanma Oranınızı Nasıl En Üst Düzeye Çıkarırsı
M1 Sniper
Oleg Rodin
4.97 (30)
M1 SNIPER kullanımı kolay bir işlem göstergesi sistemidir. M1 zaman dilimi için tasarlanmış bir ok göstergesidir. Gösterge, M1 zaman diliminde scalping için bağımsız bir sistem olarak kullanılabilir ve mevcut işlem sisteminizin bir parçası olarak kullanılabilir. Bu işlem sistemi özellikle M1'de işlem yapmak için tasarlanmış olsa da, diğer zaman dilimleriyle de kullanılabilir. Başlangıçta bu yöntemi XAUUSD ve BTCUSD ticareti için tasarladım. Ancak bu yöntemi diğer piyasalarda işlem yaparken de ya
Smart Trend Trading System, trend bilgilerini, giriş ve çıkış sinyallerini ve fiyat seviyelerini tek bir grafikte birleştiren bir MetaTrader 4 göstergesidir. Trend tespiti, dönüş bölgeleri, Smart Cloud, trailing stop mantığı, destek ve direnç, mum renklendirme, uyarılar ve çoklu zaman dilimi analizi dahil olmak üzere 10’dan fazla trading aracını tek bir sistemde birleştirir. Sistem, farklı piyasa koşullarında işlem yapmanıza yardımcı olmak için tasarlanmıştır: Trend piyasaları: Ana trendi belir
SIO Oscillator: Kendi Kendini Optimize Eden Yarı Varyans Dengesizlik Osilatörü İndikatörü satın alın, ona dayalı Uzman Danışmanı (EA) ÜCRETSİZ edinin. Çoğu osilatör, tüm fiyat hareketlerini aynı şekilde değerlendirir. SIO ise yükseliş ve düşüş baskısını birbirinden ayırır ve aralarındaki dengesizliği ölçerek piyasayı gerçekte kimin kontrol ettiğini gösterir: alıcılar mı, satıcılar mı. Dengesizlik bir uç noktaya ulaştığında SIO, giriş, Stop Loss ve Take Profit seviyeleriyle birlikte net bir sinya
Liquidity Scalper System: gösterge formatında likiditeye dayalı bir işlem sistemi. Çoğu gösterge yalnızca bir ok gösterir; sonrasında stopun nereye konacağına, hedefin nerede olduğuna ve sinyale güvenilip güvenilmeyeceğine trader kendisi karar verir. Liquidity Scalper System işlemin tüm döngüsünü kapsar: likidite havuzlarını bulur, kırılımlarında sinyal verir, Entry, Stop Loss ve üç hedefi anında hesaplar, panelde ise istatistikleri ve yeni veriler üzerindeki doğrulama sonuçlarını gösterir. Sis
Gann Made Easy
Oleg Rodin
4.84 (174)
Gann Made Easy , bay teorisini kullanarak ticaretin en iyi ilkelerine dayanan, profesyonel ve kullanımı kolay bir Forex ticaret sistemidir. WD Gann. Gösterge, Zararı Durdur ve Kâr Al Seviyeleri dahil olmak üzere doğru SATIN AL ve SAT sinyalleri sağlar. PUSH bildirimlerini kullanarak hareket halindeyken bile işlem yapabilirsiniz. Satın alma işleminden sonra, alım satım talimatlarını ve harika ek göstergeleri ücretsiz olarak almak için lütfen benimle iletişime geçin! Muhtemelen Gann ticaret yöntem
Advanced Supply Demand
Bernhard Schweigert
4.91 (302)
Özel Ticaret –%30 İndirim Yeni Başlayanlar veya Uzman Yatırımcılar İçin En İyi Çözüm! Bu gösterge, bir dizi özel özellik ve yeni bir formül içerdiği için benzersiz, yüksek kaliteli ve uygun fiyatlı bir işlem aracıdır. Bu güncelleme ile çift zaman dilimi bölgeleri gösterebileceksiniz. Sadece daha yüksek bir zaman dilimini değil, hem grafik zaman dilimini hem de daha yüksek zaman dilimini gösterebileceksiniz: İÇ İÇE GEÇMİŞ BÖLGELER GÖSTERİYOR. Tüm Arz Talep yatırımcıları buna bayılacak. :) Önem
Bu gösterge, pratik ticaret için mükemmel olan otomatik dalga analizine yönelik bir göstergedir! Dava... Not:   Dalga sınıflandırması için Batılı isimleri kullanmaya alışkın değilim. Tang Lun'un (Tang Zhong Shuo Zen) adlandırma kuralının etkisiyle, temel dalgayı   kalem   , ikincil dalga bandını ise   segment   olarak adlandırdım. aynı zamanda segmentin trend yönü vardır. Adlandırma   esas olarak trend segmentidir   (bu adlandırma yöntemi gelecekteki notlarda kullanılacaktır, öncelikle söyleyey
Şu anda %30 İNDİRİMLİ! Herhangi bir Acemi veya Uzman Tüccar için En İyi Çözüm! Bu gösterge paneli yazılımı 28 döviz çifti üzerinde çalışıyor. Ana göstergelerimizden 2'sine (Gelişmiş Para Birimi Gücü 28 ve Gelişmiş Para Birimi Dürtüsü) dayanmaktadır. Tüm Forex piyasasına harika bir genel bakış sağlar. Gelişmiş Para Birimi Gücü değerlerini, para birimi hareket hızını ve tüm (9) zaman dilimlerinde 28 Forex çifti için sinyalleri gösterir. Trendleri ve / veya scalping fırsatlarını belirlemek için
This is a professional chart indicator designed for traders focused on stability and clear price action. It helps filter market noise and provides clear visual entry and exit zones for your trading decisions. Price Information: The current price is promotional and is subject to change as upcoming updates and new features are released. MQL5 public channel:  CLICK HERE for MT5:  Non-repainting MT5 version Core Features: Strictly Non-Repainting: The system is built with strict non-repaint logic. W
Scalper Vault
Oleg Rodin
4.9 (41)
Scalper Vault, gün içi işlemlerde istikrar yakalamak isteyen yatırımcılar için tasarlanmış, güçlü ve tam donanımlı bir alım satım sistemidir. Bu yüksek hassasiyetli gösterge; hem Forex hem de İkili Opsiyon yatırımcıları için kurumsal düzeyde analizler sunan, bağımsız ve eksiksiz bir alım satım sistemi işlevi görür. SATIN ALIM İŞLEMİNDEN SONRA BENİMLE İLETİŞİME GEÇİN; ALIM SATIM İPUÇLARIMI VE HARİKA BİR BONUSU ALIN! Tahmin yürütme zorunluluğunu ve karmaşık manuel analiz süreçlerini ortadan kaldır
Sizlere ON Trade Waves Patterns Harmonic Elliot Wolfe'u tanıtmaktan mutluluk duyarız. Bu, manuel ve otomatik yöntemleri kullanarak piyasada çeşitli desenleri tespit etmek için tasarlanmış gelişmiş bir göstergedir. İşte nasıl çalıştığı: Harmonik Desenler: Bu gösterge, grafiğinizde görünen harmonik desenleri tanımlayabilir. Bu desenler, Scott Carney'in "Harmonic Trading vol 1 & 2" adlı kitabında açıklandığı gibi harmonik ticaret teorisini uygulayan tüccarlar için önemlidir. Onları manuel olarak ç
RFI levels PRO
Roman Podpora
5 (2)
Bu gösterge, fiyat dönüş noktalarını ve fiyat geri dönüş bölgelerini doğru bir şekilde gösterir.       Başlıca oyuncular   . Yeni trendlerin nerede oluştuğunu görüyorsunuz ve her işlem üzerinde kontrolü elinizde tutarak, azami hassasiyetle kararlar alıyorsunuz. TREND LINES PRO   göstergesiyle birlikte kullanıldığında maksimum potansiyelini ortaya koyar.  VERSION MT5 Göstergenin gösterdiği şey: Yeni bir trendin başlangıcında aktivasyonla birlikte tersine dönüş yapıları ve tersine dönüş seviyeler
Zoryk Gold mt4
Reda El Koutbane
5 (4)
ZORYK — MetaTrader 4 için gelişmiş XAUUSD sinyal ve işlem planlama sistemi Bu durumu muhtemelen daha önce yaşadınız. Altını analiz edersiniz, giriş için beklersiniz ve sonunda işlemi açarsınız. Fiyat hemen ters yönde hareket eder. Çok erken kapatırsınız, Stop Loss seviyesini değiştirirsiniz veya birkaç saniye tereddüt edersiniz. Kısa süre sonra piyasa, siz işlemde değilken başlangıçta beklediğiniz yöne ve hedefe ulaşır. Sorun her zaman yön değildi. Asıl sorun belirsizlikti. Tam olarak nere
ShapeRadar - klasik grafik formasyonu göstergesi ShapeRadar, teknik analizin klasik formasyonlarını grafik üzerinde otomatik olarak bulur: çift ve üçlü tepe ve dipler, Omuz-Baş-Omuz ve ters versiyonu, yükselen ve alçalan kamalar, dikdörtgenler, üçgenler, bayraklar ve flamalar. Fiyat bir formasyonun sınırının ötesinde kapandığında gösterge formasyonu, giriş noktasını, zarar durdur seviyesini ve hedefi çizer; bilgi paneli de tespit edilen tüm formasyonları özetler. MetaTrader 5 sürümü:  https://ww
PRO Renko Sistemi, RENKO grafikleri ticareti için özel olarak tasarlanmış son derece hassas bir ticaret sistemidir. Bu, çeşitli ticaret araçlarına uygulanabilen evrensel bir sistemdir. Sistemi etkin piyasa sana doğru ters sinyallerine erişim hakkı denilen ses nötralize eder. Göstergenin kullanımı çok kolaydır ve sinyal üretiminden sorumlu tek bir parametreye sahiptir. Aracı, seçtiğiniz herhangi bir ticaret aracına ve renko çubuğunun boyutuna kolayca uyarlayabilirsiniz. Yazılımımla karlı bir
SR Liquidity
Oleg Rodin
5 (3)
SR Liquidity , piyasa likiditesinin yoğunlaştığı ve fiyatın en güçlü tepkiyi verdiği gizli bölgeleri ortaya çıkarmak için tasarlanmış bir alım-satım göstergesidir. Bu özel likidite alanları güçlü destek ve direnç seviyeleri işlevi görerek, piyasanın yön değiştirme ihtimalinin en yüksek olduğu yerlere dair size net bir harita sunar. SR Liquidity, sıradan Destek/Direnç çizgileri çizmek yerine, alım ve satım baskısının yoğunlaştığı bölgeleri tespit etmek için gerçek fiyat hareketlerini analiz eder.
Auto Optimized SpeedAngle , sürekli İleriye Dönük Optimizasyon (Walk-Forward Optimization, WFO) yoluyla eğri uydurmayı (curve-fitting) ortadan kaldıran kurumsal düzeyde bir momentum vektörleme sistemidir. Piyasa rejimleri değiştiğinde etkinliğini yitiren statik girdilere güvenmek yerine, gösterge, örneklem dışı (Out-of-Sample, OOS) doğrulama kullanarak parametrelerini dinamik olarak yeniden kalibre eder ve böylece gösterilen sinyallerin geçmişteki rastgele anomalileri değil, gerçek bir istatisti
Professional Volume Profile An indicator for MetaTrader 4 that builds a horizontal Volume Profile directly on the price chart. It shows the levels where traders executed the most trades, helping to identify support/resistance zones and assess the balance of power in the market. What the Indicator Displays POC (Point of Control) — the level with the maximum trading volume (red line). VAH / VAL (Value Area High / Low) — the upper and lower boundaries of the value area, where 70% of the volume was
Italo Volume Indicator
Italo Santana Gomes
4.92 (79)
BUY INDICATOR AND GET EA FOR FREE AS A BONUS + SOME OTHER GIFTS! ITALO VOLUME INDICATOR  is the best volume indicator ever created, and why is that? The Indicator works on all time-frames and assets, indicator built after 7 years of experience on forex and many other markets. You know many volume indicators around the internet are not complete, does not help, and it's difficult to trade, but the Italo Volume Indicator is different , the Italo Volume Indicator shows the wave volume, when market
Gelişmiş matematiksel hesaplamalara dayanarak en olası kısa vadeli fiyat hareketini tahmin eder. Özellikler Grafiğin zaman diliminde ve tüm üst zaman dilimlerinde yakın fiyat hareketinin tahmini; Piyasanın gerçek trendinin hesaplanması; En önemli destek ve direnç seviyelerinin hesaplanması; Sıkışma bölgeleri, seviye kesişimleri ve trend değişimleri için uyarılar; Sistem kaynaklarını az kullanır: çizgiler ve panel yalnızca bir değer değiştiğinde güncellenir; Kendi kendini ayarlar: her sembolde v
Atomic Analyst
Issam Kassas
5 (14)
Atomic Analyst — MetaTrader 4 Ürün soruları, kurulum rehberliği veya teknik destek için bana doğrudan MQL5 üzerinden mesaj gönderin. İndikatör, karmaşık piyasa hesaplamalarını basit görsel sinyallere, renk kodlu mumlara, trend okumalarına, stop-loss seviyelerine ve traderların hızlıca anlayıp gerçek piyasa koşullarında kullanabileceği çoklu take-profit bölgelerine dönüştürür. Ana trading kullanım alanları: Scalping ve gün içi işlem: Hızlı karar alma, net oklar, uyarılar, mum renkleri ve yapılan
Scalping Entry Points - fiyat hareketlerine uyum sağlayabilen ve yeniden çizmeden alım satımları açmak için sinyaller verebilen manuel bir alım satım sistemidir. Gösterge, merkezi destek ve direnç seviyesine göre trendin yönünü belirler. Nokta göstergesi, girişler ve çıkışlar için sinyaller sağlar. Manuel gün içi ticaret, ölçeklendirme ve ikili opsiyonlar için uygundur. Tüm zaman dilimlerinde ve ticaret enstrümanlarında çalışır. Gösterge birkaç türde uyarı verir. ürün nasıl kullanılır Mavi çiz
All in One package includes the  Oscillator Predictor ,  MACD Predictor ,  Thrust Scanner  and  Advanced Fibonacci  indicators which are mandatory for applying  Dinapoli  trade plans.  Please visit below links for detailed explanations of indicators. Advanced Fibonacci Indicator =>  https://www.mql5.com/en/market/product/52834 Thrust Scanner Indicator => https://www.mql5.com/en/market/product/52830 Overbought /Oversold Predictor indicator => https://www.mql5.com/en/market/product/52621 Macd P
True Direction Oscillator
Muhammad Elbermawi
4.85 (364)
Veya "Saf Momentum " ilkesini kullanarak fiyat değişim oranını ölçen bir endeks olan (TDO). Bir menkul kıymet fiyatı 10'dan 15'e yükseldiğinde, fiyat değişim oranı %150'dir, ancak 15'ten 10'a düştüğünde, fiyat değişim oranı sadece %33.3'tür. Bu nedenle, "Fiyat Değişim Oranı" (ROC) veya "Momentum" gibi teknik analiz göstergeleri, artan fiyat hareketleri için azalan hareketlere göre daha yüksek değerler verir. TDO, yatırımcıların momentumu doğru okumalarına yardımcı olmak için bu sorunu düzeltir.
Quantum Imbalance Profiles , denge ve dengesizlik evrelerini gösteren bir göstergedir. Piyasanın hangi fiyatlarda hacim işlem gördüğünü, bu bölgede hangi tarafın baskın olduğunu ve fiyatın ardından hangi seviyeler üzerinden impulsla genişlediğini gösterir. Klasik hacim profili tek bir soruyu yanıtlar: işlemler nerede gerçekleşti. Her fiyatta hangi tarafın baskın olduğunu, yatay seyrin nasıl sonuçlandığını ve piyasanın hangi yöne çıktığını göstermez. Quantum Imbalance Profiles profili Volume Bid/
Forex için manuel ticaret ve teknik analiz göstergesi. İşlem gününün açılış seviyesini gösteren bir trend göstergesi ve giriş noktalarını belirlemek için bir ok göstergesinden oluşur. Gösterge yeniden renklenmez; mum kapandığında çalışır. Sinyal okları için çeşitli uyarı türleri içerir. Herhangi bir grafikte, alım satım aracında veya zaman diliminde çalışacak şekilde yapılandırılabilir. Çalışma stratejisi trend boyunca fiyat hareketlerini aramaya dayanmaktadır.  " Buy " işlemleri yapabilmek
Currency Strength Matrix
Raymond Gilmour
4.5 (26)
THE ONLY CURRENCY STRENGTH INDICATOR BUILT ON PRICE ACTION Most currency strength meters average an oscillator, or measure how far price has travelled. But these are not accurate measures of trend, Currency Strength Matrix measures trend strength, not just if a currency price has gone up or down. Currency Strength Matrix reads market structure . For each of the 28 major pairs it finds the confirmed cycle highs and lows, and decides whether that pair is in an uptrend, a downtrend, or neither. A
Dark Support Resistance  is an Indicator for intraday trading. This Indicator is programmed to identify  Support and Resistance Lines , providing a high level of accuracy and reliability. Key benefits Easily visible lines Only the most important levels will be displayed Automated adjustment for each timeframe and instrument Easy to use even for beginners Never repaints, never backpaints, Not Lag 100% compatible with Expert Advisor development All types of alerts available: Pop-up, Email, Push
Yazarın diğer ürünleri
Overview Auto Fibonacci EA is a professional trading tool designed to automatically detect swing points and draw Fibonacci retracement levels on your charts. This indicator helps traders identify potential support and resistance zones based on the golden ratio principles. Key Features Automatic Swing Detection Intelligent algorithm identifies swing high and swing low points automatically Customizable swing detection sensitivity (SwingBars parameter) Works on all timeframes: M1, M5, M15, M30, H1
FREE
Copy MT5 MT4 All In One
Teerathad Booranawisedkul
5 (1)
MetaTrader 5 Trade Copier (MT5 Version) This Expert Advisor is developed for copying trading operations between MetaTrader terminals. This version is intended for use on MetaTrader 5. For copying operations involving MetaTrader 4, please use the corresponding MT4 version available in the Market.  https://www.mql5.com/en/market/product/161876 Supported platform combinations: MT5 to MT5 (This Version) MT4 to MT4 MT4 to MT5 MT5 to MT4 The copier transfers market orders according to the selected co
EA Gold ZigZag
Teerathad Booranawisedkul
Gold ZigZag is a fully automated Expert Advisor designed for gold trading (XAUUSD) that utilizes a modified ZigZag indicator to identify key market swing points. The EA employs pending orders at strategic levels with strict risk management and trailing stop functionality. Trading Strategy The Expert Advisor implements a ZigZag-based breakout strategy combined with multiple confirmation filters: Core Logic - ZigZag Detection**: Identifies significant high and low pivot points using customizable
FREE 7-DAY TRIAL After your trial ends, continue using this essential trading tool for only $30 one-time payment. ECONOMIC CALENDAR Transform Your Trading with Real-Time Economic Intelligence on Your Chart Are you tired of being caught off-guard by major economic news releases? Stop scrambling between your trading platform and news websites. Economic Calendar Pro brings all critical market events directly to your MetaTrader charts with stunning visual clarity and real-time countdown timers. P
Auto Fibonacci Re
Teerathad Booranawisedkul
Overview Auto Fibonacci EA is a professional trading tool designed to automatically detect swing points and draw Fibonacci retracement levels on your charts. This indicator helps traders identify potential support and resistance zones based on the golden ratio principles. Key Features Automatic Swing Detection Intelligent algorithm identifies swing high and swing low points automatically Customizable swing detection sensitivity (SwingBars parameter) Works on all timeframes: M1, M5, M15, M30, H1
FREE
Swing Low MT4
Teerathad Booranawisedkul
Key Features: Automatic swing detection on any timeframe (M1 to MN1) Visual arrow indicators (red for swing highs, blue for swing lows) Adjustable sensitivity with customizable swing strength parameter Dynamic arrow positioning that never overlaps with candles Instant display when changing timeframes - no delays Compatible with MT4 and MT5 platforms Clean, professional interface with minimal screen clutter Lightweight code for fast performance Customizable colors and arrow sizes Customizable S
FREE
Swing Low
Teerathad Booranawisedkul
Key Features: Automatic swing detection on any timeframe (M1 to MN1) Visual arrow indicators (red for swing highs, blue for swing lows) Adjustable sensitivity with customizable swing strength parameter Dynamic arrow positioning that never overlaps with candles Instant display when changing timeframes - no delays Compatible with MT4 and MT5 platforms Clean, professional interface with minimal screen clutter Lightweight code for fast performance Customizable colors and arrow sizes Customizable S
FREE
FREE 7-DAY TRIAL After your trial ends, continue using this essential trading tool for only $35 one-time payment. Telegram Trading Report Pro Telegram Trading Report Pro is a professional MT4 Expert Advisor designed to keep traders fully informed about their trading activity through real-time Telegram notifications and automated performance reports. This EA is ideal for traders who want full transparency, instant alerts, and clear performance summaries without staying in front of the trading ter
MetaTrader 4 Trade Copier (MT4 Version) This Expert Advisor is developed for copying trading operations between MetaTrader terminals. This version is intended for use on MetaTrader 4. For copying operations involving MetaTrader 5, please use the corresponding MT5 version available in the Market.  https://www.mql5.com/en/market/product/161757 Supported platform combinations: MT5 to MT5 MT4 to MT4  (This Version) MT4 to MT5 MT5 to MT4 The copier transfers market orders according to the selected
EA Close All MT4
Teerathad Booranawisedkul
FREE 7-DAY TRIAL After your trial ends, continue using this essential trading tool for only $30 one-time payment. EA Close All MT4 FEATURES - Close ALL orders instantly - Close by type: BUY or SELL only - Close by P/L: PROFIT or LOSS only - Close BUY PROFIT / BUY LOSS - Close SELL PROFIT / SELL LOSS - Delete all PENDING orders - Real-time P/L display - Zero configuration needed LIVE DASHBOARD - Total positions counter - BUY/SELL breakdown - Individual P/L tracking - Pending orders count - Colo
EA Dashboard MT4
Teerathad Booranawisedkul
FREE 7-DAY TRIAL After your trial ends, continue using this essential trading tool for only $30 one-time payment. This utility is designed to assist traders in monitoring account status, open positions, and trading performance in real time. It provides consolidated information related to account metrics, risk exposure, and statistical performance to support trading analysis and decision-making. The product does not execute trades automatically and does not provide trading signals. It is intende
FREE 7-DAY TRIAL After your trial ends, continue using this essential trading tool for only $30 one-time payment. Key Features Real-Time Multi-Timeframe Display Monitor 9 timeframes at once: M1, M5, M15, M30, H1, H4, D1, W1, MN1 Live countdown updates on every tick Clear, easy-to-read format On-Chart Timer Display Visual timer positioned directly above the current candle Adjustable height and positioning Customizable colors and font sizes Never blocks your price action Universal Broker Compa
WIKIFX ULTRA LOW LATENCY BROKER MONITOR Discover the fastest forex brokers for your trading location with real-time network latency analysis. This professional monitoring tool helps you identify brokers with ultra-low ping times, essential for scalping, high-frequency trading, and optimal order execution. KEY FEATURES Comprehensive Broker Database Monitor 40+ top-rated forex brokers worldwide Data sourced from WikiFX's trusted broker ratings Coverage across Asia-Pacific, Europe, and Americas R
FREE 7-DAY TRIAL After your trial ends, continue using this essential trading tool for only $30 one-time payment. ECONOMIC CALENDAR Transform Your Trading with Real-Time Economic Intelligence on Your Chart Are you tired of being caught off-guard by major economic news releases? Stop scrambling between your trading platform and news websites. Economic Calendar Pro brings all critical market events directly to your MetaTrader charts with stunning visual clarity and real-time countdown timers. P
Monthly Calendar Dashboard   eliminates the guesswork entirely. It places a live, color-coded calendar directly on your chart — showing exactly what happened on every single trading day: how much you made, how much you lost, how deep your drawdown went, and whether your edge is actually working. No spreadsheets. No exporting data. No mental math. Just open your chart and   see   your month. What You See at a Glance Every day on the calendar shows you five critical numbers the moment you look at
EA Close All MT5
Teerathad Booranawisedkul
FREE 7-DAY TRIAL After your trial ends, continue using this essential trading tool for only $30 one-time payment. EA Close All MT5  FEATURES - Close ALL orders instantly - Close by type: BUY or SELL only - Close by P/L: PROFIT or LOSS only - Close BUY PROFIT / BUY LOSS - Close SELL PROFIT / SELL LOSS - Delete all PENDING orders - Real-time P/L display - Zero configuration needed LIVE DASHBOARD - Total positions counter - BUY/SELL breakdown - Individual P/L tracking - Pending orders count - Col
FREE 7-DAY TRIAL After your trial ends, continue using this essential trading tool for only $35 one-time payment. Key Features Complete Alert System - Order Notifications - TP/SL Alertst - Pending Orders - Margin Warnings Rich Trading Information - Real-time account balance and equity - Profit/Loss for each trade - Holding time calculation - Drawdown percentage (DD%) - Daily win rate statistics - Today's trades summary (Wins/Losses) Multi-Language Support Choose from 9 languages - English, T
EA Dashboard MT5
Teerathad Booranawisedkul
FREE 7-DAY TRIAL After your trial ends, continue using this essential trading tool for only $30 one-time payment. This utility is designed to assist traders in monitoring account status, open positions, and trading performance in real time. It provides consolidated information related to account metrics, risk exposure, and statistical performance to support trading analysis and decision-making. The product does not execute trades automatically and does not provide trading signals. It is intend
FREE 7-DAY TRIAL After your trial ends, continue using this essential trading tool for only $30 one-time payment. Key Features Real-Time Multi-Timeframe Display Monitor 9 timeframes at once: M1, M5, M15, M30, H1, H4, D1, W1, MN1 Live countdown updates on every tick Clear, easy-to-read format On-Chart Timer Display Visual timer positioned directly above the current candle Adjustable height and positioning Customizable colors and font sizes Never blocks your price action Universal Broker Compa
WIKIFX ULTRA LOW LATENCY BROKER MONITOR Discover the fastest forex brokers for your trading location with real-time network latency analysis. This professional monitoring tool helps you identify brokers with ultra-low ping times, essential for scalping, high-frequency trading, and optimal order execution. KEY FEATURES Comprehensive Broker Database Monitor 40+ top-rated forex brokers worldwide Data sourced from WikiFX's trusted broker ratings Coverage across Asia-Pacific, Europe, and Americas R
Multi Timeframe Analysis
Teerathad Booranawisedkul
FREE 7-DAY TRIAL After your trial ends, continue using this essential trading tool for only $30 one-time payment. Multi-Timeframe Dashboard Indicator A comprehensive multi-timeframe analysis tool that displays market conditions across 9 timeframes simultaneously on a single dashboard panel. Timeframes Analyzed M1, M5, M15, M30, H1, H4, D1, W1, MN Toggle visibility for each timeframe individually Analysis Metrics Trend - EMA crossover status (Strong/Weak/Bearish/Neutral) Power - ADX strength p
All in One Multi Indicator
Teerathad Booranawisedkul
Overview Comprehensive technical analysis indicator combining 20+ essential trading tools in a single chart display. Moving Averages EMA (Exponential Moving Average): 9, 21, 50, 200 periods SMA (Simple Moving Average): configurable period Customizable colors and line widths Price position indicators (above/below) Oscillators & Momentum RSI (Relative Strength Index): adjustable overbought/oversold levels MACD (Moving Average Convergence Divergence): customizable fast/slow/signal periods Stochasti
GoldScalpGS
Teerathad Booranawisedkul
GoldScalp is a powerful, hybrid Expert Advisor designed specifically for trading Gold (XAUUSD). It utilizes a sophisticated combination of Scalping, Swing Trading, and Grid-News strategies. Powered by a custom-built ZigZag indicator, GoldScalp is engineered to find the most accurate entry points while keeping your risk strictly managed. Overview Hybrid Approach: Seamlessly integrates Scalp, Swing, and Grid-News strategies. Custom ZigZag Logic: The EA tracks and connects extreme high/low points o
BTCScalp
Teerathad Booranawisedkul
BTCScalp is a fully automated, professional-grade Expert Advisor specifically engineered to conquer the high volatility of the Bitcoin (BTC) market. Breakout Strategy combined with Dynamic ATR Volatility calculations , BTCScalp catches explosive crypto price movements while strictly managing risk. Core Strategy BTCScalp operates on the 15M Timeframe . It scans the market to identify crucial local Support and Resistance levels based on recent price action. Before a breakout occurs, the EA strate
Calender Overall
Teerathad Booranawisedkul
Monthly Calendar Dashboard eliminates the guesswork entirely. It places a live, color-coded calendar directly on your chart — showing exactly what happened on every single trading day: how much you made, how much you lost, how deep your drawdown went, and whether your edge is actually working. No spreadsheets. No exporting data. No mental math. Just open your chart and see your month. What You See at a Glance Every day on the calendar shows you five critical numbers the moment you look at it: Da
Filtrele:
Değerlendirme yok
Değerlendirmeye yanıt