Volume Profile For MT5
- Göstergeler
- Sürüm: 2.1
- Güncellendi: 1 Mayıs 2026
- Etkinleştirmeler: 15

Volume Profile VPVR For MT5
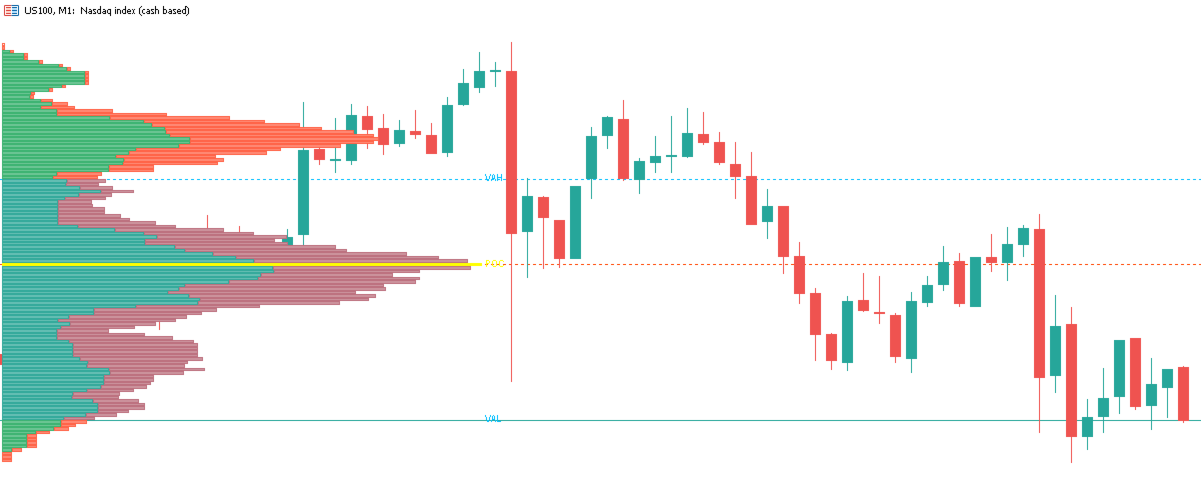
Volume Profile VPVR is a powerful, high-performance MetaTrader 5 indicator designed to replicate the advanced Volume Profile (Visible Range) directly on your chart. It provides deep insight into market structure by visualizing where trading activity is concentrated, helping traders identify key price levels with precision.
This indicator dynamically analyzes volume distribution across price levels and renders a detailed histogram directly on the chart, allowing you to understand market acceptance, rejection zones, and liquidity clusters at a glance.
🔍 Key Features
• Visible Range & Fixed Range Modes
Switch seamlessly between VPVR (auto-adjusting to visible candles) or define your own custom range for precise analysis.
• Point of Control (POC)
Automatically detects and highlights the price level with the highest traded volume — the most important level of market interest.
• Value Area (VAH / VAL)
Displays the Value Area High and Low based on a configurable percentage (default 70%), helping identify fair value zones.
• Bullish vs Bearish Volume Split
Each volume bar is split into buy (bullish) and sell (bearish) pressure, giving you deeper insight into order flow.
• Real-Time Updates (Tick-Based)
Profile updates continuously with incoming ticks for live market tracking without delay.
• Extending Key Levels
POC, VAH, and VAL lines can be extended across the chart, acting as dynamic support/resistance zones.
• Adjustable Profile Placement
Display the profile on the left or right side of the chart depending on your trading style.
• Volume Scaling (Enhanced Visibility)
Stretch or compress the histogram using a volume scale multiplier for better visual clarity.
• Integrated Volume Labels
Optionally display buy/sell volume values directly inside histogram bars with smart formatting (K/M units).
• Developing POC (Optional)
Track how the POC evolves in real time to understand shifting market sentiment.
• Fully Customizable Design
Control colors, transparency, fonts, line styles, and layout to match your trading setup.
⚙️ How It Works
The indicator divides the selected price range into multiple rows (bins) and distributes volume based on price overlap per candle. It then:
-
Aggregates total volume per price level
-
Identifies the highest volume node (POC)
-
Expands outward to calculate the Value Area (VAH/VAL)
-
Displays a histogram showing volume concentration at each price
📊 Why Use This Indicator?
-
Identify high liquidity zones where institutions are active
-
Spot strong support and resistance levels
-
Understand market balance vs imbalance
-
Improve entries, exits, and stop placement
-
Combine with Smart Money Concepts or price action strategies
🚀 Ideal For
-
Day traders
-
Scalpers
-
Swing traders
-
Smart Money / Order Flow traders
This indicator brings institutional-grade volume analysis to MetaTrader 5 with a smooth, optimized, and visually clean implementation—making it an essential tool for serious traders.

Kullanıcı değerlendirmeye herhangi bir yorum bırakmadı