FX Five Indicator Average Dashboard
- Göstergeler
- Sürüm: 1.0
- Etkinleştirmeler: 5

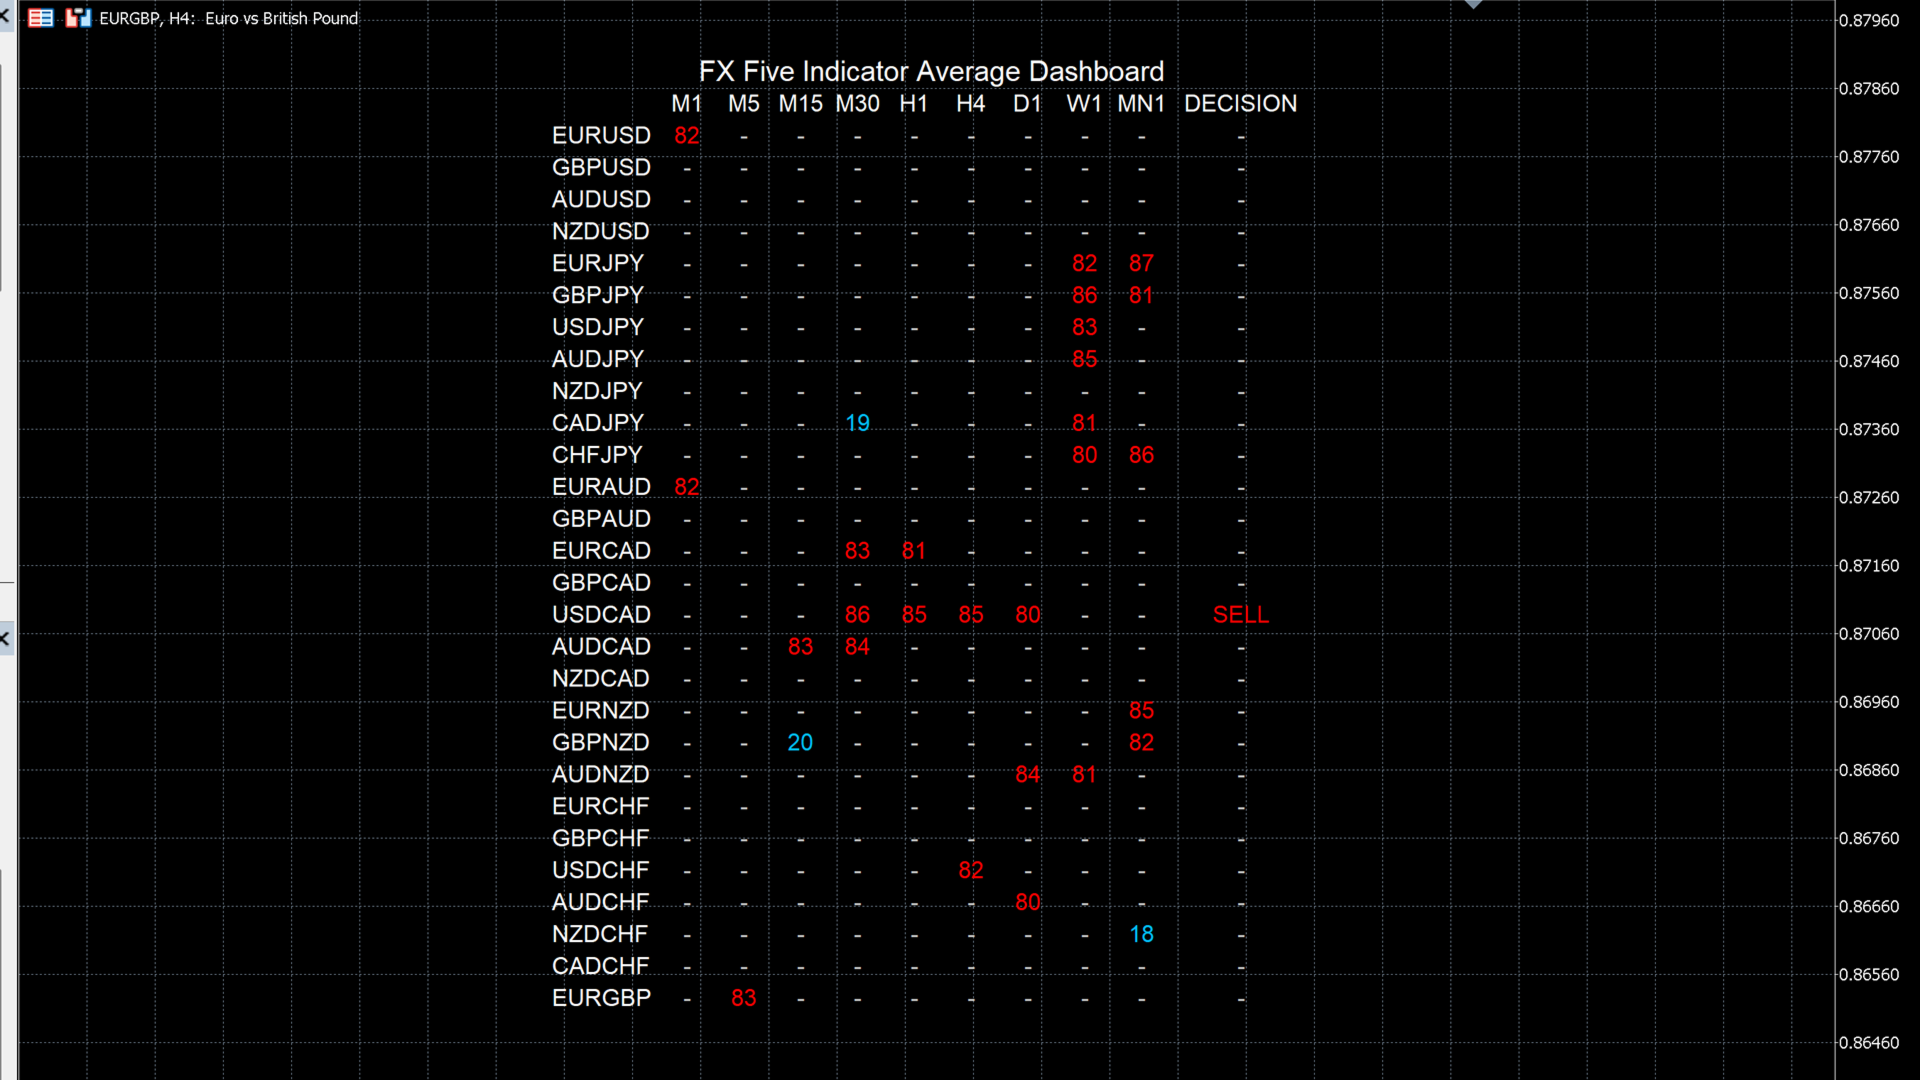
Multi-timeframe dashboard showing the average value of five core momentum indicators across multiple currency pairs to quickly identify overbought and oversold market conditions.
🔹 What the Indicator Does
-
Calculates a single average value of five indicators (0–100)
-
Uses five well-known momentum indicators
-
Displays values across multiple timeframes and symbols
-
Highlights oversold and overbought zones
-
Provides a BUY / SELL decision column based on consecutive timeframe alignment
🔹 Indicators Used (AverageFive)
-
Relative Strength Index (RSI)
-
Stochastic Oscillator
-
Money Flow Index (MFI)
-
Williams’ Percent Range (WPR), normalized to 0–100
-
DeMarker, normalized to 0–100
All five indicators are averaged into one composite value.
🔹 Color Logic
-
Blue (Oversold / BUY)
-
AverageFive value at or below lower threshold
-
-
Red (Overbought / SELL)
-
AverageFive value at or above upper threshold
-
-
Neutral (“–”)
-
Value inside normal range
-
🔹 Decision Column Logic
-
BUY
-
At least N consecutive timeframes below the lower threshold
-
-
SELL
-
At least N consecutive timeframes above the upper threshold
-
-
Neutral
-
No sufficient consecutive alignment
-
🔹 Supported Timeframes
-
M1
-
M5
-
M15
-
M30
-
H1
-
H4
-
D1
-
W1
-
MN1
🔹 Key Features
-
Multi-symbol dashboard view
-
Multi-timeframe analysis
-
Single composite oscillator (0–100)
-
Clean, grid-based visual layout
-
Fast scanning of market extremes
-
Optimized with cached indicator handles
-
Lightweight and non-intrusive
-
No chart clutter
🔹 Input Parameters Explained
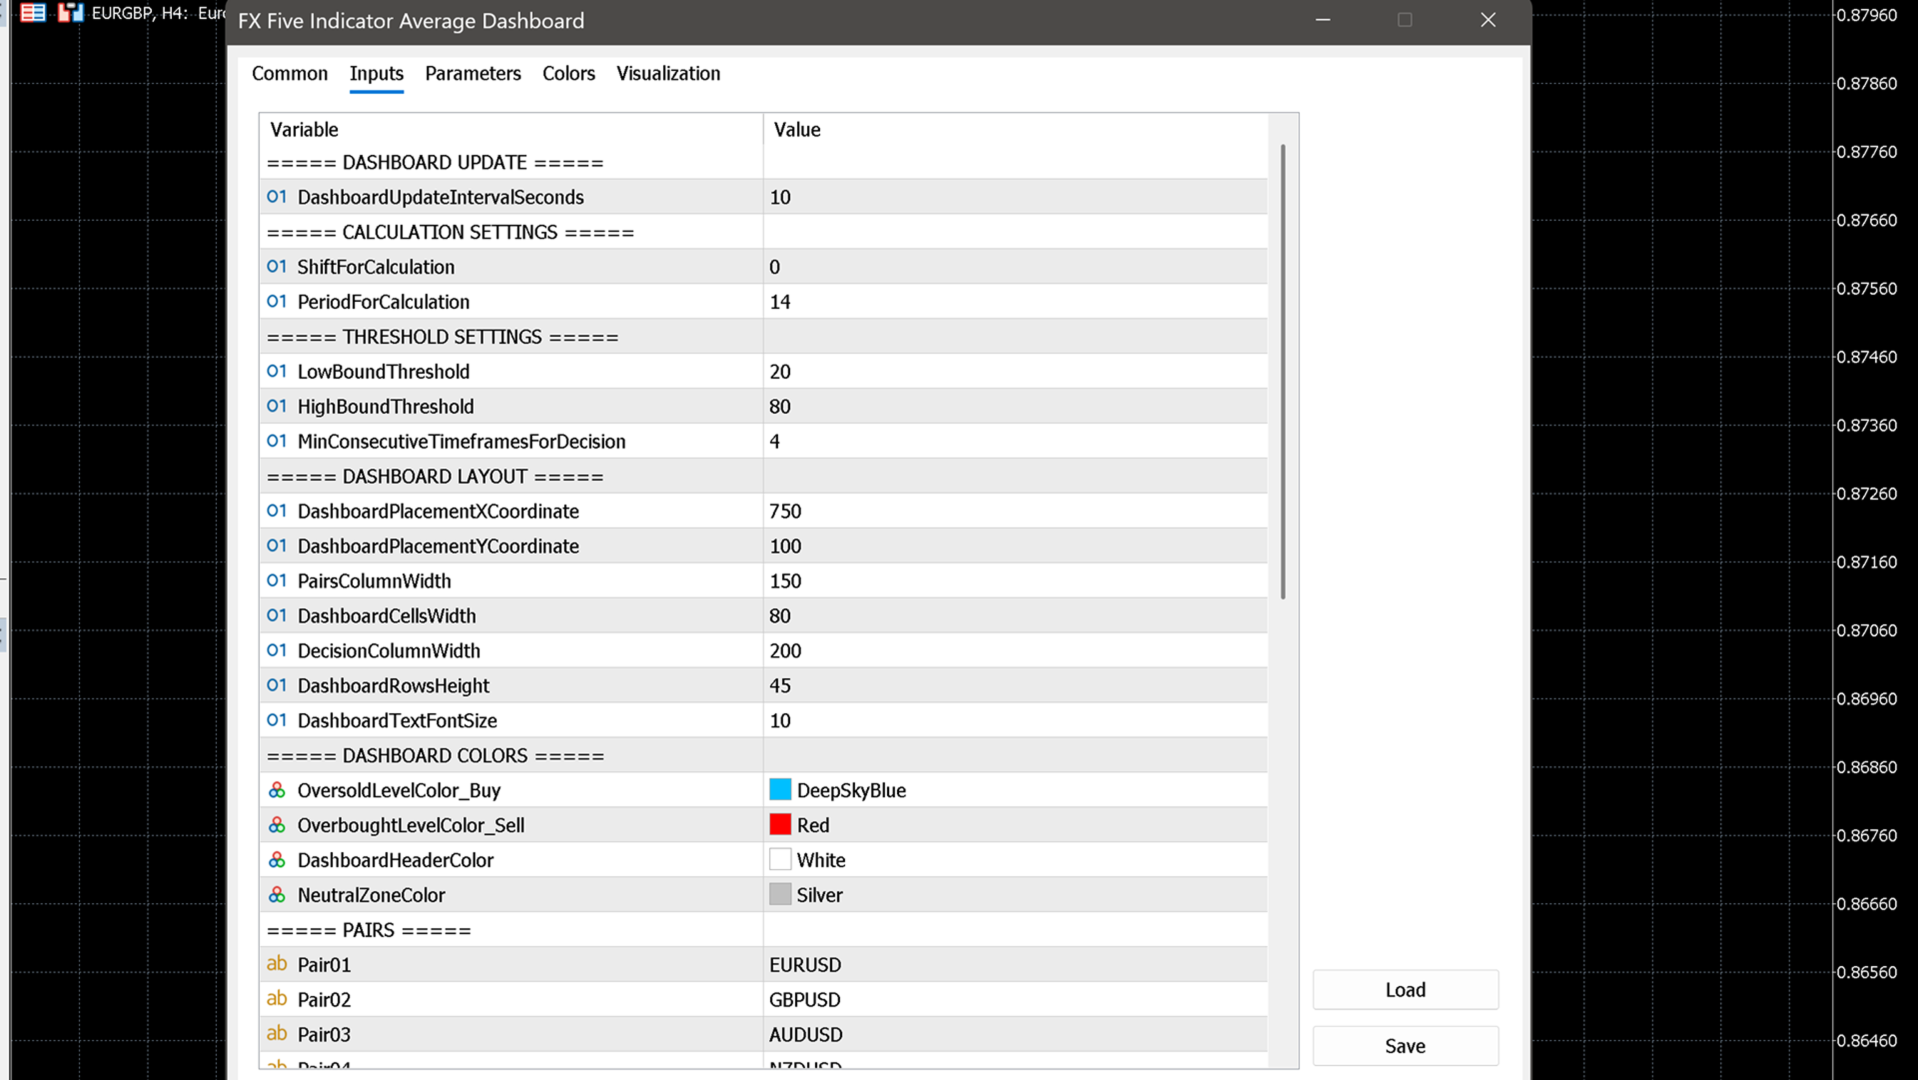
Dashboard Update
-
Dashboard Update Interval
-
Time between dashboard refreshes (seconds)
-
Calculation Settings
-
Shift for Calculation
-
0 = forming candle
-
1 = last closed candle
-
-
Period for Calculation
-
Shared period for all five indicators
-
Threshold Settings
-
Low Bound Threshold
-
Oversold level
-
-
High Bound Threshold
-
Overbought level
-
-
Min Consecutive Timeframes for Decision
-
Number of aligned timeframes required for BUY or SELL decision
-
Dashboard Layout
-
Dashboard Placement X Coordinate
-
Dashboard Placement Y Coordinate
-
Pairs Column Width
-
Dashboard Cells Width
-
Decision Column Width
-
Dashboard Rows Height
-
Dashboard Text Font Size
Dashboard Colors
-
Oversold Level Color (Buy)
-
Overbought Level Color (Sell)
-
Dashboard Header Color
-
Neutral Zone Color
Pairs
-
Up to 28 symbols
-
Each pair configurable individually
-
Empty fields automatically ignored
🔹 Recommended Usage
-
Market scanning for extremes
-
Multi-timeframe confirmation
-
Trade filtering tool
-
Mean-reversion strategies
-
Momentum exhaustion detection
🔹 Important Notes
-
Indicator does not open trades
-
Indicator does not repaint historical values
-
Best used together with price action or trend context
-
Indicator can be attached to any chart and any timeframe