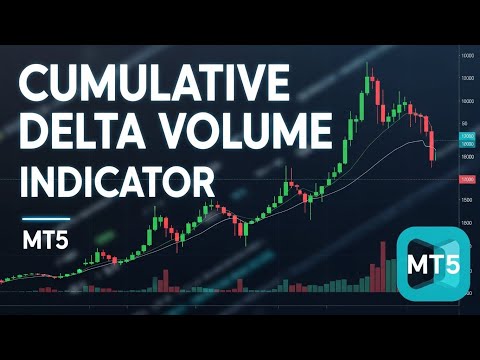
Cumulative Delta Volume Indicator for MT5
- Göstergeler
- Sürüm: 1.60
- Güncellendi: 30 Ağustos 2026
- Etkinleştirmeler: 5
Cumulative Delta Volume Indicator for MT5 (CDV Indicator for MT5)
Volume-Based Market Sentiment, Trend Strength and Divergence Indicator
The Cumulative Delta Volume (CDV) indicator analyzes the balance between buying and selling volume to reveal the underlying market sentiment. By accumulating the difference between upward and downward volume, it shows whether buyers or sellers are in control and helps traders confirm the strength or weakness of a trend.
This tool provides both candle-based visualization and a line-based cumulative delta chart, allowing traders to view shifts in order flow with clarity. It can optionally use Heikin Ashi candles for smoother interpretation and includes SMA and EMA overlays for trend confirmation. The indicator also detects and draws divergences between price and CDV directly on the chart, highlighting absorption and exhaustion of buyers or sellers before a potential reversal.
How It Works
1. Volume Delta Calculation
- For each bar, the indicator estimates how much of the volume belongs to buying or selling activity.
- The delta is the difference between bullish and bearish volume components.

2. Cumulative Summation
- These deltas are accumulated over time to display a continuous measure of buying or selling pressure.
- A rising CDV line indicates dominant buying; a falling CDV line shows selling dominance.
3. Visualization Options
- Choose between Candle or Line display modes.

- Enable Heikin Ashi smoothing for reduced noise and cleaner signals.
- Add moving averages (SMA/EMA) for trend direction and dynamic support/resistance context.
4. Divergence Detection
- The indicator compares confirmed swing highs and lows on price against the same swing points on CDV.
- Exhaustion of Buyers: price makes a higher high while CDV makes a lower high, signaling weakening buying momentum and a possible bearish reversal.
- Exhaustion of Sellers: price makes a lower low while CDV makes a higher low, signaling weakening selling momentum and a possible bullish reversal.
- Absorption by Sellers: CDV makes a higher high but price fails to follow, meaning sellers are replenishing orders to prevent the price from rising, which can trigger a sudden reversal.
- Absorption by Buyers: CDV makes a lower low but price fails to follow, meaning buyers are replenishing orders to prevent the price from falling, which can trigger a sudden reversal.
- Each divergence is drawn as a matching pair of trend lines, one on the price chart and one on the CDV panel, so the relationship between price and order flow is visible at a glance.
Key Features
- Dual display modes: Candle or Line view
- Optional Heikin Ashi smoothing for trend clarity
- Configurable SMA and EMA overlays
- Fully adjustable candle and line color schemes
- Automatic divergence detection with four distinct signal types
- Divergence lines drawn on both the price chart and the indicator panel
- Optional alerts and push notifications on new divergence signals
- Works across all markets and timeframes
Usage Guidelines
- A rising CDV suggests strong buying interest and potential continuation in an uptrend.
- A falling CDV indicates selling dominance and possible trend reversal or continuation downward.
- Use CDV together with price action and volume profile analysis to confirm institutional activity or divergence signals.
- Treat divergence signals as an early warning of a potential reversal rather than a standalone entry trigger, and confirm them with price structure or other tools before acting.
Inputs Overview
General Settings
- Look Back Bars: number of recent bars used to calculate the CDV
- Style: choose between Candle or Line mode
- Heikin Ashi Candles: optional smoothing of CDV candles
- SMA/EMA Settings: adjustable periods for overlay trend indicators
- Min Candle Body/High-Low Ratio for Signal: filters out low-quality buy/sell signals
Divergence Settings
- Show Divergence Lines: enables or disables divergence detection and drawing
- Pivot Left Bars / Pivot Right Bars: controls how many bars confirm a swing high or low, adjusting sensitivity
- Max Divergence Lines to Keep: limits how many divergence lines remain on the chart, oldest lines are removed first
- Show Divergence Labels: toggles text labels next to each divergence line
- Color Settings: individual colors for Exhaustion of Buyers, Exhaustion of Sellers, Absorption by Sellers and Absorption by Buyers
- Alert on New Divergence: sends an alert and/or push notification when a new divergence is confirmed
Tester Settings
- Back Test Indicator: enables a built-in on-chart panel that simulates trades from the buy/sell signals
- Test Start Time, TP and SL in points: parameters used by the built-in tester
Alerts
- Use Alerts: enables popup alerts on buy/sell signals
- Use Push Notifications: sends signals to the MetaTrader mobile app
Summary
The Cumulative Delta Volume (CDV) indicator provides a comprehensive view of market volume dynamics by tracking the cumulative difference between buy and sell pressure. It helps traders identify shifts in market control, validate trends, and detect early divergences between price and volume behavior, giving an additional layer of confirmation before a potential reversal takes place.


Excellent job! This is the very first CDV that I can use not only for manual trading, but also for algo. And as a bonus, Mohammad is a very responsive creator who is willing to implement your idea when it makes sense. And at lightning speed. I give 6 stars !