Core Drift Index
- Göstergeler
- Sürüm: 1.1
- Etkinleştirmeler: 5

Core Drift Index: Your Reliable Guide in the World of Trading
Core Drift Index is an innovative trend indicator designed for precise detection of market directions and reversal points. This powerful tool enables traders to optimize their investments, minimize risk, and maximize profit.
🔍 Key Features and Benefits
✅ Intuitive Trend Detection
Core Drift Index clearly shows trend direction, helping traders make timely entry and exit decisions.
✅ High Probability of Success
With its high accuracy in trend identification, the indicator significantly increases the chances of profitable trades.
✅ Versatility
Works across all currency pairs and timeframes, making it an essential tool for any trader.
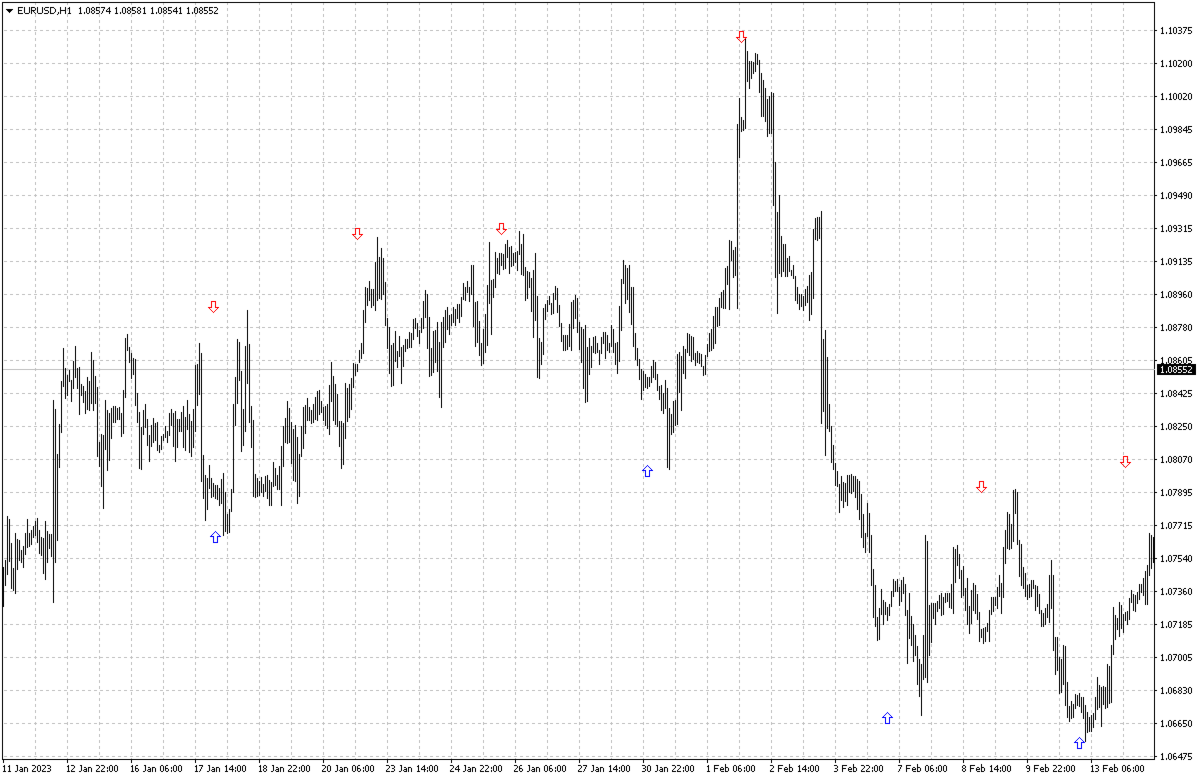
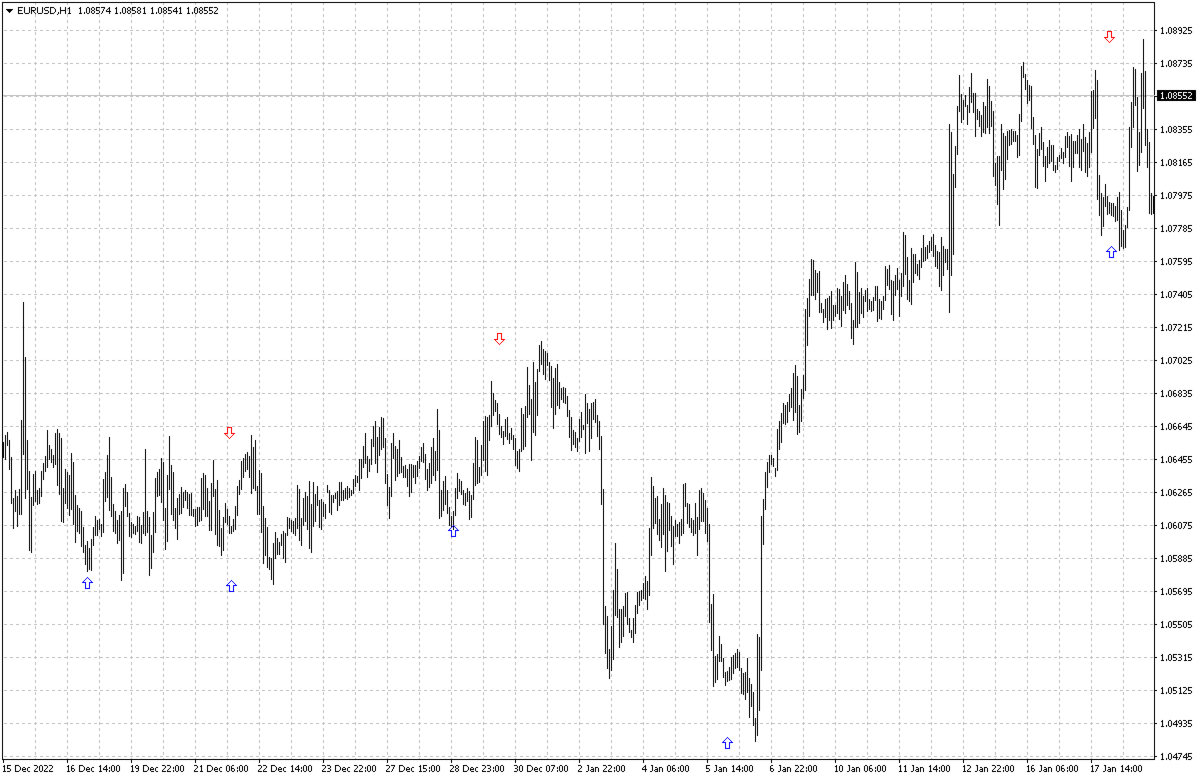
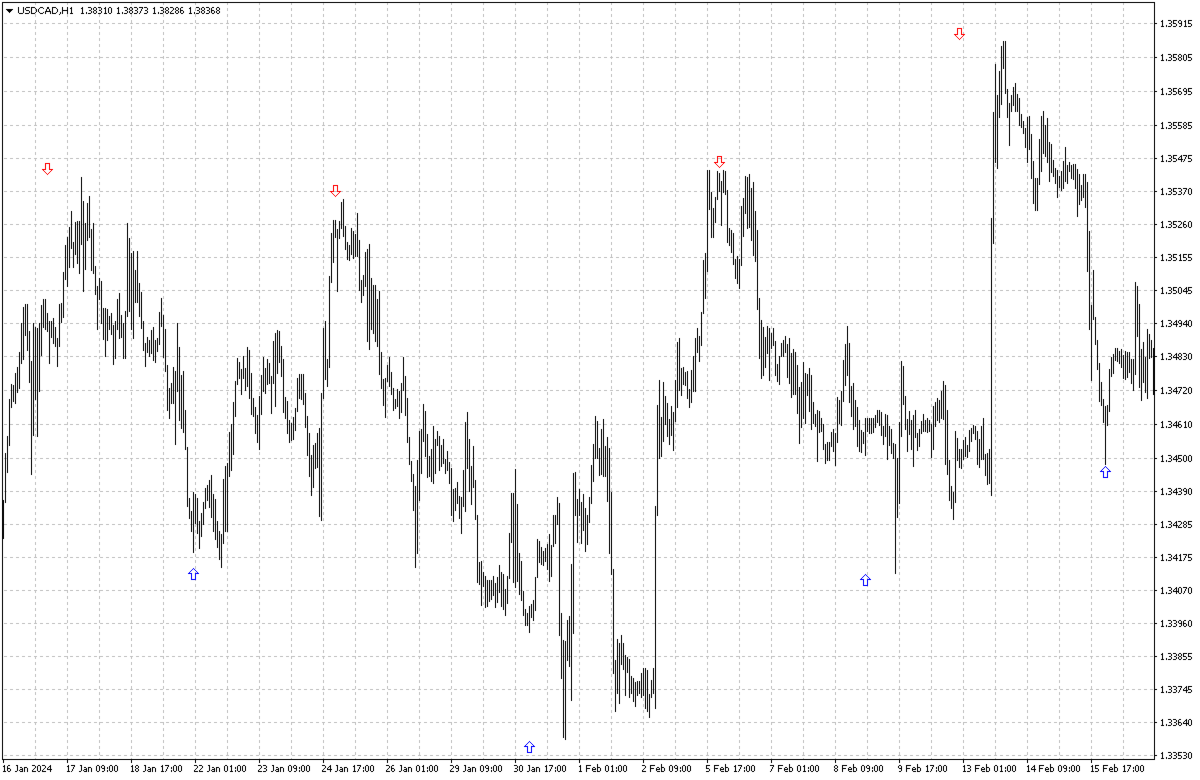
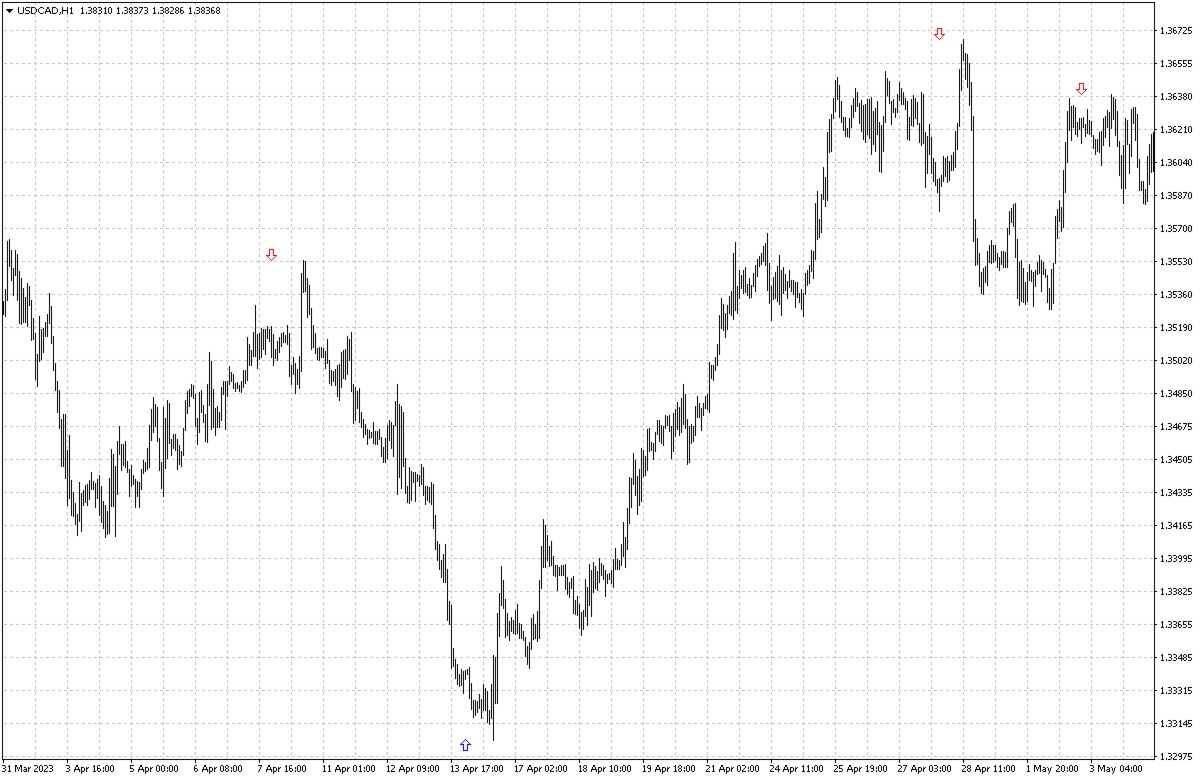
🎯 Visual Signals & Ease of Use
-
Arrow-Based Signals
Core Drift Index uses color-coded arrows to indicate ideal entry and exit moments, simplifying the trading process. -
Minimal Settings
With just one adjustable parameter (from 1 to 3), traders can quickly adapt the indicator to any strategy or market condition.
⚖️ Optimal Risk-to-Reward Ratio
-
Profit Boost
Take-profits significantly outweigh stop-losses, allowing traders to maximize gains on each successful trade. -
Risk Control
Clear and precise signals help minimize losses and avoid emotional decision-making.
⭐ Why Choose Core Drift Index?
-
Simplicity & Effectiveness
Easy-to-read signals make it perfect for both beginners and experienced traders. -
High Adaptability
Functions on any asset and timeframe — from M1 to monthly charts. -
Minimal Configuration
One parameter = full control. No complex setups, just results.
📈 How to Use Core Drift Index for Maximum Profit?
-
Adjust the Parameter Setting
Set the value between 1 and 3 depending on your strategy and market conditions. -
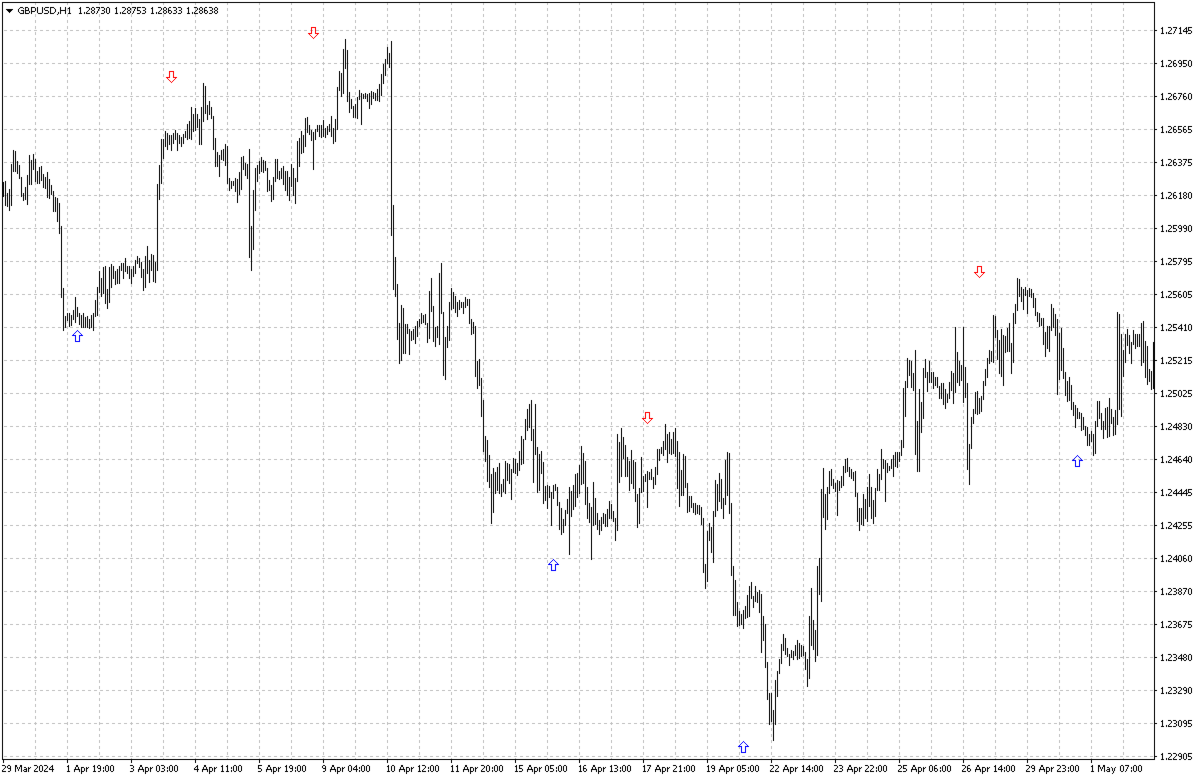
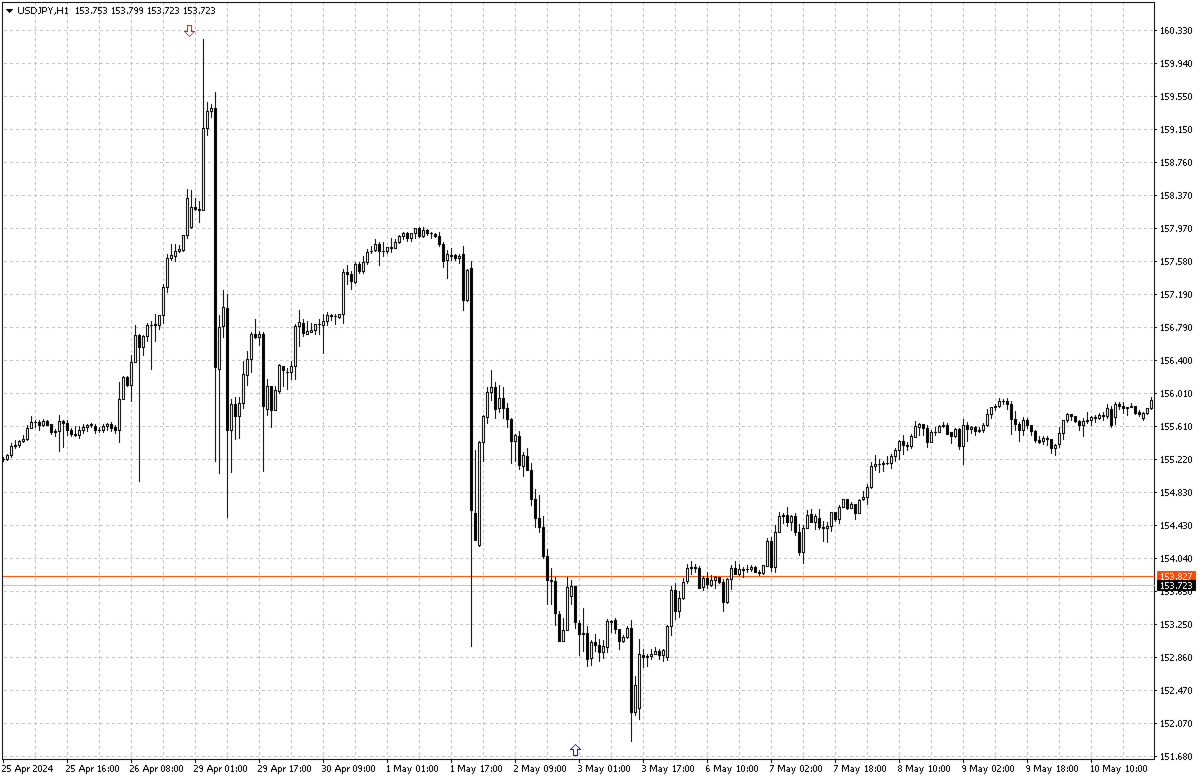
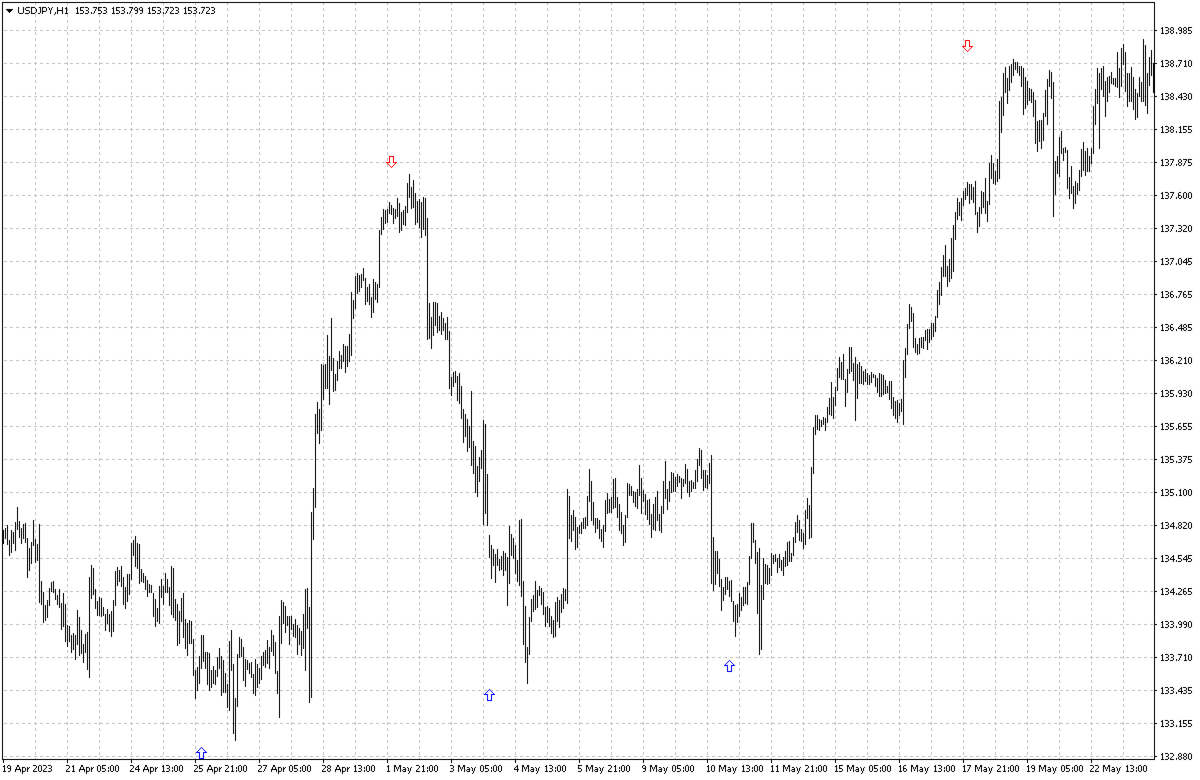
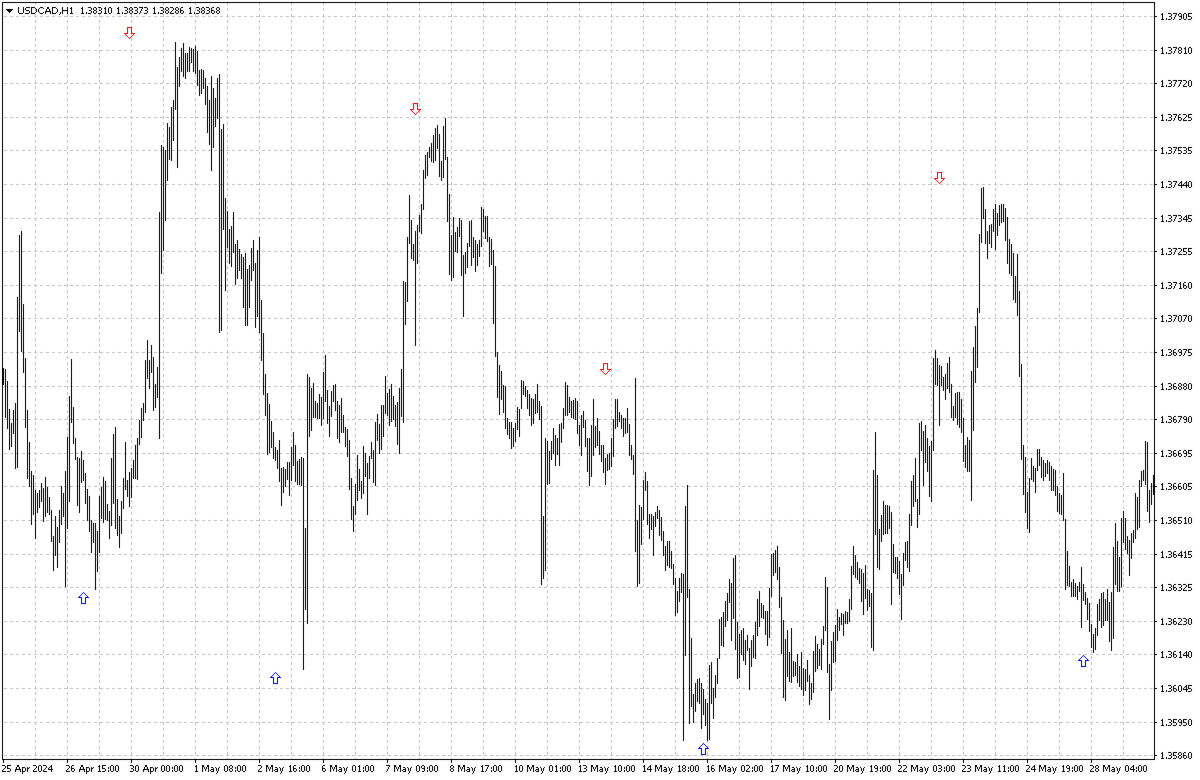
Follow the Arrows
Green arrow = Buy Signal
Red arrow = Sell Signal -
Set TP & SL Wisely
Use favorable take-profit to stop-loss ratios for optimal performance.
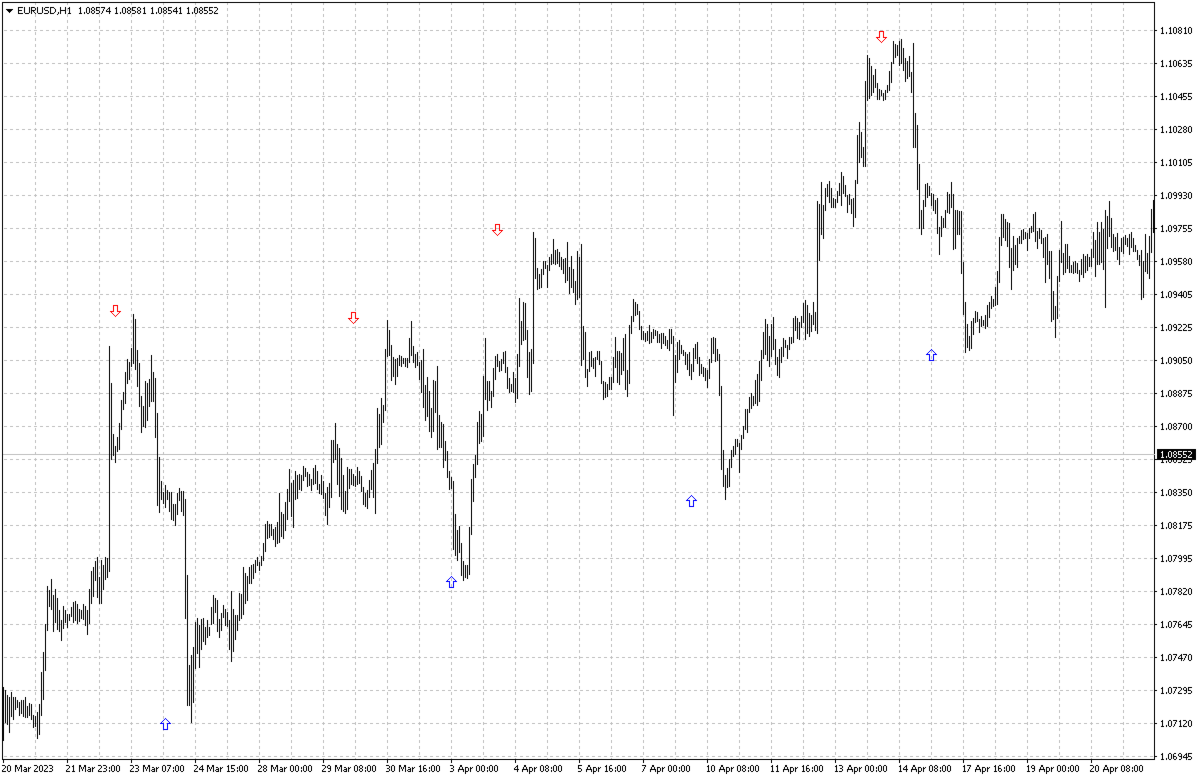
🧪 Usage Examples
EUR/USD on H1
-
Setting: 2
-
Signal: Green arrow (Buy)
-
Take-Profit: +150 pips
-
Stop-Loss: –50 pips
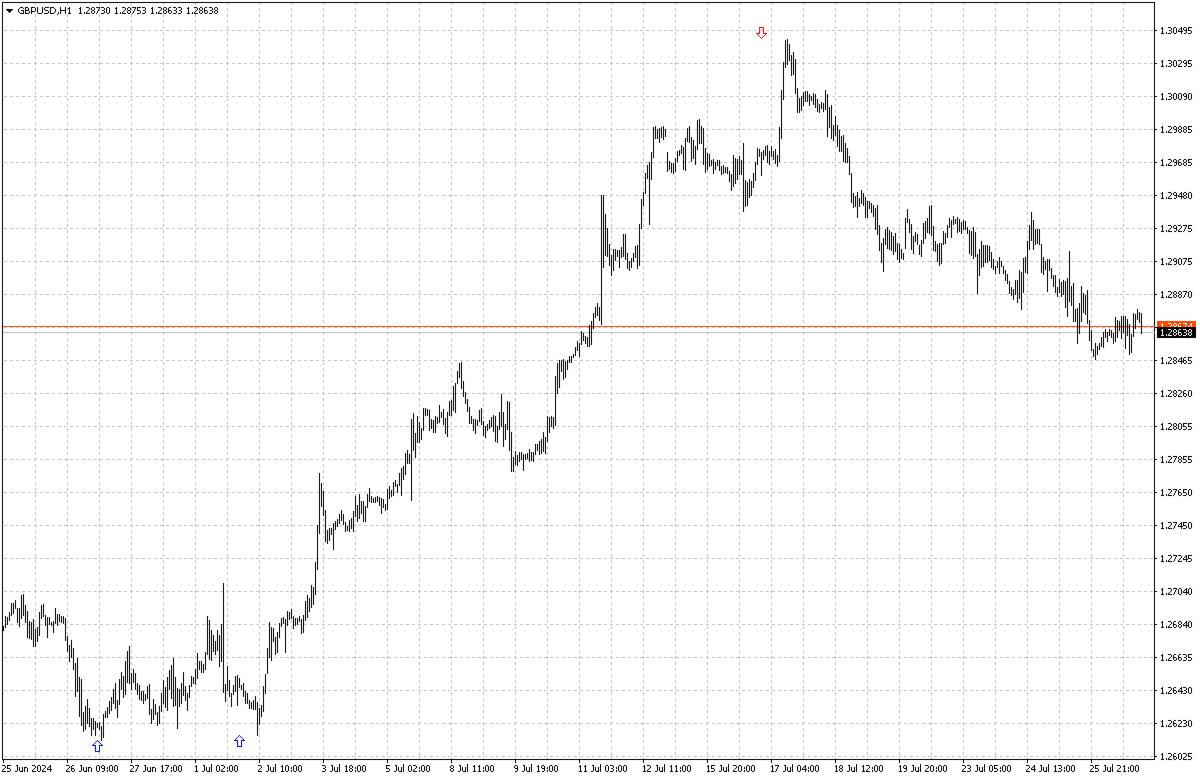
GBP/JPY on M30
-
Setting: 1
-
Signal: Red arrow (Sell)
-
Take-Profit: +100 pips
-
Stop-Loss: –30 pips
⚡ Extra Advantages
-
Real-Time Analysis
React instantly to market changes. -
Accuracy & Reliability
Eliminates human error through smart algorithms. -
Emotion-Free Trading
Stay consistent and focused with rule-based signals.
🏁 Conclusion
Core Drift Index is your trusted trading companion. It delivers accurate signals to identify trends and reversals, helping you reduce risk and boost profits. Regardless of your experience level, Core Drift Index can become a powerful asset in your trading toolkit.
🚀 Start using Core Drift Index today — and achieve success in trading!