Tops and Bottoms Time of Day Report

Indicator is converted from another programming language code by programmer "sbtnc". MQL version is simplified to be more useful by less settings complexity. 

There is some clues from programmer about indicator:

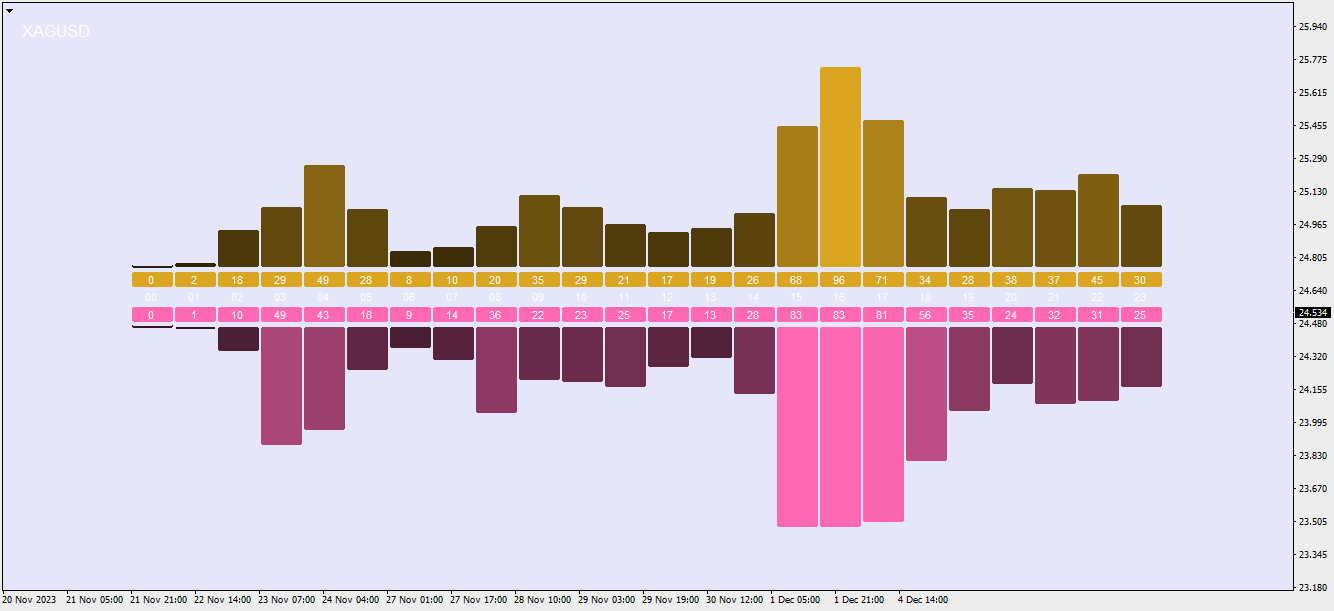
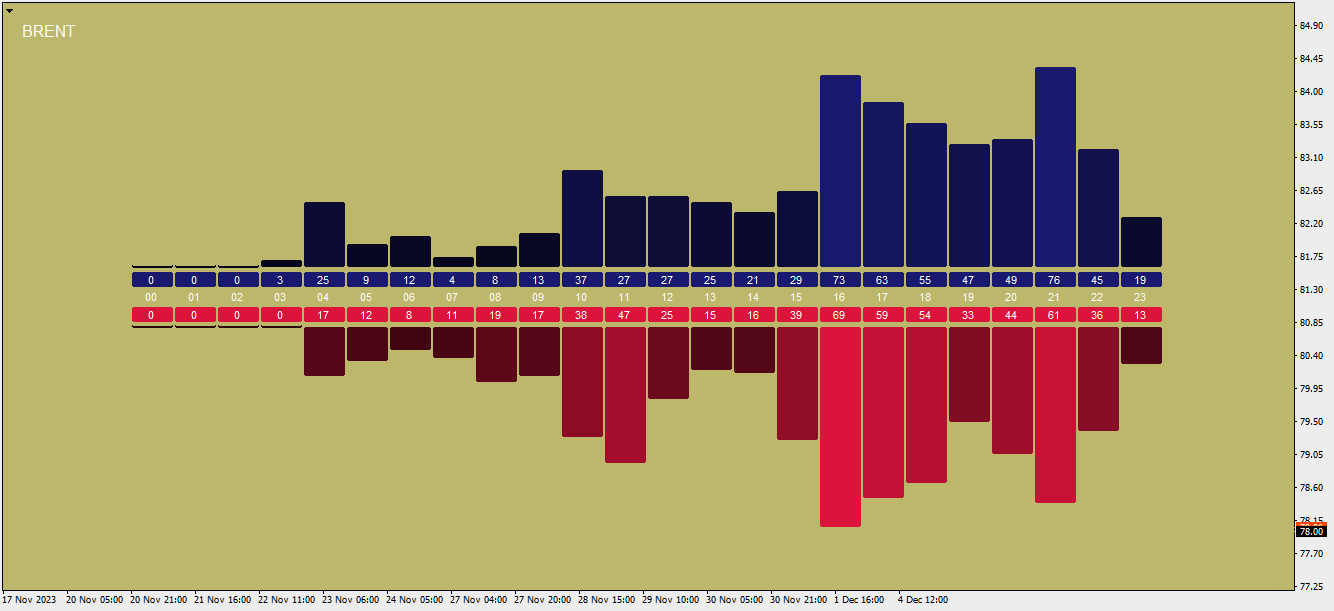
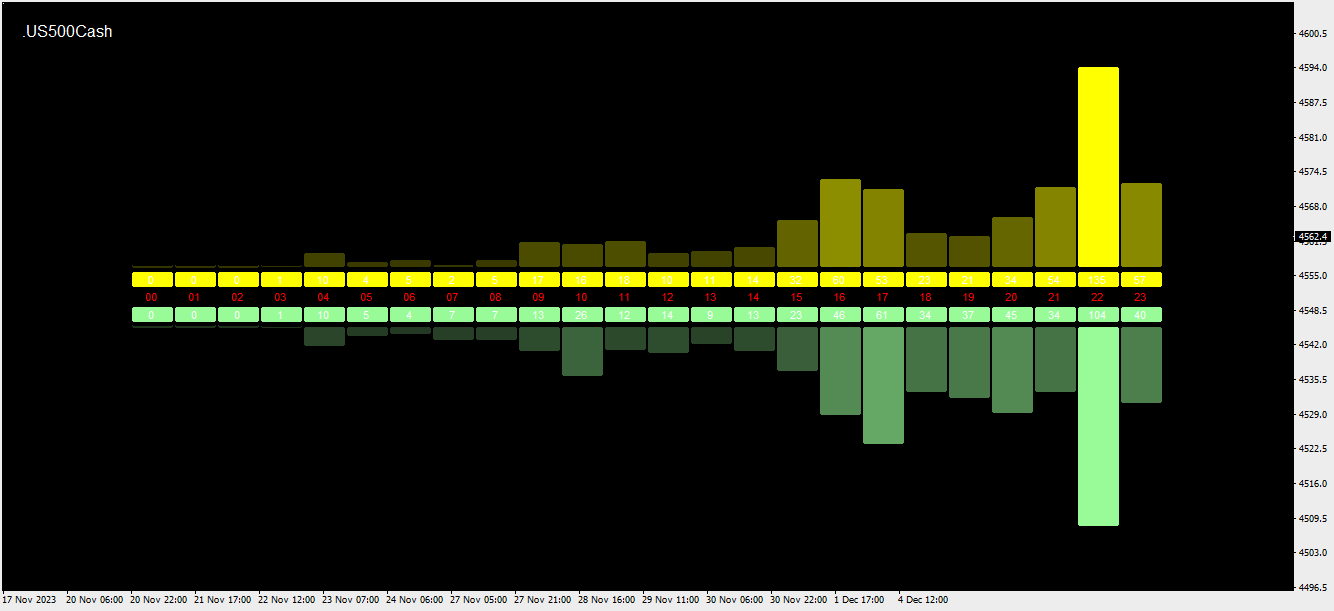
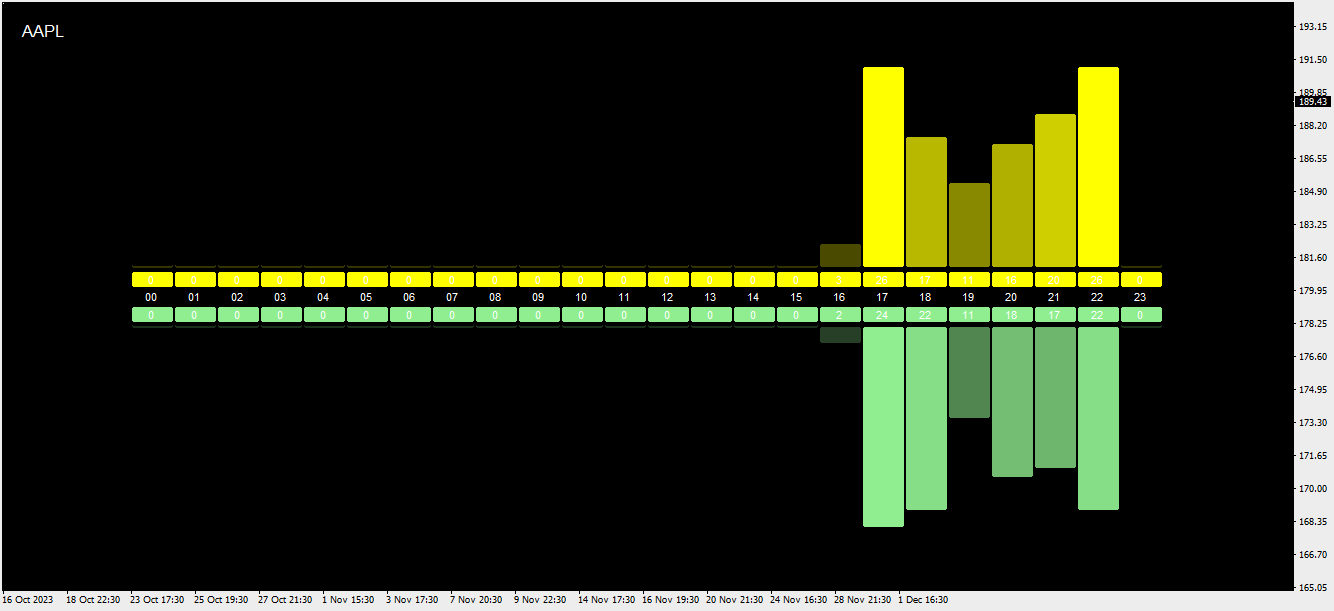
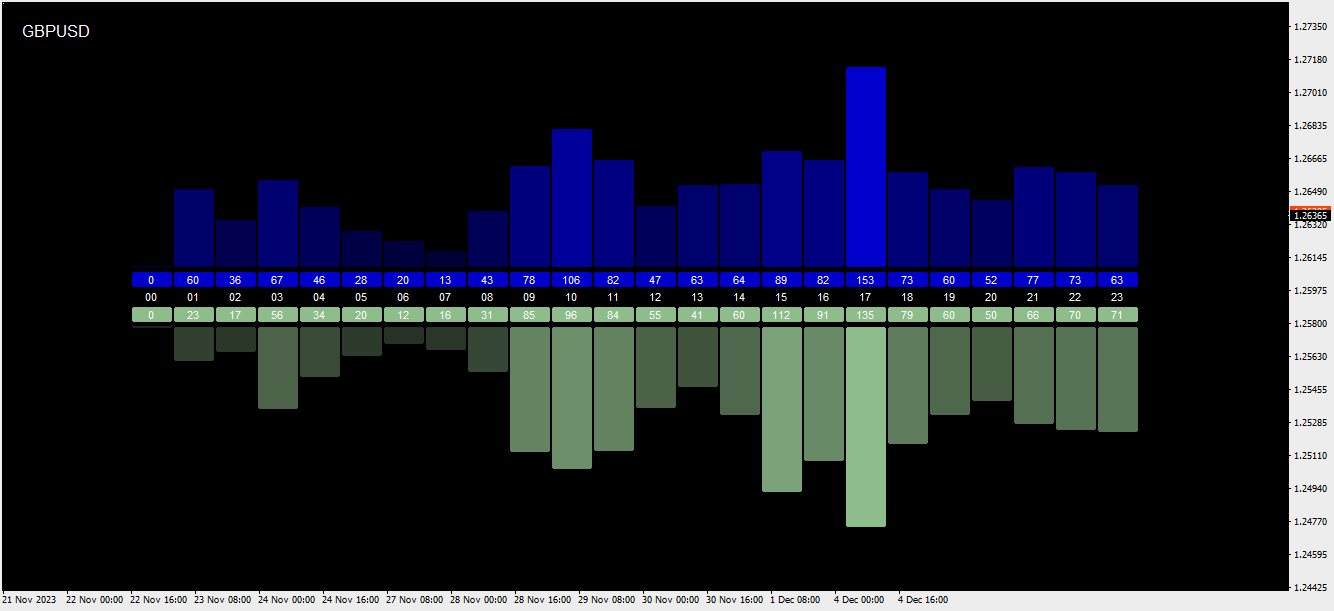
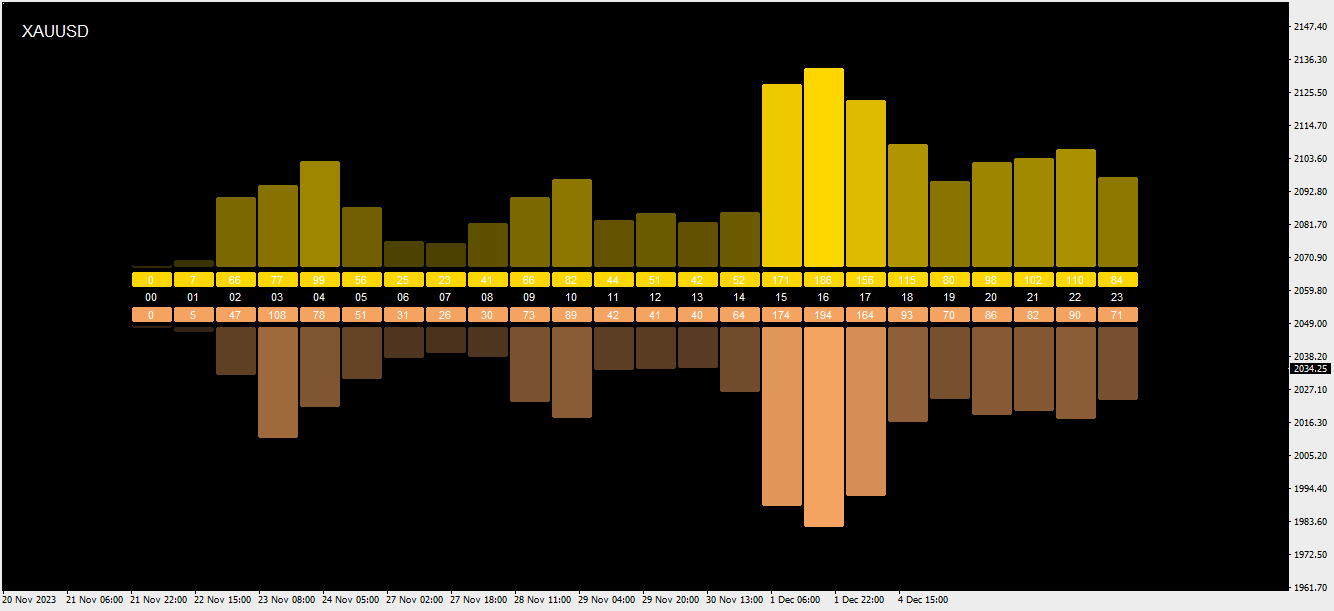
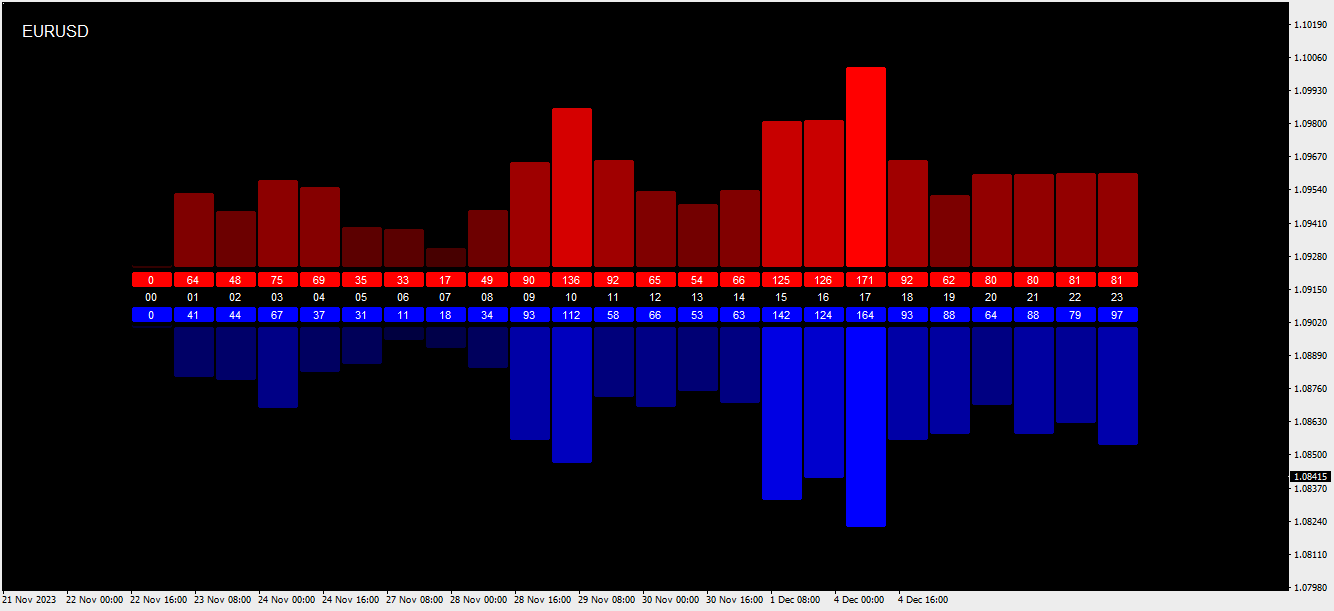
The indicator tracks and reports the percentage of occurrence of daily tops and bottoms by the time of the day. 

At certain times during the trading day, the market reverses and marks the high or low of the day. Tops and bottoms are vital when entering a trade, as they will decide if you are catching the train or being straight offside. They are equally crucial when exiting a position, as they will determine if you are closing at the optimal price or seeing your unrealized profits vanish.

This indicator is before all for educational purposes. It aims to make the knowledge available to all traders, facilitate understanding of the various markets, and ultimately get to know your trading pairs by heart.


Önerilen ürünler
Bigger chart labels would allow the user to be entirely aware of which chart he/she is on. Each chart window is unique, containing different patterns and economic motives so acknowledging the chart window would be absolutely essential! There are well known Economic Time Zones included in clear view, by choice!    Simple does it! Use your computing mouse scroller, clicking with the right finger on the label, in order to customize the label properties. From there, choose your preferred color, f
FREE
PointsVsBars
Stanislav Korotky
This indicator provides a statistical analysis of price changes (in points) versus time delta (in bars). It calculates a matrix of full statistics about price changes during different time periods, and displays either distribution of returns in points for requested bar delta, or distribution of time deltas in bars for requested return. Please, note, that the indicator values are always a number of times corresponding price change vs bar delta occurred in history. Parameters: HistoryDepth - numbe
FREE
Price Ladder
Kourosh Hossein Davallou
This indicator is based on the Channel . Input Parameters channel_One- show trend line One on or off. timeFrame_One - time Frame of channel One . ColorChannel_One - color of  trend line One. channel_Two- show trend line Two on or off. timeFrame_Two - time Frame of channel Two . ColorChannel_Two - color of  trend line Two. channel_Three- show trend line Three on or off. timeFrame_Three - time Frame of channel Three . ColorChannel_Three - color of  trend line three. channel_Four- show trend line F
FREE
MACD divergence indicator finds divergences between price chart and MACD indicator and informs you with alerts (popup, mobile notification or email). Its main use is to find trend reversals in the chart. Always use the divergence indicators with other technical assets like support resistance zones, candlestick patterns and price action to have a higher possibility to find trend reversals. Three confirmation type for MACD divergences: MACD line cross zero level Price returns to previous H/L Creat
FREE
TrendBite MT4
Burak Baltaci
5 (1)
TrendBite v1.5 - Profesyonel Trend Takip İndikatörü Geliştirici: 8aLt4 Versiyon: 1.5 Platform: MetaTrader 4  Genel Bakış TrendBite v1.5, piyasadaki trend değişimlerini tespit etmek ve yatırımcılara net alım-satım sinyalleri sunmak için tasarlanmış gelişmiş bir teknik analiz indikatörüdür. Bollinger Bantları algoritmasını temel alarak, trend dönüşlerini hassas bir şekilde yakalayan bu araç, hem yeni başlayanlar hem de deneyimli traderlar için idealdir. Temel Özellikler Trend Tespiti Otomatik Tr
FREE
The indicator draws two types of Bill Williams' fractals: Broken fractals   – the price has been at least once above or below these fractals. Unbroken fractals   – new fractals where the price has not yet moved above or below them. You can configure the color of the fractals, as well as the number of bars used for the indicator's display. фрактал Вильямса фрактал БВ фракталы Вильямса пробой фрактала пробитый фрактал Торговый хаос broken fractal unbroken fractal Williams fractal    Trading Haos
FREE
Renko Chart with Moving Average. Classic Renko charts idea. It is protted on main chart and Moving Average can be applied. Prices for bars are used from a lower timeframe. Parameters: BarsBack - how many bars of lower timeframe to use. If value is zero than it will use all available bars. LTF - lower timeframe. BrickSize - Renko bar in points. BullishColor - color for bull candle. BearishColor - color for bear candle. HideLineChart - if this value is true the line chart when be hidden when sele
FREE
TradingView'de Inside Bar kullanıyorsanız, içerideki çubukları bulmak kolay ve rahatlatıcı olsa da, MQL piyasasında bulamıyorsanız, aramanız burada sona erer. Neden InsideBar Highlight? ABC kadar basit: Inside bars basitleştirildi. Aracımız mum gövdesine odaklanarak önemli olanı baş ağrısı olmadan görebilmenizi sağlar. Senin tarzın, senin tercihin: Renkli mi yoksa hepsi aynı mı? Siz karar verirsiniz. Yukarı veya aşağı hareketleri zahmetsizce belirleyin. Eldiven gibi uyum sağlar: Vurgulamamız sad
FREE
Great Indicator
Ruben David Santana Rodriguez
Les presento un indicador que funciona como estrategia por si solo , trabaja muy bien en periodos de 4 horas pero puedes aplicarlo a cualquier timeframe , las señales son muy faciles de interpretar , en momento en que la linea naranja pasa hacia arriba las media azul y roja , se entra en largos , la operativa se mantiene abierta hasta que la linea naranja cruce la media mas cercana ya sea la azul o la roja , si la operacion era long y la linea azul cruza hacia arriba la linea roja y la naranja c
RenkoMaSignals
Sergey Deev
1 (2)
The indicator displays Renko bars on the chart, plots two moving averages by them and generates buy/sell signals based on the conditions displayed in the screenshots and described below: the buy signal is formed if the fast moving average is above the slow moving average, from 4 to 10 consecutive bullish Renko bars are displayed, followed by no more than 2 bearish and one bullish Renko bars; the sell signal is formed if the fast moving average is below the slow moving average, from 4 to 10 conse
SX Trend Impulse Channels is a precisely designed trend-following system that represents trend development through distinct, volatility-adjusted steps. Instead of relying on traditional slope-based methods, it employs a structured step mechanism that only advances when price action conclusively confirms momentum via an ATR-based trigger. This indicator is well suited for traders who favor structured, stair-step trend progression over smooth, continuous curves. It delivers clear momentum-based
FREE
HZZ
Nikolay Likhovid
3.5 (2)
This is a very fast and not redrawing ZiGZag; it supports switching the segments at breakouts of price levels located at a specified distance (H parameter) from the current extremum. MinBars parameter sets the depth of history for drawing the indicator; 0 means drawing on the entire history. SaveData parameter allows writing the coordinates of extremums to a file (time in the datatime format and price). Some statistics calculated on the basis of the ZigZag is displayed in the form of comments.
FREE
Ichimoku wave
Bardia Mohammadi
For all those traders interested or currently trading Ichimoku, you will not want to miss this article. Although I am heading out in a few hours with my girlfriend to Harbin Hot Springs, I wanted to write a brief introduction to   Ichimoku Number Theory   as there has been a lot of questions (and confusion) about Ichimoku settings, time frames, etc. The basis of Ichimoku as known to most is the 5 lines; Tenkan Line Kijun Line Senkou Span A (part of the Kumo) Senkou Span B (other part of the Kum
FREE
MTF Fractals
Krisztian Kenedi
5 (4)
Multi timeframe fractal indicator which shows the higher timeframe's fractal point on lower timeframes. Parameters Fractal_Timeframe : You can set the higher timeframes for fractals. Maxbar : You can set the maximum number of candles for the calculations. Up_Fractal_Color, Up_Fractal_Symbol, Down_Fractal_Color, Down_Fractal_Symbol : Color and style settings of the fractal points. Extend_Line : Draws a horizontal line from the previous fractal point until a candle closes it over or a user-specif
FREE
RSI Color and Notification Setting Usages :: 1. Set value Oversold and Overbought 2. Set period RSI 3. Set Color 4. Notify to Alert, Email and Mobile. For Trading :: Forex and Binary option 1. When the color alarm occurs in the OVB area, do the preparation. To enter a Sell order 2. When the color alarm occurs in the OVS area, do the preparation. To enter a Buy order 3. When RSI is between OVB and OVS, consider another indicator to trade.
FREE
Necessary for traders: tools and indicators Waves automatically calculate indicators, channel trend trading Perfect trend-wave automatic calculation channel calculation , MT4 Perfect trend-wave automatic calculation channel calculation , MT5 Local Trading copying Easy And Fast Copy , MT4 Easy And Fast Copy , MT5 Local Trading copying For DEMO Easy And Fast Copy , MT4 DEMO Easy And Fast Copy , MT5 DEMO Strongly recommend trend indicators,   automatic calculation of wave standard   and   MT5 ver
FREE
Necessary for traders: tools and indicators Waves automatically calculate indicators, channel trend trading Perfect trend-wave automatic calculation channel calculation , MT4 Perfect trend-wave automatic calculation channel calculation , MT5 Local Trading copying Easy And Fast Copy , MT4 Easy And Fast Copy , MT5 Local Trading copying For DEMO Easy And Fast Copy , MT4 DEMO Easy And Fast Copy , MT5 DEMO The homeopathic indicator is also called the CCI indicator. The CCI indicator was proposed
FREE
PREVIOUS INDICATOR’S DATA MA CROSSOVER https://www.mql5.com/en/users/earobotkk/seller#products P/S: If you like this indicator, please rate it with 5 stars in the review section, this will increase its popularity so that other users will be benefited from using it. This indicator notifies and draws an arrow on the chart whenever    the MA line has crossed over its previous indicator’s data MA filtered by MA Trend.   It also displays total pips gained from all the entry set-ups. Setting ·   You c
FREE
The principle of constructing indicator lines .               Profit Trade  indicator is very effective for trading. Profit Trade  is a deep development of the well-known Donchian channel  indicator. The upper (BlueViolet color) Dup and the lower (IndianRed) Ddn lines of the indicator are constructed in the same way as in the Donchian channel , based on the highest (high of High) and lowest (low of Low) prices for the previous n1 = 20 periods. The middle line (Gold) Dm is constructed in the sam
FFx Ichimoku
Eric Venturi-Bloxs
4.5 (4)
The purpose of this new version of the MT4 standard indicator provided in your platform is to display in a sub-window multiple timeframes of the same indicator. See the example shown in the picture below. But the display isn’t like a simple MTF indicator. This is the real display of the indicator on its timeframe. Here's the options available in the FFx indicator: Select the timeframes to be displayed (M1 to Monthly) Define the width (number of bars) for each timeframe box Alert pop up/sound/ema
FREE
Candle Timer displays the time remaining until closing the current Bar, and a new bar forms. Feature simple to use . no lag or delay . customize position, color & font Size . server time not local time. Inputs - position * Beside Active Candle ( Default ) * Right Upper * Lift Upper * Right Bottom * Lift Bottom - font size *  14 (Default) - color *  SpringGreen (Default)
FREE
Toms Dashboard
Thomas Alexander Kevin Anderson
Dynamic Trading Dashboard for MT4 This powerful MT4 trading dashboard offers traders a comprehensive view of current and historical trading performance in an intuitive and visually organized format. With its precision-engineered design, the dashboard provides a seamless blend of real-time insights and historical analysis.  This trading dashboard is perfect for meticulous traders who seek a precise, all-encompassing tool to manage open and closed positions while gaining insights into past perform
FREE
Necessary for traders: tools and indicators Waves automatically calculate indicators, channel trend trading Perfect trend-wave automatic calculation channel calculation , MT4 Perfect trend-wave automatic calculation channel calculation , MT5 Local Trading copying Easy And Fast Copy , MT4 Easy And Fast Copy , MT5 Local Trading copying For DEMO Easy And Fast Copy , MT4 DEMO Easy And Fast Copy , MT5 DEMO Can set the cycle for other varieties of K line graph covered this window, fluctuations obser
FREE
VadineroLab MT4 Export Master to CSV EXEL JSON - Expert Advisor for exporting and analyzing symbols, account, terminal parameters, active trades, current account state, trading history, global variables.   Generates the following report types: * Symbols Parameters — spread, tick size, min/max lot, swap, … * Account Parameters — balance, equity, leverage, currency, margin info, … * Terminal Parameters — server, version, language, date, environment, … * Trade History — orders, deals, positions, se
FREE
Fibonacci will be designed by default based on the monthly candle but you can simultaneously view Fibonacci on a weekly candle or you can choose your two favorite timeframes. When you run this script, an input prompt will appear and the following input parameters can be configured: Input Parameters: Name Example Default Timeframe1 Monthly 43200 Timeframe2 Weekly 10080 TF1status 1 on 1 TF2status 0 off 0 candleID you can choose which candle to apply 1 Prefix1 It's is the prefix of the first object
FREE
This indicator shows the gaps on the current chart with a rectangle shape and indicates when the gap is filled by closing the shape. Gaps are considered over the shadows. Allows sending alerts by e-mail or push notifications when a gap is found. Parameters SizeGAP - Size of the gap that you want to indicate; HGcolor1 - Color of the gap in an upward movement; HGcolor2 - Color of the gap in a downward movement; HGstyle - The style of rectangle to be drawn; StartCalculationFromBar - How many candl
Cyber Engulf Göstergesi - MetaTrader 4 için Profesyonel Alım-Satım Sistemi Gösterge Nedir? Cyber Engulf, hareketli ortalamayla filtrelenmiş engulfing formasyonlarını tespit eden gelişmiş bir teknik analiz göstergesidir. Trend dönüşüm noktalarını belirleyerek piyasa yapısındaki değişimleri erken tespit etmenizi sağlar. Ne Yapar? Engulfing mum formasyonlarını otomatik olarak tanımlar Hareketli ortalama filtresiyle yanlış sinyalleri eleyer Alım ve satım sinyallerini mavi/yukarı ve kırmızı/aşağı ok
FREE
The indicator detects and displays М. Gartley's Butterfly pattern. The pattern is plotted by the extreme values of the ZigZag indicator (included in the resources, no need to install). After detecting the pattern, the indicator notifies of that by the pop-up window, a mobile notification and an email. The pattern and wave parameters are displayed on the screenshots. The default parameters are used for demonstration purposes only in order to increase the amount of detected patterns. Parameters z
This indicator is the basis for an Expert Advisor that can be categorized as "almost Grail". See details below.             This indicator displays the projection of the Renko chart on the price chart. This projection is displayed as a stepped line, not as "bricks" (rectangles). See slides 1 and 2. Abbreviated name of the indicator: LRC – L ine of R enko on the price C hart.             The principle of its construction is very simple. First, a grid of horizontal lines (levels) is bu
FREE
MASi Three Screens
Aleksey Terentev
5 (2)
MASi Three Screens is based on the trading strategy by Dr. Alexander Elder. This indicator is a collection of algorithms. Algorithms are based on the analysis of charts of several timeframes. You can apply any of the provided algorithms. List of versions of algorithms:     ThreeScreens v1.0 - A simple implementation, with analysis of the MACD line;     ThreeScreens v1.1 - A simple implementation, with analysis of the MACD histogram;     ThreeScreens v1.2 - Combines the first two algorithms in
FREE
Bu ürünün alıcıları ayrıca şunları da satın alıyor
Neuro Poseidon MT4
Daria Rezueva
4.93 (30)
Neuro Poseidon is a new indicator by Daria Rezueva. It combines precise trading signals with adaptive TP/SL levels - creating best possible trades as a result! Message me and get  Neuro Poseidon Assistant  as a gift to automize your trading process! What makes it stand out? 1. Proven profitability on all assets and timeframes 2. Only confirmed BUY and SELL signals present on the chart 3. Adaptive TP & SL levels generated by the software for each trade 4. Easy to understand - suitable for all
M1 Sniper
Oleg Rodin
5 (23)
M1 SNIPER kullanımı kolay bir işlem göstergesi sistemidir. M1 zaman dilimi için tasarlanmış bir ok göstergesidir. Gösterge, M1 zaman diliminde scalping için bağımsız bir sistem olarak kullanılabilir ve mevcut işlem sisteminizin bir parçası olarak kullanılabilir. Bu işlem sistemi özellikle M1'de işlem yapmak için tasarlanmış olsa da, diğer zaman dilimleriyle de kullanılabilir. Başlangıçta bu yöntemi XAUUSD ve BTCUSD ticareti için tasarladım. Ancak bu yöntemi diğer piyasalarda işlem yaparken de ya
Gann Made Easy
Oleg Rodin
4.84 (164)
Gann Made Easy , bay teorisini kullanarak ticaretin en iyi ilkelerine dayanan, profesyonel ve kullanımı kolay bir Forex ticaret sistemidir. WD Gann. Gösterge, Zararı Durdur ve Kâr Al Seviyeleri dahil olmak üzere doğru SATIN AL ve SAT sinyalleri sağlar. PUSH bildirimlerini kullanarak hareket halindeyken bile işlem yapabilirsiniz. Satın alma işleminden sonra, alım satım talimatlarını ve harika ek göstergeleri ücretsiz olarak almak için lütfen benimle iletişime geçin! Muhtemelen Gann ticaret yöntem
Dynamic Forex28 Navigator
Bernhard Schweigert
4.43 (7)
Dynamic Forex28 Navigator - Yeni Nesil Forex Ticaret Aracı. ŞU ANDA %49 İNDİRİM. Dynamic Forex28 Navigator, uzun zamandır popüler olan göstergelerimizin evrimidir ve üçünün gücünü tek bir göstergede birleştirir: Gelişmiş Döviz Gücü28 Göstergesi (695 inceleme) + Gelişmiş Döviz İMPULS ve UYARI (520 inceleme) + CS28 Kombo Sinyalleri (Bonus). Gösterge hakkında ayrıntılar https://www.mql5.com/en/blogs/post/758844 Yeni Nesil Güç Göstergesi Ne Sunuyor?  Orijinallerde sevdiğiniz her şey, şimdi yeni
Scalper Inside PRO
Alexey Minkov
4.74 (68)
Scalper Inside PRO Scalper Inside PRO is an intraday trend and scalping indicator for MetaTrader 4 that uses an exclusive algorithm to quickly detect market direction and key target levels. It automatically calculates entry, exit and multiple profit targets, and shows detailed performance statistics so you can see how different instruments and strategies performed. This helps you choose the most suitable trading instruments for the current market conditions. Additionally, you can easily integrat
Enigmera
Ivan Stefanov
5 (8)
ENIGMERA: Pazarın Kalbi Önemli: MQL5.com demosu Strategy Tester'da çalışır ve Enigmera'nın tüm işlevlerini tam olarak yansıtmayabilir. Daha fazla bilgi için açıklamayı, ekran görüntülerini ve videoyu kontrol edin. Herhangi bir sorunuz varsa, bana mesaj göndermekten çekinmeyin! Göstergenin kodu tamamen yeniden yazılmıştır. 3.0 sürümü, yeni işlevler ekler ve göstergenin başlangıcından bu yana biriken hataları giderir. Giriş Bu gösterge ve ticaret sistemi, finansal piyasalara dikkat çekici bir ya
KT Alpha Hunter Arrows MT4
KEENBASE SOFTWARE SOLUTIONS
Çoğu ok göstergesi size yalnızca bir sinyal verir ve geri kalan her şeyi sizin çözmenizi bekler. KT Alpha Hunter Arrows ise size eksiksiz bir işlem planı sunar. Her sinyal oku, grafikte hazır bir planla birlikte görünür: giriş çizgisi, stop loss, dört take profit seviyesi ve bu sembol ile zaman diliminin o anda işlem yapmaya değer olup olmadığını gösteren canlı edge kararı. Pakete dahil olan Trade Manager EA, siz işleme girdikten sonra yönetimi üstlenir. Böylece piyasa hareketli ve duygusal açıd
Trend Catcher ind
Ramil Minniakhmetov
5 (2)
TREND YAKALAYICI GÖSTERGE Trend Yakalayıcı Gösterge, yazarın tescilli ve özelleştirilmiş uyarlanabilir trend analiz göstergelerinin bir kombinasyonunu kullanarak piyasa fiyat hareketlerini analiz eder. Kısa vadeli gürültüyü filtreleyerek ve temel momentum gücüne, volatilite genişlemesine ve fiyat yapısı davranışına odaklanarak gerçek piyasa yönünü belirler. Ayrıca, hareketli ortalamalar, RSI ve volatilite filtreleri gibi yumuşatma ve trend filtreleme özelleştirilmiş göstergelerinin bir kombina
PRO Renko Sistemi, RENKO grafikleri ticareti için özel olarak tasarlanmış son derece hassas bir ticaret sistemidir. Bu, çeşitli ticaret araçlarına uygulanabilen evrensel bir sistemdir. Sistemi etkin piyasa sana doğru ters sinyallerine erişim hakkı denilen ses nötralize eder. Göstergenin kullanımı çok kolaydır ve sinyal üretiminden sorumlu tek bir parametreye sahiptir. Aracı, seçtiğiniz herhangi bir ticaret aracına ve renko çubuğunun boyutuna kolayca uyarlayabilirsiniz. Yazılımımla karlı bir
Trend Lines PRO
Roman Podpora
5 (1)
TREND ÇİZGİLERİ PRO     Piyasanın gerçek yön değişimini anlamaya yardımcı olur. Gösterge, gerçek trend dönüşlerini ve büyük oyuncuların piyasaya yeniden girdiği noktaları gösterir. Anlıyorsun     BOS hatları  Daha yüksek zaman dilimlerindeki trend değişiklikleri ve önemli seviyeler, karmaşık ayarlar veya gereksiz gürültü olmadan gösterilir. Sinyaller yeniden çizilmez ve çubuk kapandıktan sonra grafikte kalır. VERSION MT 5     -    RFI LEVELS PRO  göstergesiyle birlikte kullanıldığında maksimum p
Genesis Matrix Pro is a professional multi-timeframe trend detection indicator designed to help traders identify high-quality market alignment with clarity and structure. It combines 12 different technical indicators into one visual alignment matrix, allowing traders to quickly see when market conditions are bullish, bearish, or neutral. A signal is generated only when the selected strategies are aligned, helping reduce noise and improve decision-making. PLEASE CONTACT ME AFTER PURCHASE TO GET
Bu ürün 2026 piyasası için güncellendi ve en son MT5 sürümleri için optimize edildi. FİYAT GÜNCELLEME BİLDİRİMİ: Smart Trend Trading System şu anda $99 fiyatıyla sunulmaktadır. Sonraki 30 satın alma işleminden sonra fiyat $199 olacaktır. ÖZEL TEKLİF: Smart Trend Trading System satın aldıktan sonra bana özel mesaj gönderin, Smart Universal EA’yı ÜCRETSİZ olarak alın ve Smart Trend sinyallerinizi otomatik işlemlere dönüştürün. Smart Trend Trading System, daha temiz sinyaller, daha iyi trend yönü
PZ Trend Trading
PZ TRADING SLU
4.8 (5)
Capture every opportunity: your go-to indicator for profitable trend trading Trend Trading is an indicator designed to profit as much as possible from trends taking place in the market, by timing pullbacks and breakouts. It finds trading opportunities by analyzing what the price is doing during established trends. [ Installation Guide | Update Guide | Troubleshooting | FAQ | All Products ] Trade financial markets with confidence and efficiency Profit from established trends without getting whips
Step into the world of Forex trading with confidence, clarity, and precision using   Gold Indicator   a next-generation tool engineered to take your trading performance to the next level. Whether you’re a seasoned professional or just beginning your journey in the currency markets, Gold Indicator equips you with powerful insights and help you trade smarter, not harder. Built on the proven synergy of three advanced indicators, Gold Indicator focuses exclusively on medium and long-term trends eli
PZ Swing Trading
PZ TRADING SLU
5 (3)
Protect against whipsaws: revolutionize your swing trading approach Swing Trading is the first indicator designed to detect swings in the direction of the trend and possible reversal swings. It uses the baseline swing trading approach, widely described in trading literature. The indicator studies several price and time vectors to track the aggregate trend direction and detects situations in which the market is oversold or overbought and ready to correct. [ Installation Guide | Update Guide | Tro
Current event:  https://c.mql5.com/1/326/A2SR2025_NoMusic.gif A. A2SR nedir ?   * Önde gelen bir teknik göstergedir (yeniden boyama yok, gecikme yok). -- Rehberlik : -- https://www.mql5.com/en/blogs/post/734748/page4#comment_16532516 adresinde -- ve https://www.mql5.com/en/users/yohana/blog A2SR, Destek (talep) ve Direnç (arz) seviyelerini belirlemede özel bir tekniğe sahiptir. İnternette gördüğümüz sıradan yoldan farklı olarak A2SR, gerçek SR seviyelerini belirlemede özgün bir konsepte sahi
BTMM State Engine Pro is a MetaTrader 4 indicator for traders who use the Beat The Market Maker approach: Asian session context, kill zone timing, level progression, peak formation detection, and a multi-pair scanner from a single chart. It combines cycle state logic with a built-in scanner dashboard so you do not need the same tool on many charts at once. What it does Draws the Asian session range; session times can follow broker server offset or be set in inputs. Tracks level progression (L
" Dynamic Scalper System " göstergesi, trend dalgaları içinde işlem yapmak için scalping yöntemi için tasarlanmıştır. Başlıca döviz çiftleri ve altın üzerinde test edilmiştir, diğer işlem araçlarıyla uyumluluğu mümkündür. Ek fiyat hareketi desteğiyle trend boyunca pozisyonların kısa vadeli açılması için sinyaller sağlar. Göstergenin prensibi. Büyük oklar trend yönünü belirler. Küçük oklar şeklinde scalping için sinyaller üreten bir algoritma trend dalgaları içinde çalışır. Kırmızı oklar yüksel
Neo Wave PRO
Nikolay Raykov
5 (1)
Price & Time Market Structure Indicator A professional market structure tool that analyzes waves through both price and time — not price alone. Main Description NeoWave PRO is a professional market structure indicator for MetaTrader 4 designed for traders who want to move beyond traditional one-dimensional wave tools such as ZigZag, swing indicators, and basic high/low systems. Most wave indicators analyze only one thing: Price. But a real market wave is not only a price movement. A true wave de
MonsterDash Harmonic Indicator is a harmonic pattern dashboard. It recognizes all major patterns. MonsterDash is a dashboard that displays all detected patterns for all symbols and (almost) all timeframes in sortable and scrollable format. Users can add their own user defined patterns . MonsterDash can open and update charts with the pattern found. Settings MonsterDash's default settings are good enough most of the time. Feel free to fine tune them to your needs. The color settings are for thos
Apollo SR Master , Destek/Direnç bölgelerinde alım satımı daha kolay ve güvenilir hale getiren özelliklere sahip bir Destek/Direnç göstergesidir. Gösterge, yerel fiyat zirvelerini ve diplerini tespit ederek Destek/Direnç bölgelerini herhangi bir gecikme olmadan gerçek zamanlı olarak hesaplar. Ardından, yeni oluşan Destek/Direnç bölgesini doğrulamak için, Destek/Direnç bölgesinin dikkate alınabileceğini ve gerçek bir SAT veya AL sinyali olarak kullanılabileceğini gösteren özel bir sinyal gösterir
ŞU ANDA %40INDIRIMLI Yeni Başlayanlar veya Uzman Tüccarlar için En İyi Çözüm! Bu Gösterge benzersiz, yüksek kaliteli ve uygun fiyatlı bir ticaret aracıdır çünkü bir dizi tescilli özellik ve yeni bir formül ekledik. Sadece BİR grafik ile 28 Forex çifti için Döviz Gücünü okuyabilirsiniz! Yeni bir trendin veya scalping fırsatının tam tetik noktasını belirleyebildiğiniz için ticaretinizin nasıl gelişeceğini hayal edin? Kullanım kılavuzu: buraya tıklayın Bu ilk olan, orijinal! Değersiz bir özent
Auto Optimized Parabolic RSI: Gelişmiş 3D Momentum Motoru Çoğu perakende indikatörü, piyasa volatilitesi değiştiği an çöken statik girdilere dayandığı için başarısız olur. Auto Optimized Parabolic RSI, kendi matematiksel avantajını sürekli olarak yeniden hesaplayarak "indikatör körelmesi" (indicator decay) sorununu çözer ve kurumsal düzeyde kantitatif adaptasyonu doğrudan MT5 terminalinize getirir. Temel Avantaj: Özel Bellek İçi (In-Memory) 3D Optimizasyon   Standart otomatik optimize ediciler,
Advanced Supply Demand
Bernhard Schweigert
4.91 (300)
Özel Ticaret –%40 İndirim Yeni Başlayanlar veya Uzman Yatırımcılar İçin En İyi Çözüm! Bu gösterge, bir dizi özel özellik ve yeni bir formül içerdiği için benzersiz, yüksek kaliteli ve uygun fiyatlı bir işlem aracıdır. Bu güncelleme ile çift zaman dilimi bölgeleri gösterebileceksiniz. Sadece daha yüksek bir zaman dilimini değil, hem grafik zaman dilimini hem de daha yüksek zaman dilimini gösterebileceksiniz: İÇ İÇE GEÇMİŞ BÖLGELER GÖSTERİYOR. Tüm Arz Talep yatırımcıları buna bayılacak. :) Önem
Bu gösterge, Elliott dalga teorisi ile iki şekilde çalışır: Otomatik Çalışma: Bu modda gösterge, Elliott dalga teorisine uygun olarak grafikteki beş hareket dalgasını otomatik olarak tespit edecek ve tahminlerde bulunacak, potansiyel ters dönüş bölgelerini belirleyecektir. Ayrıca, önemli gelişmeler hakkında tüccarları uyarılar ve bildirimlerle bilgilendirebilme yeteneğine sahiptir. Bu otomatik işlev, Elliott dalga desenlerinin tanımlanması ve analiz sürecini basit hale getirir. Manuel Çalışma: B
Introduction to Fractal Pattern Scanner Fractal Indicator refers to the technical indicator that makes use of the fractal geometry found in the financial market. Fractal Pattern Scanner is the advanced Fractal Indicator that brings the latest trading technology after the extensive research and development work in the fractal geometry in the financial market. The most important feature in Fractal Pattern Scanner is the ability to measure the turning point probability as well as the trend probabi
Bull versus Bear
Mohamed Hassan
4.5 (18)
Send us a message after your purchase to receive more information on how to get your  BONUS  for FREE  that works in great combination with Bull vs Bear ! Bull versus Bear is an easy-to-use Forex indicator that gives traders clear and accurate signals based on clear trend retests . Forget about lagging indicators or staring at charts for hours because  Bull vs Bear provides real-time entries with no lag and no repaint, so you can trade with confidence. Bull vs Bear  helps you enter trades during
Scalper Vault
Oleg Rodin
5 (37)
Scalper Vault , başarılı bir scalping için ihtiyacınız olan her şeyi size sağlayan profesyonel bir scalping sistemidir. Bu gösterge, forex ve ikili opsiyon tüccarları tarafından kullanılabilecek eksiksiz bir ticaret sistemidir. Önerilen zaman çerçevesi M5'tir. Sistem size trend yönünde doğru ok sinyalleri sağlar. Ayrıca size üst ve alt sinyaller ve Gann piyasa seviyeleri sağlar. Göstergeler, PUSH bildirimleri dahil her türlü uyarıyı sağlar. Göstergeyi satın aldıktan sonra lütfen benimle iletişim
The Propfolio Master Suite is the ultimate all-in-one analytical workstation for professional traders. Combining the power of the Beat The Market Maker (BTMM) methodology, Smart Money Concepts (SND/Liquidity), and Advanced Volume Profile, this suite replaces multiple different indicators with one optimized engine. Monitor up to 14 pairs simultaneously from a single chart, instantly identify market cycles, and seamlessly map institutional footprints with the click of a button. The Command Center
Introduction Harmonic Patterns are best used to predict potential turning point. Traditionally, Harmonic Pattern was identified manually connecting peaks and troughs points in the chart. Manual harmonic pattern detection is painfully tedious and not suitable for everyone. You are often exposed under subjective pattern identification with manual pattern detection. To avoid these limitations, Harmonic Pattern Plus was designed to automate your harmonic pattern detection process. The functionality
Yazarın diğer ürünleri
Market Steps MT4
Mahdi Ebrahimzadeh
5 (2)
Piyasa Adımları (Market Steps) göstergesi, Gann Zaman/Fiyat korelasyonlarına dayalı olarak tasarlanmış ve oluşturulmuştur ve Forex Piyasası için Fiyat Eylemine özel kurallarla optimize edilmiştir. Yüksek hacimli siparişler için potansiyel fiyat bölgelerini tahmin etmek için Piyasa emri akışı kavramlarını kullanır. Gösterge Düzeyleri, kendi başına işlem yapmak için veya diğer Stratejilerin/Göstergelerin yanlış sinyallerini filtrelemek için bir kombinasyon olarak kullanılabilir. Her tüccar, çokl
Bu kod orijinal olarak LuxAlgo tarafından başka bir programlama dilinden yayınlanmıştır.  Birçok ticaret amacı için kullanılabilecek kabul edilebilir Trend Tahmin yeteneklerine sahiptir. işte kod oluşturucudan bazı açıklamalar: Bu gösterge, daha önce yayınlanan Nadaraya-Watson yumuşatıcıları üzerine inşa edilmiştir. Burada, fiyat ve zarf uçları arasındaki kesişmelerden entegre uyarılar içeren Çekirdek Düzgünleştirmeye dayalı bir zarf göstergesi oluşturduk. Nadaraya-Watson tahmincisinin aksine
Gösterge başka bir programlama dilinden MQL'e çevrilmiştir. RTI, grafiğin Trendini salınımlı bir şekilde tanımlamak için güçlü bir ücrettir. İşte orijinal programcıdan bazı notlar: Genel Bakış Zeiierman tarafından geliştirilen Göreceli Trend Endeksi (RTI), piyasa trendinin gücünü ve yönünü ölçmek için tasarlanmış yenilikçi bir teknik analiz aracıdır. Bazı geleneksel göstergelerin aksine RTI, piyasadaki dalgalanmalara uyum sağlama ve yanıt verme konusunda kendine özgü bir yeteneğe sahip olmakl
LuxAlgo tarafından kodlanan başka bir platformdan dönüştürülen gösterge. Hareketli Ortalamayı farklı türde ekledim ve veri çeşitliliğini kaynakladım. Orijinal versiyonda hareketli ortalama SMA'dır ve piyasadan gelen veri kaynağı sadece mumların kapanışından toplanır.  Bu sürümde birçok hareketli ortalama türü ve ayrıca yüksek / düşük / HL2 / HLC / HLC2 / ... gibi kaynak verileri seçebilirsiniz. İşte orijinal geliştiriciden bazı detaylar: Range Detector göstergesi, fiyatların değiştiği aralı
MACD Bands
Mahdi Ebrahimzadeh
Ürün başka bir platformdan dönüştürülmüştür ve orijinali TradeMaster Lite tarafından oluşturulmuştur. Gösterge temel olarak MACD konseptini kullanır, ancak yeteneklerini farklı Ortalama Alma teknikleri ile güçlendirir. Trend ve tersine dönüş tanımlama için güçlüdür.  İşte orijinal sahibinden bazı detaylar: Aşağıdaki özelliklere sahip özelleştirilebilir bir MACD göstergesi sunuyoruz: Çoklu zaman dilimi Olağandışı oynaklığı tespit etmek için sapma bantları 9 Hareketli Ortalama türleri Koşullu r
Market Steps MT5
Mahdi Ebrahimzadeh
Piyasa Adımları (Market Steps) göstergesi, Gann Zaman/Fiyat korelasyonlarına dayalı olarak tasarlanmış ve oluşturulmuştur ve Forex Piyasası için Fiyat Eylemine özel kurallarla optimize edilmiştir. Yüksek hacimli siparişler için potansiyel fiyat bölgelerini tahmin etmek için Piyasa emri akışı kavramlarını kullanır. Gösterge Düzeyleri, kendi başına işlem yapmak için veya diğer Stratejilerin/Göstergelerin yanlış sinyallerini filtrelemek için bir kombinasyon olarak kullanılabilir. Her tüccar, çokl
Filtrele:
[Silindi] 2024.05.31 02:53 
 

Kullanıcı değerlendirmeye herhangi bir yorum bırakmadı

Değerlendirmeye yanıt