MTF Fractals

5

Multi timeframe fractal indicator which shows the higher timeframe's fractal point on lower timeframes.


Parameters

  • Fractal_Timeframe: You can set the higher timeframes for fractals.
  • Maxbar: You can set the maximum number of candles for the calculations.
  • Up_Fractal_Color, Up_Fractal_Symbol, Down_Fractal_Color, Down_Fractal_Symbol: Color and style settings of the fractal points.
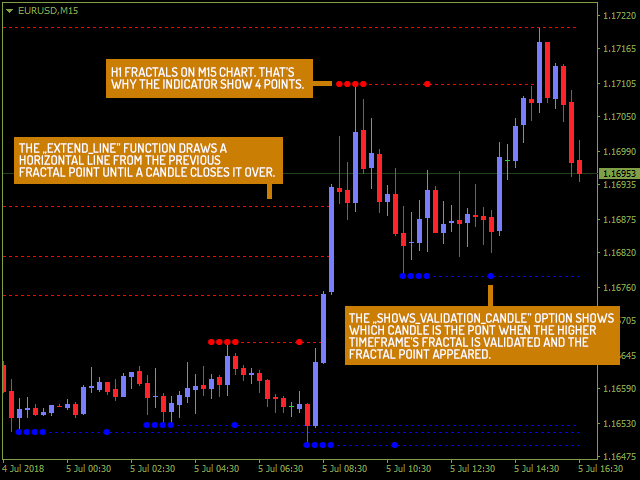
  • Extend_Line: Draws a horizontal line from the previous fractal point until a candle closes it over or a user-specified forward and backward length.
  • Extend_Line_Until_Left_Candles, Extend_Line_Until_Right_Candles: You can set fixed length of the extend line function.
  • Extend_Line_to_Background: Move horizontal line object to background or not.
  • Show_Validation_Candle: Marks a candle with a point when the higher timeframe's fractal is validated and the fractal point appears.
  • Up_Fractal_Extend_Line_Color, Up_Fractal_Extend_Width, Up_Fractal_Extend_Style, Down_Fractal_Extend_Line_Color, Down_Fractal_Extend_Width, Down_Fractal_Extend_Style: Color and style settings of the extended lines.
İncelemeler 6
RUS2668 Иванов
634
RUS2668 Иванов 2025.07.31 10:36 
 

Очень хороший

alf2016
249
alf2016 2023.01.16 21:03 
 

zum weiterempfehlen guter Indikator

simonlongster
250
simonlongster 2022.10.25 19:07 
 

Great indicator - thanks for sharing for free!

Önerilen ürünler
It works based on the Stochastic Indicator algorithm. Very useful for trading with high-low or OverSold/Overbought swing strategies. StochSignal will show a buy arrow if the two lines have crossed in the OverSold area and sell arrows if the two lines have crossed in the Overbought area. You can put the Stochastic Indicator on the chart with the same parameters as this StochSignal Indicator to understand more clearly how it works. This indicator is equipped with the following parameters: Inputs d
FREE
Wicks UpDown Target GJ Wicks UpDown Target GJ is specialized in GJ forex pairs. Choppy movement up and down on the opening range every day.  Trading breakouts on London session and New York session is recommended. Guideline Entry Strategy Idea: Step 1 - Breakout Forming (Warning! Trade on London Session and New York Session) Step 2 - Breakout Starting (Take Action on your trading plan) Step 3 - Partial Close your order & set breakeven (no-risk) Step 4 - Target complete Step 5 - Don't trade
FREE
Toby Strategy Indicator
Ahmd Sbhy Mhmd Ahmd ʿYshh
The indicator rely on The Toby strategy >> The mother candle which is bigger in range than the previous six candles. A vertical line shows the last Toby Candle with the targets shown up and down. The strategy is about the closing price out of the range of the toby candle to reach the 3 targets..The most probable to be hit is target1 so ensure reserving your profits and managing your stop lose.
FREE
.....................................hi....................... ................for showing high s and low s and support and resistanses .....................we have a lot of ways............................... it can be helpful for finding trends , higher highs , higher lows , lower highs , lower lows .......................today i write on of thems.......................... ........................you can enter the number of last support and resistanses .........................and it will dra
FREE
PREVIOUS INDICATOR’S DATA MA CROSSOVER https://www.mql5.com/en/users/earobotkk/seller#products P/S: If you like this indicator, please rate it with 5 stars in the review section, this will increase its popularity so that other users will be benefited from using it. This indicator notifies and draws an arrow on the chart whenever    the MA line has crossed over its previous indicator’s data MA filtered by MA Trend.   It also displays total pips gained from all the entry set-ups. Setting ·   You c
FREE
Smart FVG Indicator MT4 – MetaTrader 4 için Gelişmiş Fair Value Gap Tespiti Smart FVG Indicator MT4, MetaTrader 4 grafikleri üzerinde Fair Value Gap (FVG) alanlarını profesyonel düzeyde tespit eder, izler ve uyarılar üretir. ATR tabanlı filtreleme ile piyasa yapısını dikkate alan akıllı bir algoritmayı birleştirerek gürültüyü azaltır, likiditeye uyum sağlar ve sadece en önemli dengesizlikleri bırakarak daha net işlem kararları almanıza yardımcı olur. Başlıca avantajlar Doğru FVG tespiti: Sadec
FREE
Virtual Targets
Hoang Van Dien
3.83 (6)
This indicator is very useful for day traders or short term traders. No need to calculate the number of pips manually, just look at the chart and you will see the Virtual Take Profit / Virtual Stop Loss target line and evaluate whether the entry point is feasible to reach the intended target or not. Enter the intended Take Profit / Stop Loss pips for your trade. The indicator will display Virtual Take Profit / Virtual Stop Loss lines for you to easily see if the target is feasible or not.
FREE
Multi Divergence Indicator for MT4 - User Guide Introduction Overview of the Multi Divergence Indicator and its capabilities in identifying divergences across multiple indicators. Importance of divergence detection in enhancing trading strategies and decision-making. List of Indicators RSI CCI MACD STOCHASTIC AWSOME MFI ACCELERATOR OSMA MOMENTUM WPR( Williams %R) RVI Indicator Features Indicator Selection:  How to enable/disable specific indicators (RSI, CCI, MACD, etc.) for divergence detectio
FREE
With this system you can spot high-probability trades in direction of strong trends. You can profit from stop hunt moves initiated by the smart money! Important Information How you can maximize the potential of the scanner, please read here: www.mql5.com/en/blogs/post/718109 Please read also the blog about the usage of the indicator: Professional Trading With Strong Momentum This FREE Version of the indicator works only on EURUSD and GBPUSD. The full version of the indicator can be found here:
FREE
LineBreakMT4
Nattadecha Tangpakinwat
Key Features: Type of Indicator: Line Break Chart Indicator Usage: Identifying trend reversals and potential market turning points. Input Parameters: The primary input parameter is 'Lines_Break,' which represents the number of lines the price needs to move to create a new line in the opposite direction. How it works: The indicator draws green and red histogram bars to represent the line break chart. Green bars indicate an upward trend, and red bars indicate a downward trend. The indicator calcul
FREE
PZ Trendlines
PZ TRADING SLU
4.27 (11)
Tired of plotting trendlines? The PZ TrendLines indicator applies a mechanical approach to the construction of trend lines for you! [ Installation Guide | Update Guide | Troubleshooting | FAQ | All Products ] It can draw up to 18 trendlines Trendlines can be optionally based on fractals Each line represents a breakout level Each trendline can be broken or rejected Configurable amount of lines Configurable colors Author Arturo López Pérez, private investor and speculator, software engineer and
FREE
Wise Men Indicator demo
Bohdan Kasyanenko
3 (2)
The indicator displays signals according to the strategy of Bill Williams on the chart. Demo version of the indicator has the same features as the paid, except that it can work only on a demo account . Signal "First Wise Man" is formed when there is a divergent bar with angulation.  Bullish divergent bar - with lower minimum and closing price in the upper half. Bearish divergent bar - higher maximum and the closing price at the bottom half. Angulation is formed when all three lines of Alligator
FREE
This indicator shows the latest untouched support and resistance as horizontal lines. The indicator can show support/resistance from higher timeframes. With this indicator you can e.g. easily see the support/resistance of the timeframes H4, D1 and W1 on a H1 chart, which can be a big advantage while time your entry on H1. This is the FREE version of the indicator: Support Resistance Multi Time Frame The free version works only on EURUSD and GBPUSD! Parameters referenceTF: the timeframe from whi
FREE
WH DrawFib Pro MT4
Wissam Hussein
5 (7)
Grafiklerinize manuel olarak Fibonacci seviyeleri çizmekten sıkıldınız mı? Ticaretinizdeki temel destek ve direnç seviyelerini belirlemenin uygun ve etkili bir yolunu mu arıyorsunuz? Başka yerde arama!   Otomatik fibonacci   seviyeleri   yapan nihai MetaTrader 4 göstergesi olan DrawFib Pro ile tanışın       grafikleriniz üzerinde çizim yapar ve bu seviyeler aşıldığında zamanında uyarılar sağlar. DrawFib Pro ile ticaret stratejilerinizi geliştirebilir, zamandan tasarruf edebilir ve daha bilinçli
FREE
SuperTrend V
Muhammad Hassaan
*This is TradingView indicator converted to mql4* The SuperTrend V indicator is a popular technical analysis tool used to identify trends and potential trend reversals in financial markets. It is based on the concept of the SuperTrend indicator but incorporates additional features and variations. The SuperTrend V indicator uses a combination of price action and volatility to determine the trend direction and generate trading signals. Here are the key components and features of the indicator: Ca
Follow The Line
Oliver Gideon Amofa Appiah
3.94 (16)
FOLLOW THE LINE GET THE FULL VERSION HERE: https://www.mql5.com/en/market/product/36024 This indicator obeys the popular maxim that: "THE TREND IS YOUR FRIEND" It paints a GREEN line for BUY and also paints a RED line for SELL.  It gives alarms and alerts of all kinds. IT DOES NOT REPAINT and can be used for all currency pairs and timeframes. Yes, as easy and simple as that. Even a newbie can use it to make great and reliable trades. NB: For best results, get my other premium indicators for more
FREE
PZ The Zone
PZ TRADING SLU
4.33 (3)
This indicator displays buy or sell signals according to Bill Williams' definition of the Trading Zone. [ Installation Guide | Update Guide | Troubleshooting | FAQ | All Products ] Easy to use and understand Avoid trading flat markets Deterministic indicator with clear rules The indicator is non-repainting It implements alerts of all kinds It has straightforward trading implications. A blue arrow is a buy signal A red arrow is a sell signal According to Bill Williams trading in the zone helps to
FREE
Discover the power of precision and efficiency in your trading with the " Super Auto Fibonacci " MT4 indicator. This cutting-edge tool is meticulously designed to enhance your technical analysis, providing you with invaluable insights to make informed trading decisions. Key Features: Automated Fibonacci Analysis: Say goodbye to the hassle of manual Fibonacci retracement and extension drawing. "Super Auto Fibonacci" instantly identifies and plots Fibonacci levels on your MT4 chart, saving you tim
FREE
Extremum Reverse Bar
Yurij Izyumov
2.8 (5)
This indicator has been created for finding the probable reversal points of the symbol price. A small candlestick reversal pattern is used it its operation in conjunction with a filter of extremums. The indicator is not redrawn! If the extremum filter is disabled, the indicator shows all points that have a pattern. If the extremum filter is enabled, the condition works – if the history Previous bars 1 candles back contains higher candles and they are farther than the Previous bars 2 candle, such
FREE
Support and resistance levels
Alexandr Bryzgalov
4.29 (17)
The indicator displays the probable ( Support and resistance ) levels. The indicator draws horizontal and trend levels of support and resistance. The indicator settings: Trends - the mode for displaying trend lines or horizontal lines of support and resistance Yes - display trend lines only No - display horizontal lines only UseResource - use the resources built into the indicator. Yes - use the ZigZag indicator from the resources of the product. No - use a custom ZigZag indicator. HistoryBar -
FREE
FlatBreakout
Aleksei Vorontsov
FlatBreakout (Free Version) Flat Range Detector and Breakout Panel for MT4 — GBPUSD Only FlatBreakout is the free version of the professional FlatBreakoutPro indicator, specially designed for flat (range) detection and breakout signals on the GBPUSD pair only. Perfect for traders who want to experience the unique fractal logic of FlatBreakout and test breakout signals on a live market without limitations. Who Is This Product For? For traders who prefer to trade breakout of flat ranges (breakout,
FREE
Power Trend Free
Yurij Kozhevnikov
5 (2)
Power Trend Free - the indicator shows the trend strength in the selected period. Input Parameters The indicator has three input parameters: Period - a positive number greater than one, it shows the number of candlesticks used for calculations. If you enter one or zero, there will be no error, but the indicator will not be drawn. Applied Price - the standard "Apply to:" set meaning data used for the indicator calculation: Close - Close prices; Open - Open prices; High - High prices; Low - Low p
FREE
Artem
Artem Konkov
4.5 (2)
I present an effective tool for determining the reversal on the H4 timeframe. The indicator is installed on the M30 chart. All parameters are already set.                                                                                                          Proper use of the indicator: Unfortunately, the test in the tester will not give a correct idea about the indicator, so the rent for one month is as affordable as possible. You do not need to install the file on a remote server. Install it
FREE
The free version of the Hi Low Last Day MT4 indicator . The Hi Low Levels Last Day MT4 indicator shows the high and low of the last trading day . The ability to change the color of the lines is available . Try the full version of the Hi Low Last Day MT4 indicator , in which additional indicator features are available : Displaying the minimum and maximum of the second last day Displaying the minimum and maximum of the previous week Sound alert when crossing max . and min . levels Selecting an arb
FREE
Railway Tracks Pattern — Reversal Pattern Indicator Railway Tracks Pattern is an indicator that automatically detects a powerful two-candle reversal pattern on the chart. It looks for two candles with opposite directions (bullish and bearish), similar in size, and with minimal wicks — a clear sign of momentum shift. How it works: The first candle is strong and directional. The second candle moves in the opposite direction and is of similar size. Both candles have small shadows (wicks). The
FREE
Rainbow MT4 is a technical indicator based on Moving average with period 34 and very easy to use. When price crosses above MA and MA changes color to green, it’s a signal to buy. When price crosses below MA and MA changes color to red, it’s a signal to sell. The Expert advisor ( Rainbow EA MT4) based on Rainbow MT4 indicator, as you can see in the short video below is now available here .
FREE
Pivot SR
Wartono
4.67 (3)
It identifies the pivot, support, and resistance price levels of the selected timeframe and then draws lines onto the chart. FEATURES: Option to specify the Timeframe Period in the PivotSR calculation. Option to display the PivotSR of the last candle, of every candle, or of the current candle. Options for displaying labels, line thickness, and line color. PivotSR can be interpreted as reversal levels or past price reactions that can be used as the basis for current price analysis. Some traders b
FREE
Adjustable Fractal MT4
Dmitry Timin
4.76 (25)
Adjustable Fractal MT4 is a modification of Bill Williams' Fractals indicator. The fractal consists of a two sets of arrows - up (upper fractals) and down (lower fractals). Each fractal satisfies the following conditions: Upper fractal - maximum (high) of a signal bar exceeds or is equal to maximums of all bars from the range to the left and to the right; Lower fractal - minimum (low) of a signal bar is less or equal to minimums of all bars from the range to the left and to the right. Unlike a s
FREE
TreendLines
Sajjad Karimi
5 (1)
''Trendlines'' is an Indicator, that every Trader need and shows Trendline and  Support and resistance levels in all  Timeframe's. Also In 1-hour, 4-hour and daily time frames and Current timeframes, support, and resistance levels are specified and trend lines are drawn so that the trader can see all levels on a chart.   In   Properties   it is possible to turn off unnecessary Lines.  In ' Tendency indicator '' , as full package of Predictions that every Trader need, there  is also the Predict
FREE
BE auto
Muhammad Ridzuan Mohd Radzali
5 (2)
Indicator automatically draw bullish and bearish engulfing without any rules. Bearish and Bullish engulf is well known area for supply and demand area marking. This indicator can be used in any strategy that required supply demand zone. Show Last Engulf : Enable this option to show unfresh engulfing  Candle to calculate : set 0 will load all history bar and can use up more memory Bearish Engulfing Colour : Pick any colour that suit Bearish Engulfing Colour  : Pick any colour that suit -Use this
FREE
Bu ürünün alıcıları ayrıca şunları da satın alıyor
Precautions for subscribing to indicator This indicator only supports the computer version of MT4 Does not support MT5, mobile phones, tablets The indicator only shows the day's entry arrow The previous history arrow will not be displayed (Live broadcast is for demonstration) The indicator is a trading aid Is not a EA automatic trading No copy trading function The indicator only indicates the entry position No exit (target profit)  The entry stop loss point is set at 30-50 PIPS Or the front hi
Gann Made Easy
Oleg Rodin
4.83 (155)
Gann Made Easy , bay teorisini kullanarak ticaretin en iyi ilkelerine dayanan, profesyonel ve kullanımı kolay bir Forex ticaret sistemidir. WD Gann. Gösterge, Zararı Durdur ve Kâr Al Seviyeleri dahil olmak üzere doğru SATIN AL ve SAT sinyalleri sağlar. PUSH bildirimlerini kullanarak hareket halindeyken bile işlem yapabilirsiniz. LÜTFEN ÜCRETSİZ OLARAK TİCARET İPUÇLARI, BONUSLAR VE GANN MADE EA ASİSTANI ALMAK İÇİN SATIN ALIMDAN SONRA BENİMLE İLETİŞİME GEÇİN! Muhtemelen Gann ticaret yöntemlerini b
M1 Sniper
Oleg Rodin
5 (18)
M1 SNIPER kullanımı kolay bir işlem göstergesi sistemidir. M1 zaman dilimi için tasarlanmış bir ok göstergesidir. Gösterge, M1 zaman diliminde scalping için bağımsız bir sistem olarak kullanılabilir ve mevcut işlem sisteminizin bir parçası olarak kullanılabilir. Bu işlem sistemi özellikle M1'de işlem yapmak için tasarlanmış olsa da, diğer zaman dilimleriyle de kullanılabilir. Başlangıçta bu yöntemi XAUUSD ve BTCUSD ticareti için tasarladım. Ancak bu yöntemi diğer piyasalarda işlem yaparken de ya
Meravith
Ivan Stefanov
5 (2)
Market maker aracı. Meravith şunları yapar: Tüm zaman dilimlerini analiz eder ve geçerli trendi gösterir. Alış ve satış hacimlerinin eşit olduğu likidite bölgelerini (hacim dengesi) vurgular. Farklı zaman dilimlerinden tüm likidite seviyelerini doğrudan grafiğinizde gösterir. Referansınız için metin tabanlı piyasa analizi üretir ve sunar. Mevcut trende göre hedefler, destek seviyeleri ve stop-loss noktalarını hesaplar. İşlemleriniz için risk/ödül oranını hesaplar. Hesap bakiyenize göre pozisyon
Game Changer Indicator
Vasiliy Strukov
4.75 (16)
Game Changer è un indicatore di tendenza rivoluzionario, progettato per essere utilizzato su qualsiasi strumento finanziario, per trasformare il tuo MetaTrader in un potente analizzatore di trend. Funziona su qualsiasi intervallo temporale e aiuta a identificare i trend, segnala potenziali inversioni, funge da meccanismo di trailing stop e fornisce avvisi in tempo reale per risposte tempestive del mercato. Che tu sia un professionista esperto o un principiante in cerca di un vantaggio, questo st
Miraculous Göstergesi – Gann Dokuz Kareye Dayalı %100 Tekrarlamayan Forex ve İkili Araç Bu video, Forex ve İkili Opsiyon traderları için özel olarak geliştirilmiş son derece doğru ve güçlü bir ticaret aracı olan Miraculous Göstergesi 'ni tanıtıyor. Bu göstergeyi benzersiz kılan, efsanevi Gann Dokuz Karesi ve Gann Titreşim Yasası 'na dayanmasıdır; bu da onu modern ticarette mevcut en hassas tahmin araçlarından biri yapmaktadır. Miraculous Göstergesi tamamen tekrarlamaz ; yani mum kapandıktan son
Şu anda %40 İNDİRİMLİ! Herhangi bir Acemi veya Uzman Tüccar için En İyi Çözüm! Bu gösterge paneli yazılımı 28 döviz çifti üzerinde çalışıyor. Ana göstergelerimizden 2'sine (Gelişmiş Para Birimi Gücü 28 ve Gelişmiş Para Birimi Dürtüsü) dayanmaktadır. Tüm Forex piyasasına harika bir genel bakış sağlar. Gelişmiş Para Birimi Gücü değerlerini, para birimi hareket hızını ve tüm (9) zaman dilimlerinde 28 Forex çifti için sinyalleri gösterir. Trendleri ve / veya scalping fırsatlarını belirlemek için
Looking for a powerful yet lightweight swing detector that accurately identifies market structure turning points? Want clear, reliable buy and sell signals that work across any timeframe and any instrument? Buy Sell Arrow MT Swing is built exactly for that — precision swing detection made simple and effective. This indicator identifies Higher Highs (HH) , Higher Lows (HL) , Lower Highs (LH) , and Lower Lows (LL) with remarkable clarity. It is designed to help traders easily visualize market str
FX Power MT4 NG
Daniel Stein
4.95 (21)
FX Power: Daha Akıllı Ticaret Kararları için Para Birimlerinin Gücünü Analiz Edin Genel Bakış FX Power , her piyasa koşulunda başlıca para birimlerinin ve altının gerçek gücünü anlamak için vazgeçilmez bir araçtır. Güçlü para birimlerini alıp zayıf olanları satarak, FX Power ticaret kararlarınızı basitleştirir ve yüksek olasılıklı fırsatları ortaya çıkarır. İster trendlere sadık kalın ister Delta'nın aşırı değerlerini kullanarak tersine dönüşleri öngörün, bu araç ticaret tarzınıza mükemmel bir
Scalper Inside PRO
Alexey Minkov
4.74 (69)
An exclusive indicator that utilizes an innovative algorithm to swiftly and accurately determine the market trend. The indicator automatically calculates opening, closing, and profit levels, providing detailed trading statistics. With these features, you can choose the most appropriate trading instrument for the current market conditions. Additionally, you can easily integrate your own arrow indicators into Scalper Inside Pro to quickly evaluate their statistics and profitability. Scalper Inside
Scalper Vault
Oleg Rodin
5 (36)
Scalper Vault , başarılı bir scalping için ihtiyacınız olan her şeyi size sağlayan profesyonel bir scalping sistemidir. Bu gösterge, forex ve ikili opsiyon tüccarları tarafından kullanılabilecek eksiksiz bir ticaret sistemidir. Önerilen zaman çerçevesi M5'tir. Sistem size trend yönünde doğru ok sinyalleri sağlar. Ayrıca size üst ve alt sinyaller ve Gann piyasa seviyeleri sağlar. Göstergeler, PUSH bildirimleri dahil her türlü uyarıyı sağlar. Göstergeyi satın aldıktan sonra lütfen benimle iletişim
"Dragon's Tail" is an integrated trading system, not just an indicator. This system analyzes each candle on a minute-by-minute basis, which is particularly effective in high market volatility conditions. The "Dragon's Tail" system identifies key market moments referred to as "bull and bear battles". Based on these "battles", the system gives trade direction recommendations. In the case of an arrow appearing on the chart, this signals the possibility of opening two trades in the indicated directi
Trend indicator AI
Ramil Minniakhmetov
4.66 (80)
Trend Ai göstergesi, trend tanımlamasını işlem yapılabilir giriş noktaları ve geri dönüş uyarılarıyla birleştirerek bir yatırımcının piyasa analizini geliştirecek harika bir araçtır. Bu gösterge, kullanıcıların forex piyasasının karmaşıklıklarında güvenle ve hassasiyetle yol almalarını sağlar. Birincil sinyallerin ötesinde, Trend Ai göstergesi geri çekilmeler veya düzeltmeler sırasında ortaya çıkan ikincil giriş noktalarını belirleyerek, yatırımcıların belirlenen trend içindeki fiyat düzeltmele
Super Signal – Skyblade Edition Profesyonel No-Repaint / Gecikmesiz Trend Sinyal Sistemi, Olağanüstü Kazanma Oranı ile | MT4 / MT5 için 1 dakika, 5 dakika ve 15 dakika gibi daha düşük zaman dilimlerinde en iyi şekilde çalışır. Temel Özellikler: Super Signal – Skyblade Edition, özellikle trend bazlı işlemler için geliştirilmiş akıllı bir sinyal sistemidir. Yalnızca güçlü, yönlü ve gerçek momentum destekli piyasa hareketlerini tespit etmek amacıyla çok katmanlı bir filtreleme yapısı kullanır. Bu
Pulse Scalping Line - an indicator for identifying potential pivot points. Based on this indicator, you can build an effective Martingale system. According to our statistics, the indicator gives a maximum of 4 erroneous pivot points in a series. On average, these are 2 pivot points. That is, the indicator shows a reversal, it is erroneous. This means that the second signal of the indicator will be highly accurate. Based on this information, you can build a trading system based on the Martingale
MetaForecast M4
Vahidreza Heidar Gholami
5 (2)
MetaForecast, fiyat verilerindeki harmonileri kullanarak herhangi bir piyasanın geleceğini tahmin eder ve görselleştirir. Piyasa her zaman tahmin edilemezken, fiyatlarda bir desen varsa, MetaForecast geleceği mümkün olduğunca doğru bir şekilde tahmin edebilir. Benzer ürünlere göre, MetaForecast piyasa eğilimlerini analiz ederek daha kesin sonuçlar üretebilir. Giriş Parametreleri Past size (Geçmiş boyut) MetaForecast'ın gelecekteki tahminler oluşturmak için kullandığı çubuk sayısını belirtir. Mo
Gold Scalper Super
Aleksandr Makarov
5 (2)
Gold Scalper Super is an easy-to-use trading system. The indicator can be used as a standalone scalping system on the M1 time frame, as well as part of your existing trading system. Bonus: when purchasing an indicator, Trend Arrow Super is provided free of charge, write to us after purchase. The indicator 100% does not repaint!!! If a signal appears, it does not disappear! Unlike indicators with redrawing, which lead to the loss of a deposit, because they can show a signal and then remove it.
Volatility Trend System - girişler için sinyaller veren bir ticaret sistemi. Oynaklık sistemi, trend yönünde doğrusal ve noktasal sinyaller ve ayrıca yeniden çizme ve gecikme olmaksızın trendden çıkmak için sinyaller verir. Trend göstergesi, orta vadeli trendin yönünü izler, yönünü ve değişimini gösterir. Sinyal göstergesi volatilitedeki değişikliklere dayalıdır ve piyasa girişlerini gösterir. Gösterge, çeşitli uyarı türleri ile donatılmıştır. Çeşitli alım satım araçlarına ve zaman dilimlerine
Currency Strength Wizard , başarılı ticaret için size hepsi bir arada çözüm sağlayan çok güçlü bir göstergedir. Gösterge, birden çok zaman dilimindeki tüm para birimlerinin verilerini kullanarak şu veya bu forex çiftinin gücünü hesaplar. Bu veriler, şu veya bu para biriminin gücünü görmek için kullanabileceğiniz, kullanımı kolay para birimi endeksi ve para birimi güç hatları biçiminde temsil edilir. İhtiyacınız olan tek şey, işlem yapmak istediğiniz tabloya göstergeyi eklemektir ve gösterge size
Apollo SR Master , Destek/Direnç bölgelerinde alım satımı daha kolay ve güvenilir hale getiren özelliklere sahip bir Destek/Direnç göstergesidir. Gösterge, yerel fiyat zirvelerini ve diplerini tespit ederek Destek/Direnç bölgelerini herhangi bir gecikme olmadan gerçek zamanlı olarak hesaplar. Ardından, yeni oluşan Destek/Direnç bölgesini doğrulamak için, Destek/Direnç bölgesinin dikkate alınabileceğini ve gerçek bir SAT veya AL sinyali olarak kullanılabileceğini gösteren özel bir sinyal gösterir
Atomic Analyst
Issam Kassas
5 (3)
Öncelikle belirtmek gerekir ki bu Ticaret Göstergesi Yeniden Çizim Yapmaz, Gecikmez ve Gecikme Göstermez, bu da hem manuel hem de robot ticareti için ideal hale getirir. Kullanıcı kılavuzu: ayarlar, girişler ve strateji. Atom Analisti, Piyasada Daha İyi Bir Avantaj Bulmak İçin Fiyatın Gücünü ve Momentumunu Kullanan PA Fiyat Hareketi Göstergesidir. Gürültüleri ve Yanlış Sinyalleri Kaldırmaya ve Ticaret Potansiyelini Artırmaya Yardımcı Olan Gelişmiş Filtrelerle Donatılmıştır. Birden fazla katman
Introducing a powerful, precision-engineered indicator that seamlessly combines Pivot Points, Moving Averages, and Multi-Timeframe Analysis to deliver high-probability Buy and Sell signals in real-time. This tool is your strategic edge, designed to identify trend reversals, market momentum, and optimal trade entries, no matter your preferred trading style. Our algorithm goes beyond standard indicators—by analyzing multiple timeframes simultaneously, it spots true market turning points while fi
M1 Arrow
Oleg Rodin
4.81 (21)
Piyasanın iki temel ilkesine dayanan bir gün içi stratejisi. Algoritma, ek filtreler kullanarak hacimlerin ve fiyat dalgalarının analizine dayanmaktadır. Göstergenin akıllı algoritması, yalnızca iki piyasa faktörü bir araya geldiğinde bir sinyal verir. Gösterge, daha yüksek zaman çerçevesinin verilerini kullanarak M1 grafiğinde belirli bir aralıktaki dalgaları hesaplar. Ve dalgayı doğrulamak için gösterge, hacme göre analizi kullanır. Bu gösterge hazır bir ticaret sistemidir. Bir tüccarın ihtiya
Shogun Trade
Yuki Miyake
5 (2)
SHOGUN Trade - The Shocking Truth of 16 Years Unoptimized. Shogun Trading February Special Sale – Only $88 (Regular Price $199)! This special offer is available until February 28th . As we are dedicated to further product development and optimization , we are offering this discount in exchange for your valuable feedback. Your insights will directly influence our next round of updates and feature enhancements. Price: $88 (Special discount from $199) Requirement: Please leave a review and share
First 25 copies at $80, after that price becomes $149 (3 copies left) Gold Signal Pro is a powerful MT4 indicator designed to help traders spot strong price reactions in the market. It focuses on clear wick rejections , showing when price strongly rejects a level and often continues in the same direction. Gold Signal Pro is mainly built for scalping gold (XAUUSD) and works best on lower timeframes like M5 and M15 , where timing matters most. That said, it can also be used on any forex pair, a
Smc Blast Signal
Mohit Dhariwal
5 (3)
Full Fledged EA and Alert plus for alerts will also be provided in this offer along with the purchase of Indicator. Limited copies only at this price and Ea too. Grab your copy soon Alert plus for indicator with set file is kept in comment section with the image  SMC Blast Signal with FVG, BOS and trend Breakout The SMC Blast Signal is a Precise trading system for Meta Trader 4 that uses Smart Money Concepts (SMC), including Fair Value Gaps (FVG) and Break of Structure (BOS), to identify high-pr
Weis Wave with Alert
Trade The Volume Waves Single Member P.C.
4.82 (22)
Rental/Lifetime Package Options and Privileges' Rent Monthly Six Months   Yearly/Lifetime Weis Wave with Speed with Alert+Speed Index x x x Manual  x x x Quick Set up Video x x x Blog x x x Lifetime Updates x x x Setup and Training Material x x Rectangle Break Alert Tool      x Discord Access Channel "The SI traders" x   How to trade info visit:    http://www.tradethevolumewaves.com   ** If you purchase please contact me to setup your  : training Room and  complete manual access.  This is
RFI levels PRO
Roman Podpora
5 (1)
Bu gösterge, fiyat dönüş noktalarını ve fiyat geri dönüş bölgelerini doğru bir şekilde gösterir.       Başlıca oyuncular   . Yeni trendlerin nerede oluştuğunu görüyorsunuz ve her işlem üzerinde kontrolü elinizde tutarak, azami hassasiyetle kararlar alıyorsunuz. TREND LINES PRO   göstergesiyle birlikte kullanıldığında maksimum potansiyelini ortaya koyar.  VERSION MT5 Göstergenin gösterdiği şey: Yeni bir trendin başlangıcında aktivasyonla birlikte tersine dönüş yapıları ve tersine dönüş seviyeler
Beast Super Signal
Dustin Vlok
4.73 (89)
Kârlı ticaret fırsatlarını kolaylıkla belirlemenize yardımcı olabilecek güçlü bir forex ticaret göstergesi mi arıyorsunuz? Beast Super Signal'den başka bir yere bakmayın. Bu kullanımı kolay trend tabanlı gösterge, sürekli olarak piyasa koşullarını izleyerek yeni gelişen trendleri araştırır veya mevcut trendlere atlar. Canavar Süper Sinyali, tüm dahili stratejiler birbiriyle uyumlu ve %100 örtüştüğünde bir al ya da sat sinyali vererek ek onay ihtiyacını ortadan kaldırır. Sinyal oku uyarısını aldı
PRO Renko Sistemi, RENKO grafikleri ticareti için özel olarak tasarlanmış son derece hassas bir ticaret sistemidir. Bu, çeşitli ticaret araçlarına uygulanabilen evrensel bir sistemdir. Sistemi etkin piyasa sana doğru ters sinyallerine erişim hakkı denilen ses nötralize eder. Göstergenin kullanımı çok kolaydır ve sinyal üretiminden sorumlu tek bir parametreye sahiptir. Aracı, seçtiğiniz herhangi bir ticaret aracına ve renko çubuğunun boyutuna kolayca uyarlayabilirsiniz. Yazılımımla karlı bir
Yazarın diğer ürünleri
Çift çizgi sinyalleri, üç seviyeli sistem, çoklu zaman dilimi desteği, özelleştirilebilir görsel sinyaller ve yüksek düzeyde yapılandırılabilir uyarı sistemi ile gelişmiş Stochastic RSI osilatörü. Stochastic RSI Nedir? Stochastic RSI (StochRSI), fiyat verisi yerine RSI değerlerine stokastik osilatör formülünü uygulayan bir momentum göstergesidir. Belirli bir dönem boyunca RSI seviyesini yüksek-düşük aralığına göre ölçerek 0 ile 100 arasında salınan daha hassas bir gösterge oluşturur. StochRSI
FREE
SC MTF Stochastic MT5
Krisztian Kenedi
4.87 (15)
Çift çizgi sinyalleri, üç seviyeli sistem, çoklu zaman dilimi desteği, özelleştirilebilir görsel sinyaller ve yüksek düzeyde yapılandırılabilir uyarı sistemi ile gelişmiş Stokastik Osilatör. Stokastik Osilatör Nedir? Stokastik Osilatör, bir menkul kıymetin kapanış fiyatını belirli bir dönem boyunca fiyat aralığıyla karşılaştıran bir momentum göstergesidir. Gösterge iki çizgiden oluşur: %K (Ana çizgi) ve %D (Sinyal çizgisi, %K'nın hareketli ortalaması). Stokastik 0 ile 100 arasında salınır. Yük
FREE
Çoklu zaman dilimi desteği, özelleştirilebilir görsel sinyaller ve yapılandırılabilir uyarı sistemi ile Chaikin Money Flow (CMF) göstergesi. CMF Nedir? Chaikin Money Flow (CMF), Marc Chaikin tarafından geliştirilen ve belirli bir dönem boyunca alım ve satım baskısını ölçen hacim ağırlıklı bir momentum göstergesidir. Gösterge, her dönem için Para Akışı Çarpanını hesaplar ve geriye dönük bakış dönemi boyunca ağırlıklı bir ortalama oluşturur. CMF +1 ile -1 arasında salınır, pozitif değerler alım
FREE
Çift hat sinyalleri, çok zaman dilimli destek, özelleştirilebilir görsel sinyaller ve yapılandırılabilir uyarı sistemi ile DIDI Göstergesi (3-MA Oranı). DIDI Nedir? DIDI, farklı periyotlara sahip üç Hareketli Ortalama (MA) arasındaki ilişkiyi gösteren bir oran göstergesidir: Curta (kısa), Media (orta) ve Longa (uzun). Gösterge, Curta ve Longa MA'larını Media MA'ya bölerek iki oran çizgisi hesaplar; Media MA 1.0'da referans seviyesi olarak hizmet eder. DIDI, hızlı ve yavaş hareketli ortalamalar
FREE
SC MTF Rsi MT5
Krisztian Kenedi
5 (6)
Çoklu zaman dilimi desteği, özelleştirilebilir görsel sinyaller ve yapılandırılabilir alarm sistemi ile Relative Strength Index (RSI) göstergesi. RSI Nedir? Relative Strength Index (RSI), fiyat değişikliklerinin hızını ve büyüklüğünü ölçen bir momentum osilatörüdür. Gösterge 0 ile 100 arasında salınım yapar ve belirli bir dönem boyunca son kazançların büyüklüğünü son kayıplarla karşılaştırır. RSI esas olarak aşırı alım ve aşırı satım koşullarını belirlemek için kullanılır. Yüksek okumalar aşır
FREE
Çift çizgi sinyalleri, çoklu zaman dilimi desteği, özelleştirilebilir görsel sinyaller ve yapılandırılabilir alarm sistemi ile Triple Exponential Moving Average (TRIX) göstergesi. TRIX nedir? TRIX, üçlü üstel düzleştirilmiş hareketli ortalamanın değişim oranını gösteren bir momentum osilatörüdür. Gösterge, fiyata ardışık üç Üstel Hareketli Ortalama (EMA) uygulanarak, ardından barlar arasındaki yüzde değişimi ölçülerek hesaplanır. TRIX, küçük fiyat dalgalanmalarını azaltır ve trendleri belirlem
FREE
SC MTF Ma for MT5 with alert
Krisztian Kenedi
4.58 (12)
Highly configurable Moving average indicator. Features: Highly customizable alert functions (at levels, crosses, direction changes via email, push, sound, popup) Multi timeframe ability Color customization (at levels, crosses, direction changes) Linear interpolation option Works on strategy tester in multi timeframe mode (at weekend without ticks also) Parameters: MA Timeframe:  You can set the lower/higher timeframes for Ma. MA Bar Shift:  Y ou can set the offset of the line drawing. MA Period,
FREE
Çoklu zaman dilimi desteği, özelleştirilebilir görsel sinyaller ve yapılandırılabilir uyarı sistemi ile Accelerator Oscillator (AC) göstergesi. AC Nedir? Accelerator Oscillator (AC), Bill Williams tarafından geliştirilen ve mevcut itici gücün ivmelenmesini veya yavaşlamasını ölçen bir momentum göstergesidir. Gösterge, Awesome Oscillator (AO) ile onun 5 periyotluk Basit Hareketli Ortalaması (SMA) arasındaki fark olarak hesaplanır. AC, piyasa momentumunun ivmelenip ivmelenmediğini veya yavaşlayı
FREE
Highly configurable Trader Dynamic Index (TDI) indicator. Features: Highly customizable alert functions (at levels, crosses, direction changes via email, push, sound, popup) Multi timeframe ability (higher and lower timeframes also) Color customization (at levels, crosses, direction changes) Linear interpolation and histogram mode options Works on strategy tester in multi timeframe mode (at weekend without ticks also) Adjustable Levels Parameters: TDI Timeframe: You can set the lower/higher ti
FREE
SC MTF Trix MT4
Krisztian Kenedi
5 (1)
Çift çizgi sinyalleri, çoklu zaman dilimi desteği, özelleştirilebilir görsel sinyaller ve yapılandırılabilir alarm sistemi ile Triple Exponential Moving Average (TRIX) göstergesi. TRIX nedir? TRIX, üçlü üstel düzleştirilmiş hareketli ortalamanın değişim oranını gösteren bir momentum osilatörüdür. Gösterge, fiyata ardışık üç Üstel Hareketli Ortalama (EMA) uygulanarak, ardından barlar arasındaki yüzde değişimi ölçülerek hesaplanır. TRIX, küçük fiyat dalgalanmalarını azaltır ve trendleri belirlem
FREE
SC MTF Stochastic MT4
Krisztian Kenedi
4.33 (9)
Çift çizgi sinyalleri, üç seviyeli sistem, çoklu zaman dilimi desteği, özelleştirilebilir görsel sinyaller ve yüksek düzeyde yapılandırılabilir uyarı sistemi ile gelişmiş Stokastik Osilatör. Stokastik Osilatör Nedir? Stokastik Osilatör, bir menkul kıymetin kapanış fiyatını belirli bir dönem boyunca fiyat aralığıyla karşılaştıran bir momentum göstergesidir. Gösterge iki çizgiden oluşur: %K (Ana çizgi) ve %D (Sinyal çizgisi, %K'nın hareketli ortalaması). Stokastik 0 ile 100 arasında salınır. Yük
FREE
Trading information panel with risk calculator, order management, fractal trend indicator, and customizable keyboard shortcuts for quick trading. Features: Real-time trading information display (spread, ATR, swap, price levels, etc.) Integrated risk calculator with three modes (lot size, money risk, point distance) Quick order management with keyboard shortcuts (buy, sell, close, half close) Multi-timeframe fractal trend indicator (shows price position relative to fractal high/low) Adjustable pa
FREE
Highly configurable Macd indicator. Features: Highly customizable alert functions (at levels, crosses, direction changes via email, push, sound, popup) Multi timeframe ability Color customization (at levels, crosses, direction changes) Linear interpolation and histogram mode options Works on strategy tester in multi timeframe mode (at weekend without ticks also) Adjustable Levels Parameters: Macd Timeframe:  You can set the lower/higher timeframes for Macd. Macd   Bar Shift:  you can set the o
FREE
Çift hat sinyalleri, çok zaman dilimli destek, özelleştirilebilir görsel sinyaller ve yapılandırılabilir uyarı sistemi ile DIDI Göstergesi (3-MA Oranı). DIDI Nedir? DIDI, farklı periyotlara sahip üç Hareketli Ortalama (MA) arasındaki ilişkiyi gösteren bir oran göstergesidir: Curta (kısa), Media (orta) ve Longa (uzun). Gösterge, Curta ve Longa MA'larını Media MA'ya bölerek iki oran çizgisi hesaplar; Media MA 1.0'da referans seviyesi olarak hizmet eder. DIDI, hızlı ve yavaş hareketli ortalamalar
FREE
Highly configurable Williams %R indicator. Features: Highly customizable alert functions (at levels, crosses, direction changes via email, push, sound, popup) Multi timeframe ability Color customization (at levels, crosses, direction changes) Linear interpolation and histogram mode options Works on strategy tester in multi timeframe mode (at weekend without ticks also) Adjustable Levels Parameters: Williams %R Timeframe:  You can set the current or a higher timeframes for Williams %R. Williams
FREE
Çoklu zaman dilimi desteği, özelleştirilebilir görsel sinyaller ve yapılandırılabilir uyarı sistemi ile Commodity Channel Index (CCI) göstergesi. CCI Nedir? Commodity Channel Index (CCI), 1980 yılında Donald Lambert tarafından geliştirilen ve fiyatın istatistiksel ortalamasından sapmasını ölçen çok yönlü bir osilatördür. Gösterge, mevcut fiyat seviyesini belirli bir dönem boyunca ortalama fiyat seviyesi ile karşılaştırarak aşırı alım ve aşırı satım koşullarını ortaya çıkarır. CCI öncelikle dön
FREE
Çift çizgi sinyalleri, üç seviyeli sistem, çoklu zaman dilimi desteği, özelleştirilebilir görsel sinyaller ve yüksek düzeyde yapılandırılabilir uyarı sistemi ile gelişmiş Stochastic RSI osilatörü. Stochastic RSI Nedir? Stochastic RSI (StochRSI), fiyat verisi yerine RSI değerlerine stokastik osilatör formülünü uygulayan bir momentum göstergesidir. Belirli bir dönem boyunca RSI seviyesini yüksek-düşük aralığına göre ölçerek 0 ile 100 arasında salınan daha hassas bir gösterge oluşturur. StochRSI
FREE
Highly configurable Bollinger Bands indicator. Features: Highly customizable alert functions (at levels, crosses, direction changes via email, push, sound, popup) Multi timeframe ability Color customization (at levels, crosses, direction changes) Linear interpolation option Works on strategy tester in multi timeframe mode (at weekend without ticks also) Parameters: Bollinger Bands Timeframe:  You can set the lower/higher timeframes for Bollinger Bands. Bollinger Bands Bar Shift: Y ou can set th
FREE
Çoklu zaman dilimi desteği, özelleştirilebilir görsel sinyaller ve yapılandırılabilir uyarı sistemi ile Chaikin Money Flow (CMF) göstergesi. CMF Nedir? Chaikin Money Flow (CMF), Marc Chaikin tarafından geliştirilen ve belirli bir dönem boyunca alım ve satım baskısını ölçen hacim ağırlıklı bir momentum göstergesidir. Gösterge, her dönem için Para Akışı Çarpanını hesaplar ve geriye dönük bakış dönemi boyunca ağırlıklı bir ortalama oluşturur. CMF +1 ile -1 arasında salınır, pozitif değerler alım
FREE
Çoklu zaman dilimi desteği, özelleştirilebilir görsel sinyaller ve yapılandırılabilir uyarı sistemi ile Average Directional Movement Index (ADX) göstergesi. ADX Nedir? J. Welles Wilder tarafından geliştirilen Average Directional Movement Index (ADX), yönünden bağımsız olarak bir trendin gücünü ölçmek için kullanılan teknik bir göstergedir. ADX, Pozitif Yön Göstergesi (+DI) ve Negatif Yön Göstergesi (-DI)'den türetilir, ancak trendin yönünü göstermez – yalnızca gücünü gösterir. ADX değerleri 0
FREE
Çoklu zaman dilimi desteği, özelleştirilebilir görsel sinyaller ve yapılandırılabilir alarm sistemi ile Awesome Oscillator (AO) göstergesi. AO nedir? Bill Williams tarafından geliştirilen Awesome Oscillator (AO), medyan fiyatın (High + Low)/2'nin 34 dönemlik ve 5 dönemlik Basit Hareketli Ortalama (SMA) arasındaki farkı hesaplayarak piyasa momentumunu ölçen bir momentum göstergesidir. Bu gösterge, genel piyasa yönünü ve potansiyel dönüş noktalarını belirlemeye yardımcı olur. AO sıfır çizgisi et
FREE
Çoklu zaman dilimi desteği, özelleştirilebilir görsel sinyaller ve yapılandırılabilir alarm sistemi ile Elder's Force Index (EFI) göstergesi. EFI nedir? Elder's Force Index (EFI), Dr. Alexander Elder tarafından geliştirilen, fiyat değişimi, yön ve hacmi birleştirerek fiyat hareketlerinin arkasındaki gücü ölçen teknik bir göstergedir. Gösterge, (Kapanış - Önceki Kapanış) × Hacim olarak hesaplanır, ardından Üstel Hareketli Ortalama (EMA) ile düzleştirilir. EFI sıfır çizgisi etrafında dalgalanır.
FREE
Trading information panel with risk calculator, order management, fractal trend indicator, and customizable keyboard shortcuts for quick trading. Features: Real-time trading information display (spread, ATR, swap, price levels, etc.) Integrated risk calculator with three modes (lot size, money risk, point distance) Quick order management with keyboard shortcuts (buy, sell, close, half close) Multi-timeframe fractal trend indicator (shows price position relative to fractal high/low) Adjustable
FREE
Çok zaman dilimli destek, özelleştirilebilir görsel sinyaller ve yapılandırılabilir uyarı sistemi ile Balance of Power (BOP) göstergesi. BOP Nedir? Balance of Power (BOP), fiyat değişimini çubuğun aralığıyla karşılaştırarak alıcıların satıcılara karşı gücünü ölçen bir osilatördür. Gösterge (Close - Open) / (High - Low) olarak hesaplanır, ardından Basit Hareketli Ortalama (SMA) ile yumuşatılır. BOP değerleri -1 ile +1 arasında değişir. Pozitif değerler alıcıların daha güçlü olduğunu gösterir (k
FREE
Çoklu zaman dilimi desteği, özelleştirilebilir görsel sinyaller ve yapılandırılabilir uyarı sistemi ile Accelerator Oscillator (AC) göstergesi. AC Nedir? Accelerator Oscillator (AC), Bill Williams tarafından geliştirilen ve mevcut itici gücün ivmelenmesini veya yavaşlamasını ölçen bir momentum göstergesidir. Gösterge, Awesome Oscillator (AO) ile onun 5 periyotluk Basit Hareketli Ortalaması (SMA) arasındaki fark olarak hesaplanır. AC, piyasa momentumunun ivmelenip ivmelenmediğini veya yavaşlayı
FREE
Highly configurable OBV indicator. Features: Highly customizable alert functions (at levels, crosses, direction changes via email, push, sound, popup) Multi timeframe ability Color customization (at levels, crosses, direction changes) Linear interpolation and histogram mode options Works on strategy tester in multi timeframe mode (at weekend without ticks also) Adjustable Levels Parameters: OBV Timeframe:  You can set the lower/higher timeframes for OBV. OBV Bar Shift:  Y ou can set the offset
FREE
Highly configurable Moving average indicator. Features: Highly customizable alert functions (at levels, crosses, direction changes via email, push, sound, popup) Multi timeframe ability Color customization (at levels, crosses, direction changes) Linear interpolation option Works on strategy tester in multi timeframe mode (at weekend without ticks also) Parameters: MA Timeframe:  You can set the lower/higher timeframes for Ma. MA Bar Shift:  Y ou can set the offset of the line drawing. MA Period,
FREE
Highly configurable Osma indicator. Features: Highly customizable alert functions (at levels, crosses, direction changes via email, push, sound, popup) Multi timeframe ability Color customization (at levels, crosses, direction changes) Linear interpolation and histogram mode options Works on strategy tester in multi timeframe mode (at weekend without ticks also) Adjustable Levels Parameters: Osma Timeframe:  You can set the lower/higher timeframes for Osma. Osma   Bar Shift:  Y ou can set the
FREE
Sc MTF Volume MT5
Krisztian Kenedi
5 (1)
Highly configurable Volume indicator. Features: Highly customizable alert functions (at levels, crosses, direction changes via email, push, sound, popup) Multi timeframe ability Color customization (at levels, crosses, direction changes) Linear interpolation and histogram mode options Works on strategy tester in multi timeframe mode (at weekend without ticks also) Parameters: Volume Timeframe: You can set the lower/higher timeframes for Volume. Volume Bar Shift: you can set the offset of the l
FREE
Çoklu zaman dilimi desteği, özelleştirilebilir görsel sinyaller ve yapılandırılabilir uyarı sistemi ile Commodity Channel Index (CCI) göstergesi. CCI Nedir? Commodity Channel Index (CCI), 1980 yılında Donald Lambert tarafından geliştirilen ve fiyatın istatistiksel ortalamasından sapmasını ölçen çok yönlü bir osilatördür. Gösterge, mevcut fiyat seviyesini belirli bir dönem boyunca ortalama fiyat seviyesi ile karşılaştırarak aşırı alım ve aşırı satım koşullarını ortaya çıkarır. CCI öncelikle dön
FREE
Filtrele:
RUS2668 Иванов
634
RUS2668 Иванов 2025.07.31 10:36 
 

Очень хороший

Michael-MT5
449
Michael-MT5 2024.08.19 12:01 
 

Kullanıcı incelemeye herhangi bir yorum bırakmadı

Martin Brown
803
Martin Brown 2023.10.01 15:49 
 

Kullanıcı incelemeye herhangi bir yorum bırakmadı

alf2016
249
alf2016 2023.01.16 21:03 
 

zum weiterempfehlen guter Indikator

simonlongster
250
simonlongster 2022.10.25 19:07 
 

Great indicator - thanks for sharing for free!

ALLAHAKBAR123
70
ALLAHAKBAR123 2021.10.17 11:31 
 

very Good Indicator

İncelemeye yanıt