Multi Timeframe TDI Dashboard
- Göstergeler
- Sürüm: 3.0
- Etkinleştirmeler: 5
Transform your chart clutter into a streamlined, institutional-grade trading workstation.
As professional traders, we know that scanning dozens of currency pairs across multiple timeframes is both exhausting and prone to costly human error.
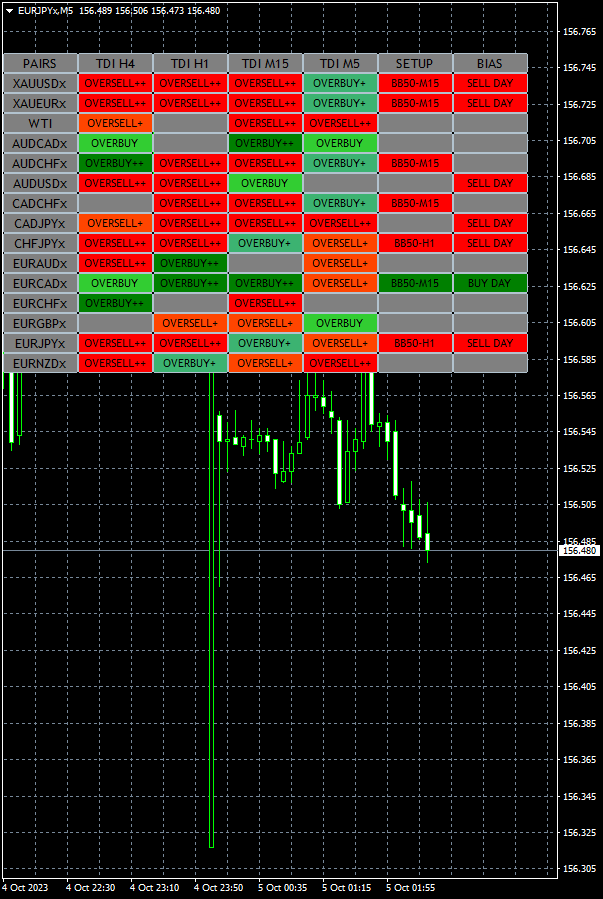
The Ultimate Multi-Timeframe TDI Dashboard solves this by consolidating the powerful mechanics of the Traders Dynamic Index (TDI) into a single, clean, and highly sophisticated visual matrix.
Stop flipping through charts. Let this dashboard instantly pinpoint the high-probability setups across your entire watchlist.
Key Professional Features:
- Comprehensive Trend Detection Across Timeframes: Instantly tracks market conditions from H4 down to M1 simultaneously, giving you an immediate eagle-eye view of structural alignment.
- Systematic Daily Bias Determination: Automatically calculates and displays the macro direction (BUY DAY / SELL DAY), ensuring you never trade against the dominant daily momentum.
- Actionable Trading Setup Identification: Features a dedicated, highlighted SETUP column that flashes clear visual cues the exact moment multi-timeframe criteria align.
- Advanced Watchlist Analysis & Filtering: Seamlessly monitor multiple assets (Forex, Gold, Oil, Crypto) in real-time on a single screen without lagging your terminal.
- Instant Multi-Timeframe Condition Alerts: Receive real-time alerts (Pop-up, Push notifications, or Sound) when a specific pair hits extreme oversold/overbought conditions across your selected timeframes.
- Fully Configurable Asset Management: Easily customize your pairs list, adjust the underlying TDI parameters, and tailor the dashboard layout to match your specific trading style.
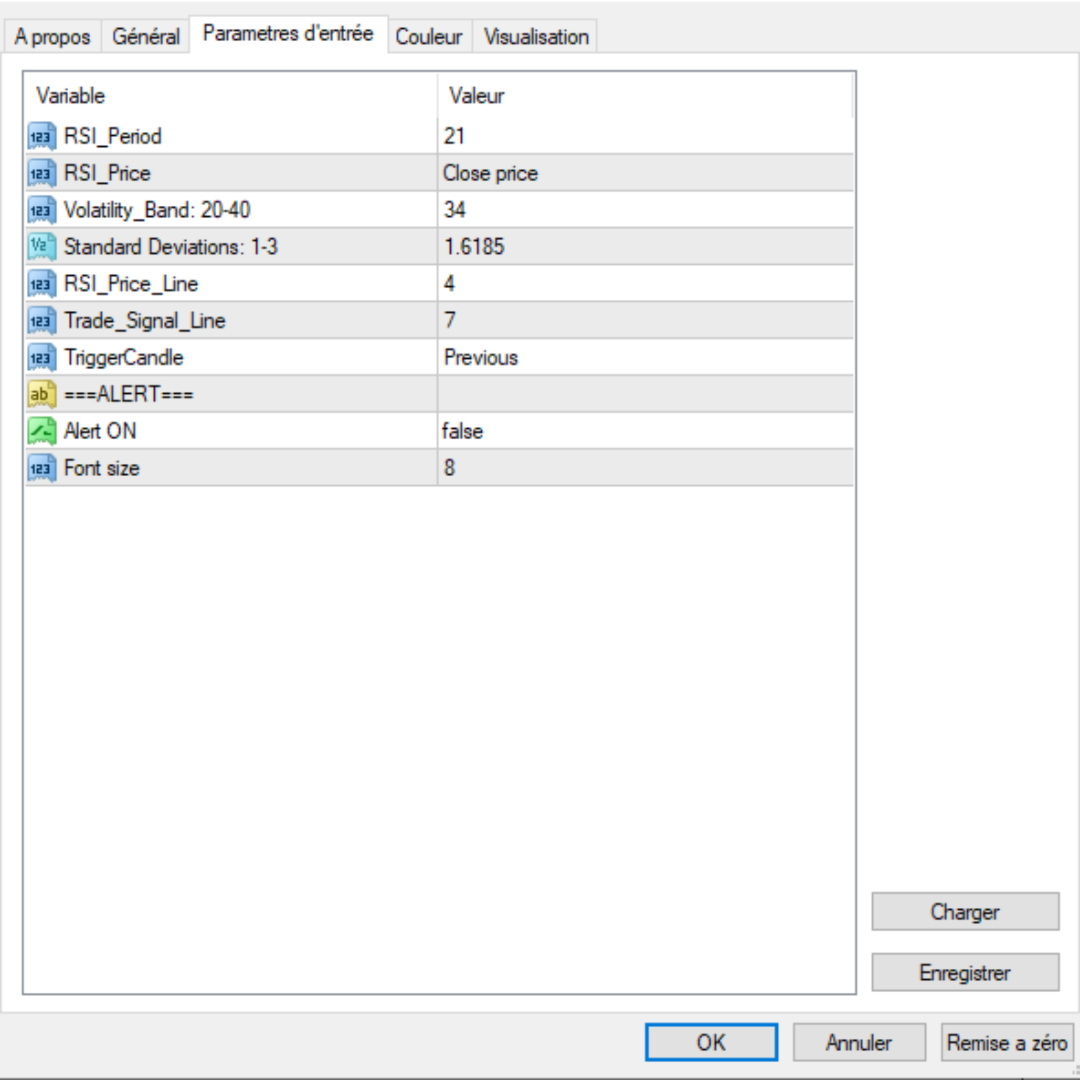
Technical Specifications & Input Parameters:
TDI Settings: Customizable RSI Period, Volatility Band, and RSI Price types.
Timeframe Selection: Toggle visibility for M1, M5, M15, M30, H1, H4, or D1.
Alert Configuration: Turn on/off alerts for multi-timeframe alignment or extreme market extensions (OVERBUY++ / OVERSELL++).
Optimize Your Workflow Today
Don't let market noise dictate your performance. Elevate your technical analysis, Master your daily bias, and secure your execution edge with the ultimate institutional trading companion.