 MetaTrader 5
 Uzmanlar
 Göstergeler
 Kütüphaneler
 Yardımcı programlar
 Widget'lar
 Kurallar
YouTube'dan Mağaza ile ilgili öğretici videoları izleyin
Bir alım-satım robotu veya gösterge nasıl satın alınır?
Uzman Danışmanınızı
sanal sunucuda çalıştırın
sanal sunucuda çalıştırın
Satın almadan önce göstergeyi/alım-satım robotunu test edin
Mağazada kazanç sağlamak ister misiniz?
Satış için bir ürün nasıl sunulur?
MetaTrader 5 için ücretsiz Uzman Danışmanlar ve Göstergeler - 94
 Forex alım-satımını daha karlı hale getirmek için alım-satım robotları ve göstergeler kullanın. Alım-satım robotları, işlem açma ve kapatma sürecini otomatikleştirmenize olanak tanırken, göstergeler piyasa davranışını daha doğru bir şekilde tahmin etmenize yardımcı olur.
Bu sayfa, MetaTrader 5 uygulamalarının kataloğunu içermektedir.

Prop Guardian — Günlük Kayıp ve Drawdown Monitörü (Ücretsiz) OneFunded'ın kendi yayınladığı verilere göre, başarısız olan prop firm değerlendirmelerinin %78,7'si genel drawdown nedeniyle değil, günlük kayıp limitinin ihlal edilmesiyle sonuçlanmaktadır. Çoğu trader stratejileri başarısız olduğu için kaybetmez; doğru anda gerçekten önemli olan tek sayı ekranlarında olmadığı için kaybeder. Prop Guardian bu sayıyı tam gözünüzün önüne getirir. NE YAPAR Hem günlük kayıp limitinizin hem de maksimum dra
FREE
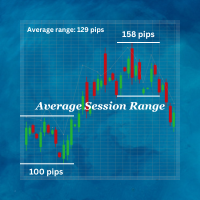
Average Session Range: Calculate and Average the Sessions High-Low Range of Specific Time Sessions Over Multiple Days. The Session Average Range is a sophisticated and precise tool designed to calculate the volatility of specific time sessions within the trading day. By meticulously analyzing the range between the high and low prices of a defined trading session over multiple days, this tool provides traders with a clear and actionable average range. **Note:** When the trading platform is closed
FREE

The Chicken Trader
Description: The Chicken Trader is a whimsical and entertaining trading algorithm inspired by the viral "Trading Chicken" sensation on social media. This Expert Advisor (EA) replicates the unpredictable trading style of the famous chicken, offering a lighthearted approach to trading.
Features: Random Market Direction : The EA randomly chooses between placing a Buy or Sell trade. Session Selection : It randomly selects one of the three major trading sessions for entry:
FREE

This is MT5 version ,MT4 version: https://www.mql5.com/zh/market/product/135163 Warning: This is Martingale EA, with extremely high risk!!! Expert Advisor (EA) is not omnipotent, using this EA means agreeing to bear the risk of all losses incurred by the EA Trading financial products such as foreign exchange and gold are high-risk products that may result in zero principal. Please be aware of the risks before trading
This is Laodengxi 429 EA FREE! This is a Martingale EA
FREE
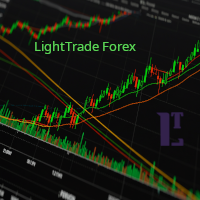
EMA Line Visualizer with Trend Analysis Description:
The Exponential Moving Average (EMA) Line Visualizer EA plots multiple EMAs on your chart (25, 50, 100, 200, and a custom EMA) and analyzes real-time trend direction. It detects whether the market is currently in an Uptrend , Downtrend , or Flat condition based on the latest EMA relationships. Features: Multi-EMA Display
Plot multiple EMAs with customizable periods. Custom Colors
Set distinct colors for each EMA line for better visual trac
FREE

Kurmadan önce: bu aracın yapmadıkları. Önce bunu okuyun. Aradığınız şey aşağıdakilerden biriyse, bu yanlış araçtır ve bunu grafiğinize eklemeden önce bilmek daha iyidir.
- Sanal veya gizli stop asla yoktur. Her stop, brokerınıza ve prop firmanıza görünür, gerçek bir broker tarafı stop emridir. Tasarım gereği hiçbir şey hiçbirinden gizlenmez. - Grafik başına tek sembol. Ücretsiz sürüm, eklendiği grafiğin sembolünü işlem yapar. Marj alanı projeksiyonu, bu panelin bu semboldeki kendi işlemlerini
FREE

Click2FiboDrawer – Instantly Draw Fibonacci Retracement Lines with 2 Clicks Click2FiboDrawer is a powerful manual drawing tool for discretionary traders who use Fibonacci retracements in their technical analysis.
With just two mouse clicks, you can draw clean and precise Fibonacci levels directly on your chart — no clutter, no menus, no hassle. Even during fast-paced scalping sessions, this tool enables you to quickly add Fibonacci retracement levels and react to market moves in real-time.
It’s
FREE

LM Donchian Channel MT5 LM Donchian Channel MT5 is a clean and configurable technical indicator for MetaTrader 5. It displays the highest high and lowest low over a selected number of bars, creating a channel that helps users visualise recent price ranges on any chart and timeframe. The indicator is based on the classic Donchian Channel concept: Upper Channel: Highest high over the selected lookback period. Lower Channel: Lowest low over the selected lookback period. It can be used as part of yo
FREE

Pivot Point Slim Indicator Overview A professional-grade pivot point indicator equipped with 6 types of pivots. With a clean, easy-to-read design, it automatically displays important support and resistance levels on your chart. Customizable Display Settings Individual color settings for each level (P, S1-S5, R1-R5) Show/hide toggle for each level Label display on/off Price display on/off Label position (left/right) Label offset adjustment (spacing between lines and text) Line width adjustment Hi
FREE

This indicator is based on the Moving Average indicator. It helps the user identifying whether to buy or sell. It comes with an alert that will sound whenever a new signal appears. It also features an email facility. Your email address and SMTP Server settings should be specified in the settings window of the "Mailbox" tab in your MetaTrader 5. Blue arrow up = Buy. Red arrow down = Sell. Line = Trailing Stop. You can use one of my Trailing Stop products that automatically move the Stop Loss and
FREE

Free Global Stop Loss and Take Profit Setter with Break Even
Free one click Stop Loss and Take Profit tool for manual trading. Apply a fixed SL and TP to every open position on the symbol, or move them all to break even, with a single button. It only modifies Stop Loss and Take Profit levels — it never opens or closes a trade. Set your SL and TP distance in points, click once, and every position on the current symbol is protected. The break even button moves stops to entry (or a configurable num
FREE

EXPERT AMAZO DEMO é um Expert Advisor projetado especificamente para negociar WIN (mini índice) e WDO (mini dólar) e para ser usado somente em contas DEMO. A operação é baseada na abertura de ordens utilizando alguns indicadores como Sars parabólicos, médias móveis, Bandas de Bollinger, Fibonacci, etc., trabalhando de acordo com 3 modalidades de estratégia, o AMAZO procura prever os movimentos do mercado com operações contra ea favor da tendência.
Entre em nosso Grupo de WhatsAp
FREE

Ultimate Candle Countdown – Bir Daha Asla Mum Kapanışını Kaçırma! Ultimate Candle Countdown ile işlem hassasiyetini bir üst seviyeye taşı – tüm zaman dilimlerinde ve tüm enstrümanlarda çalışan sade, hafif ve güçlü bir mum geri sayım aracı.
İster M1’de scalping yapıyor olun, ister H1’de swing trade ediyor olun ya da günlük/haftalık kapanışları takip edin – bu araç, bir sonraki mum açılmadan önce ne kadar süre kaldığını her zaman kesin olarak bilmeni sağlar. Artık tahmine gerek yok – dikkatli
FREE

RaysFX Elastic Order Flow Matrix (EOFM) L'indicatore definitivo per gli Scalper e i Day Trader che operano su timeframe rapidi (M1). Il RaysFX Elastic Order Flow Matrix non è un semplice oscillatore. È un motore analitico avanzato progettato per decodificare la vera pressione compratrice o venditrice del mercato, filtrando il "rumore" tipico dei grafici a 1 minuto. Se sei stanco di farti fermare dai falsi segnali generati dalle candele di basso volume o dalla congestione, questo strumento ti
FREE

Correlation Coefficient PRO + Moving Average Advanced dual-asset correlation indicator with dynamic smoothing Overview Correlation Coefficient PRO + MA is a powerful indicator that measures the statistical correlation between the current chart symbol and any secondary instrument in real time. Displayed in a separate window, it gives traders an immediate visual reading of how two assets move in relation to each other — whether they trend together, diverge, or move inversely. The built-in Moving A
FREE

Samurai VFX Samurai VFX is a visual indicator that displays an animated samurai character directly on the chart window. It does not generate trading signals and does not modify chart data. The indicator is intended to enhance the visual appearance of the trading workspace. Features The indicator renders an animated samurai figure with multiple visual phases that cycle automatically. Each phase presents a different pose and visual effect, including a resting stance, energy aura, and a charge seq
FREE

Attention ! !! Buffer indicator, PERFECT FOR USE IN THE EXPERT ADVISOR! The DynamicFibo indicator automatically indicates horizontal Fibonacci levels on the chart online. The levels are recalculated automatically online. The levels can be calculated from the current chart as well as from any other time frame. It is convenient to use levels from an older time frame, and trade on a shorter time frame. Any levels are set manually in the indicator settings. IT is IMPORTANT to separate the levels i
FREE

RBM Volume Real PRO 3.0
RBM Volume Real PRO 3.0 was developed to transform volume data into actionable market intelligence. While most traders focus exclusively on price movement, this indicator allows users to identify the participants truly driving the market by revealing the balance of power between buyers and sellers in real time.
The first component is Buy Volume, which represents the aggression of participants willing to execute orders at the asking price. Conversely, Sell Volume measur
FREE

This is a very simple backtesting tool. It starts from the most old chart in the past chart. It has 0.2pips spread, and you can do averaging 10 times. You can set the size of bars and the time frame as a parameter. You can't change the time frame during the backtest. These are the functions of buttons. ------------------------------------------------------------ Resume/Pause: Auto scroll stop and resume. Next bar: Showing candle sticks one by one. Speed1,2,3: The speed of auto scroll. Skip: ski
FREE
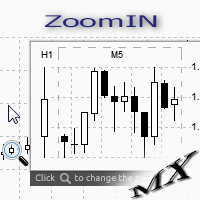
The ZoomIN MT5 indicator is designed for quickly viewing the selected bar on the smaller timeframes in a pop-up window. Once launched, the indicator works in the background, does not take up space on the chart and does not consume system resources. When the indicator is activated by the Shift + i combination (can be changed in the settings), a pop-up window with a chart of a smaller timeframe is created. The displayed timeframe can be changed by a left-click on the magnifying glass icon. To hide
FREE
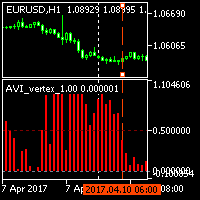
The indicator displays trend slowdown or possible end of trend and price reversal. The indicator has no parameters. When red bars appear and when they become shorter, we can talk about the approaching end of the downtrend. When green bars become shorter, we can expect the approaching end of the uptrend.
FREE

Signal Navigator - Multi-Timeframe Trend and Momentum Indicator for MetaTrader 5 Signal Navigator is a technical analysis indicator for MetaTrader 5 that combines trend analysis, momentum confirmation
and multi-timeframe market information in a single chart interface.
The indicator uses Moving Average slope analysis together with RSI conditions to evaluate the current market direction and
generate visual Buy and Sell signals. In addition, it provides an overview of the trend situation across sev
FREE
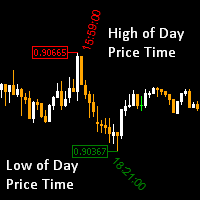
High of the Day and Low of the day Time and Price Fractal Studies is an indicator that will help you identify certain patterns that tend to repeat themseleves at certail times of the day or at certain prices.
It is used to study Daily Highs ad Lows in relation to time and price.
You will get to answer certail questions like:
At what time of day does this market usually turn around. At what price does the market turn. Is it at round numbers etc
FREE
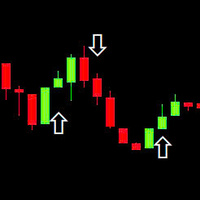
This indicator is based on the RSI (Relative Strength Index) to identify potential Breakout points and draw arrows on the chart to suggest buy/sell signals. Use RSI to find breakout signals. Draw Buy/Sell arrows on the chart. Send alerts when there is a trading signal. Buy (Orange Arrow - 0xFFAA00): When a buy signal appears. Sell (Blue Arrow - 0x0000FF): When a sell signal appears. DRAW_ARROW: Used to draw arrows on the chart.
FREE
BBTrend is a powerful trend analysis tool designed to provide a clear overview of market volatility and trends at a glance.
This indicator calculates the difference between two Bollinger Bands of different periods,
visually indicating the strength of upward or downward trends to traders. Clear Trend Visualization: The upward trend is represented in green, and the downward trend in red,
allowing traders to intuitively grasp the direction and strength of the trend. Standardized Percentage Disp
FREE
The Kalires Channel Indicator is a technical indicator used to evaluate trend direction and potential trading opportunities. This is a hybrid indicator that combines Kauffman Adaptive Moving Average (KAMA), linear regression and smoothing. The Kalires Channel Indicator consists of two lines: one central and two outer bands. The central line is a smoothed KAMA modified according to the direction of the trend. The outer bars represent two linear regression lines drawn above and below the center l
FREE
A simple tick indicator of Bid and Ask prices. The period separator (1 minute) is displayed as a histogram. Parameters Show Bid Line - show/hide the Bid line; Show Ask Line - show/hide the Ask line; Show Labels - show/hide the last price values.
FREE

This indicator shows the direction of the trend and trend change. Ganesha Trend Viewer is a trend indicator designed specifically for gold and can also be used on any financial instrument. The indicator does not redraw. Recommended time frame H1. Ganesha Trend Viewer is perfect for all Meta Trader symbols. (currencies, metals, cryptocurrencies, stocks and indices..)
Parameter setting
MA Short Period ----- Moving Average short period MA Long Period ----- Moving Average long period Alerts ON
FREE
Hello, This indicator is a unique high reliability 7-in-1 multicurrency indicator comprising these sub-indicator’s: A Trend Power Crossover Indicator. A Percent Change Crossover Indicator. A Currency Overbought/Oversold Indicator. A Currency Deviation Indicator. A Currency Impulse Signal Indicator. A Trend Power Indicator. A Currency Volatility Indicator. The main advantage of this indicator is that it's reasoning by currency and not by currency pair. The values of each sub-indicator are calcula
FREE
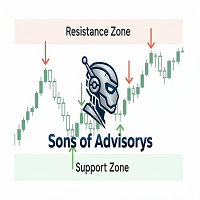
Sons of Advisorys: QuantumLevel This advanced MT5 Expert Advisor automates trading decisions based on a robust Support and Resistance breakout and retest strategy. It performs multi-timeframe analysis across H4, H1, and M15 charts to identify high-probability trade setups with precise zone validation. Key Features: Strategy: Support/Resistance breakout with retest continuation. Multi-Timeframe Detection: Independent analysis and toggle options for H4, H1, and M15 timeframes. Auto-Trading:
FREE

OmniChart is a lightweight, ultra-smooth Picture-in-Picture (PIP) chart indicator designed for professional traders who need seamless multi-timeframe analysis. Keep a close eye on lower timeframes (like M1 or M2) directly on your higher timeframe chart (like M15 or M30) without cluttering your workspace or switching profiles! Designed with a focus on pure price action , OmniChart removes all distractions. No grids, no confusing axes, no volumes—just pure, clean candlesticks to help you spot
FREE

Multi-timeframe trend indicator based on the ADX / ADXWilder indicator with Fibonacci levels
The indicator shows trend areas using ADX or ADXWilder indicator data from multiple timeframes. The impulse mode of the indicator allows you to catch the beginning of a trend, and several "Screens" with different timeframes allow you to filter out market noise. Fibonacci levels are added to the price chart, which have flexible settings.
How the indicator works: if PDI is greater than NDI, then it`s
FREE

Collective TP SL Manager is a MetaTrader 5 utility that manages a combined take-profit and stop-loss across many open positions on one symbol. Instead of setting TP/SL per order, it watches the net profit or loss of all (or filtered) positions and closes the basket when your target is reached. Features Basket-level targets: one collective take-profit and one collective stop-loss for the whole group of positions. Net P/L monitoring: continuously sums the profit/loss of all selected positions in
FREE
Introduction to GARCH Indicator GARCH is the short initial for Generalized Autoregressive Conditional Heteroskedasticity and it is the volatility prediction model commonly used in financial industry. GARCH model was first appeared in the work by Danish Economist, Tim Peter Bollerslev in 1986. The 2003 Nobel Prize winner, Robert F Engle also added much contribution for the refinement of GARCH model with Tim’s work. Our GARCH INM predictor took the original method of Nelder Mead for GARCH model bu
FREE

Reversal Oscillator — Advanced Momentum Shift Detector
Reversal Oscillator is a free indicator designed to highlight price zones that are statistically outside their normal movement patterns, helping traders anticipate potential turning points before they occur. Unlike traditional oscillators that react mainly to overbought/oversold conditions, this indicator applies third derivative analysis (the "acceleration of the acceleration" of price) calculated using two independent methods within a n
FREE

After downloading, message me via MQL5 inbox to receive your FREE User Kit - setup guide, practical checklist, and workflow resources built specifically for XAUUSD traders. If you've been trading Gold long enough, you already know the drill. Before the session opens, you pull up the chart and start looking for the same levels you've been marking every week: previous week high, previous week low, the midpoint, and yesterday's high and low. You draw them manually, label them, and keep an eye on t
FREE

Non-proprietary study of Joe Dinapoli used for overbought/oversold evaluation. Uses of Detrended Oscillator indicator Profit taking. Filter for market entry technics. Stop placement. Part of volatility breakout pattern. Determining major trend changes. Part of Dinapoli Stretch pattern. Inputs lnpPeriod: Perid of moving average Method: Calculation method ********************************************************************************* If you want to know market Overb
FREE

The indicator ColorCandlesDaily draw candles with different colors depending on the day of the week.
FREE

Path of Candle Stick (Version.2) — Advanced Multi-Bollinger Band Volatility Navigator. "Not flawless, but priceless in purpose."
*** Push notifications are now available in this second version. "เปิดใช้งานระบบแจ้งเตือนแบบ Push notification แล้วในเวอร์ชันที่สองนี้"
Path of Candle Stick - The Quad-Bollinger Band Signal for MT5. *** Stop guessing where the next candle will close! *** Stop trading inside messy, cluttered charts! Maps out the exact mathematical corridors of the market using
FREE
Bu projeyi seviyorsanız, 5 yıldız incelemesi bırakın. Kurumsal ticaret büyük hacimler olarak, onlar için nadir değildir
pozisyonlarını belirli oran seviyelerinde savunur. Bu seviyeler, kullanabileceğiniz doğal bir destek ve direniş olarak hizmet
edecektir
Ya bir ticarete girmek ya da pozisyonunuza karşı olası tehlikelerin farkında
olmak. Bu osilatör size yüzde varyasyonu gösterecektir: Gün. Hafta. Ay. Mahallesi. Yıl. Destek ve direnişlerinizi takip ettiğiniz bir subwindow'da.
FREE

Her yatırımcı bu ritüeli bilir: gösterge ayarlarını aç, bir sayıyı değiştir, OK'e bas, gözlerini kısarak grafiğe bak, yanlış olduğuna karar ver, ayarları yeniden aç. Relative Vigor Index'te ayarlanacak tek bir sayı vardır — periyot — ama kendi enstrümanınızda 10 ile 14'ü karşılaştırmak istediğiniz her seferde, o tek diyalog turu size yine aynı dene-ve-gözünü-kıs döngüsüne mal olur. RVI Live Tuner buna son veriyor. Bu, doğrudan grafik üzerinde, canlı olarak ayarladığınız klasik iki çizgili RVI'dı
FREE

One of the simplest Pivot Point indicator, easy to operate, and most complete for a single chart in determining Resistance and Support level lines.
In single chart, it will show R&S Level Line with 5 popular types of Pivot Point, Highest&Lowest of closing price Include the Trend and up to 3 Time Frames.
Five types (Floor, Woodie, Camarilla, DeMark, & Fibonacci) of popular Pivot Points in determining Resistance and Support levels. With just using simple button on the
FREE

Volatility Channel Indicator Ride the Waves of Market Volatility with Precision ... please leave a 5 star rating if you love this product The Indicator is free. The source code is available for just 30usd.
Are you tired of entering trades too early or too late? Missing breakouts? Getting caught in false signals? The Volatility Channel Indicator transforms chaotic price action into crystal-clear trading opportunities. What You Get (MT4 & MT5) Smart Channel Bands that
FREE

The FXmans Position Calculator is a high-precision trading tool designed for algorithmic risk management. Below is an explanation of its core components and functions in English: 1. Risk Management Engine The indicator calculates your position size based on the specific risk you are willing to take per trade. Risk Mode: You can toggle between Percent (a fixed percentage of your account balance) or Fixed USD (a static dollar amount). R/R Ratio: This determines where your Take Profit (TP) level
FREE

Trade Manager Pro is a professional MT5 trade management panel designed to simplify and speed up your trading execution. Open, manage, and close trades directly from your chart with one click — no manual calculations or menu navigation required. Key Features Automatic Risk-Based Lot Size Calculates position size automatically based on: Account balance Risk percentage Stop Loss distance Works on all instruments: Forex, Gold, Crypto, Indices One-Click Trade Execution Instantly open BUY a
FREE
“Step Channel Momentum Trend” Göstergesi (MT5 Indicator) Step Channel Momentum Trend , piyasa yapısını dinamik volatilite analizi ile birleştirerek ticaret yapanlara uyum sağlayan bir avantaj sunmak üzere tasarlanmış güçlü bir momentum tabanlı göstergedir. Bu araç, gecikmelere duyarlı düzeltme yöntemlerine güvenmeden, benzersiz bir basamak orta çizgisi ve ATR firmasından filtrelenmiş bir kanal kullanarak trend ile aralığı net bir şekilde ayırt etmeye yardımcı olur. Ana Özellikler Yapısal Basamak
FREE

Risk Basket Planner Risk Basket Planner , MetaTrader 5 için manuel sepet risk planlama aracıdır. Birden fazla giriş seviyesi planlamaya, teknik Stop Loss belirlemeye ve manuel işlemden önce her katmanın lot miktarı ile gerçek riskini hesaplamaya yardımcı olur. Başlıca Özellikler 1 ile 5 giriş katmanı planlama. BUY veya SELL yönü seçimi. Risk, hesap Equity yüzdesi olarak belirlenir. L1-L5 fiyatları yazılabilir veya grafik üzerinde sürüklenebilir. Tüm katmanlar için ortak Technical Stop Loss . Aut
FREE

Bu, ihtiyaçlarınız için kullanabileceğiniz Ücretsiz bir üründür!
Bu göstergeyi beğendiyseniz, lütfen kısa ve olumlu bir geri bildirim bırakın! Çok teşekkürler!
Yüksek kaliteli Trading Robotları ve Göstergelerini görmek için buraya tıklayın!
MT5 için Forex Göstergesi SWAP Ekranı, harika bir yardımcı ticaret aracı. - SWAP Ekranı göstergesi, eklendiği forex çiftinin uzun ve kısa işlemleri için geçerli SWAP'ları gösterir. - SWAP Ekranı değerlerini grafiğin herhangi bir köşesinde bulmak mümkündür
FREE
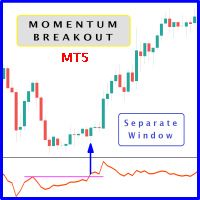
When prices breakout resistance levels are combined with momentum oscillator breaks out its historical resistance levels then probability emerges to record farther higher prices. It's strongly encouraged to confirm price breakout with oscillator breakout since they have comparable effects to price breaking support and resistance levels; certainly short trades will have the same perception. Concept is based on find swing levels which based on number of bars by each side to confirm peak or trough
FREE

Hello, trading champs! I trust you are doing well. Have you experienced entering a position where the market initially moves in your favour or approach your takeprofit then suddenly the market reversed opposite your position? Well, it has happened to me numerous times and today I decide to fight back.
I present to you a trade manager that help you protect your position(s). This project helps you set your position(s) to breakeven either when a certain amount of pips you specify is reached or a
FREE

MSX Heikin Ashi Advanced Overview MSX Heikin Ashi Advanced is a MetaTrader 5 indicator designed to provide a smoothed visual representation of price movement using a modified Heikin Ashi calculation. The indicator applies Heikin Ashi calculations to user-selected price sources and displays color-based candles that may assist with trend observation and market structure analysis. Features • Modified Heikin Ashi candle calculation • Real-time candle updates • Multiple applied price options • Color
FREE

Candle color RSI (Relative Strength Index) indicators change candlestick colors on the price chart to visually show RSI conditions like overbought/oversold levels or bullish/bearish momentum, using colors like red for overbought/bearish and green for oversold/bullish, helping traders spot reversals or strength at a glance without looking at the separate RSI pane. These custom indicators often color candles red above 70 (overbought), green below 30 (oversold), and keep default colors in between
FREE
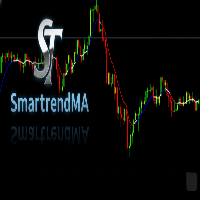
A SmartTrendMA foi projetada para identificar melhor zonas de alta, baixa e consolidação, azul alta, vermelho baixa e branco consolidação, vai te auxiliar a identificar melhor a tendência. Em parâmetro regule melhor conforme sua preferência em grau pois cada par de moeda se adequa diferentemente a cor,mude também o período e se quiser mude exponencial ou simples.
FREE

Sentimento de Mercado é um indicador que usa os dados do nosso principal indicador: Market Strength Radar.: https://www.mql5.com/pt/market/product/114568?source=Site +Profile+Seller Ele imprime um gráfico de linhas que deve ser comparado com o gráfico de preço para entendermos o sentimento do mercado. As divergencias são pontos importantes de inflexão. As convergências mostram força da tendência atual.
FREE
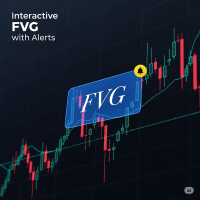
FVG Indicator with Alerts Description: This is a simple and effective indicator for identifying and displaying Fair Value Gaps (FVGs) on any timeframe. The indicator helps you see important price imbalances and provides powerful interactive tools for your analysis. Key Features: Detects FVGs: Clearly identifies and draws boxes around Bullish and Bearish Fair Value Gaps. Midline Level: Displays the 50% equilibrium level inside each FVG box, a critical point of interest. Complete Alert System: Rec
FREE
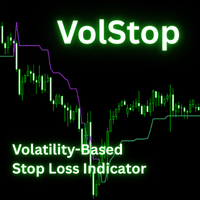
The VolStop Adaptive Volatility-Based Trailing Stop Indicator for MT5 VolStop is a precision volatility-stop indicator for MetaTrader 5, built for traders who want to stay in winning trades longer and exit with discipline. Instead of fixed pips or moving averages, VolStop dynamically tracks price action with ATR-based bands, automatically adapting to market turbulence. Key Features Adaptive Volatility Stops – Calculates a dynamic trailing stop using ATR and a user-set multiplier to match changi
FREE

The euro index on your chart, built live from your own broker's five euro pairs. When EURUSD falls you cannot tell from EURUSD alone whether the euro is weak or the dollar is strong. An index answers it. Put this under any chart and you are looking at the euro on its own terms, measured against the pound, the yen, the franc and the krona as well as the dollar. It uses the New York Board of Trade Euro Currency Index formula. EUR/USD 31.55% EUR/GBP 30.56% EUR/JPY 18.91% EUR/CHF 11.13% EUR/SEK 7.85
FREE

FVG Concept and Market Structure (MS) Indicator – Comprehensive Analysis with Interactive Control This is not just an indicator. It is a useful tool for market analysis. This indicator combines several analytical functions, making it one of the more complete solutions in its field. This tool represents a comprehensive solution for analyzing market behavior with the goal of forecasting the direction of price movement. The indicator is designed to assist the trader and not distract them with unnec
FREE

BS Trade Panel: Revolutionize Your Trading Approach Introducing the BS Trade Panel , the ultimate solution for traders seeking efficiency, speed, and accuracy in their market operations. Crafted with cutting-edge technology, our panel is designed to simplify your trading, making it more intuitive, swift, and effective. Innovative Features: Quick Orders with Shortcut Keys: Execute market orders or pending orders swiftly using configurable shortcut keys. Perfect for traders who need speed when ent
FREE

QuantumFX Trade Manager Advanced Order & Risk Control Utility for MT5 QuantumFX Trade Manager is a powerful, professional-grade trade management utility designed for traders who want absolute control over execution, risk, and position handling — directly from an intuitive on-chart panel. Built for manual, semi-automated, and discretionary traders , QuantumFX transforms MetaTrader 5 into a precision trading workstation , allowing you to manage trades faster, safer, and smarter. What
FREE

Introducing Steady Runner NP EA (Free Version): Precision Trading for GBPUSD M5 What is Steady Runner NP EA?
Steady Runner NP EA is a mathematically designed Expert Advisor (EA) exclusively crafted for the GBPUSD M5 timeframe . Built with advanced algorithms and statistical models, this EA automates your trading strategy to deliver precision, consistency, and discipline in every trade. Whether you're a seasoned trader or just starting out, Steady Runner NP EA is your reliable par
FREE

Mahdad Candle Timer , MetaTrader 5 için hafif ve hassas bir indikatördür. Mevcut mumun kapanmasına kalan süreyi doğrudan son barın yanında gösterir. Scalping, gün içi işlemler veya swing stratejilerinde mum kapanış onayı bekleyen, zamanlamaya önem veren trader’lar için tasarlanmıştır. Temel Özellikler Doğru geri sayım – Kalan süre HH:MM:SS formatında (opsiyonel milisaniye) Dinamik konumlandırma – Grafik ölçeği veya yakınlaştırmadan bağımsız olarak her zaman son mum ile hizalı Akıllı renk uyu
FREE

Multi-timeframe trend indicator, based on the ADX / ADXWilder indicator The indicator shows trend areas using ADX or ADXWilder indicator data from multiple timeframes. The impulse mode of the indicator allows you to catch the beginning of a trend, and several "Screens" with different timeframes allow you to filter out market noise.
How the indicator works: if PDI is greater than NDI, then it`s bullish movement; if PDI is less than NDI, then it`s bearish movement; to determine any trend, it is
FREE

DS Trend is a free trend indicator that colorizes candles directly on the chart, making it easy to identify the current market direction at a glance.
Candle colors: - Blue: uptrend in progress - Gray: neutral market / consolidation - Red: downtrend in progress
Parameters: - Period (default 20): controls the indicator responsiveness to recent price action - Sensitivity (default 2): adjusts the threshold for trend detection
Works on all symbols and timeframes. No repainting. Simple visual read
FREE
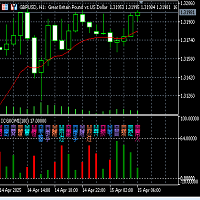
Fuxi Guaxiang Dual-color Oscillation Indicator Function and Usage Instructions (V2.1)
Fuxi Guaxiang Dual-color Oscillation Indicator Instructions: (1) This Guaxiang change indicator is based on the Yin-Yang transformation thought of the "Book of Changes" philosophy in ancient Chinese culture, integrating the results of the long-short game in each candlestick K-line period of the financial trading K-line chart, using China's oldest predictive coding method, in the form of the 64 Guaxiang of the
FREE

This indicator, the Phoenix Moving Average Panel, is a professional-grade visual dashboard designed to remove guesswork from trend-following strategies. It transforms a standard Moving Average into a functional trading workstation. Here is how it assists a trader in making precise decisions: 1. Identifying the Buy/Sell Zone (The Trend Matrix) Instead of looking at just one line, the panel provides a Three-Tier Trend Confirmation: Current Trend: Shows the immediate momentum on your active chart.
FREE
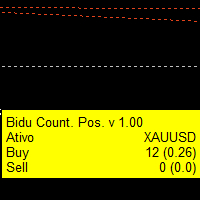
Indicador que cria um painel para acompanhamento to total de posições abertas no ativo do gráfivo.
São apresentados os dados: Ativo do gráfico Total de posições de venda em aberto Quantidade do volume de posições de venda em aberto Total de posições de compra em aberto Quantidade do volume de posições de compra em aberto.
Painel simples mas eficiente para o equilíbrio das ordens
FREE

パラボリックのデータをもとにトレンドの方向性を1分足から月足まで表示します。 1分足から 月足 まで表示されているので今どの方向に価格が動いているのかがすぐに分かります。
更新はティク毎ではなくディフォルトでは1秒毎、もちろん変更も可能なのでチャートの表示が遅くなるようなことはありません。
機能:
どの通貨でも表示可能になります。
アイコンの色を指定することが可能になります。
表示位置(X軸、Y軸)が変更可能 になります。
表示位置 (左上 、 右上 、 左下 、 右下) が 指定 が可能 になります。
フォント を指定することが可能になります。
フォントサイズ が 変更可能 になります。
アイコンのサイズ が 変更可能 になります。
週足、 月足 の非表示 が 可能 になります。
FREE

This MQL5 script is a Dynamic Support & Resistance (S/R) Investigator. It functions as a real-time analytical tool that identifies key price levels and mathematically evaluates their "durability" based on historical interactions. Unlike static indicators, it uses a custom Graphical User Interface (GUI) to provide a live dashboard of market structure. 1. Level Detection Logic The indicator scans the most recent InpPeriod (lookback) of bars to identify the absolute highest peak (Resistance) and t
FREE

"Driver Road Bands" indicator that is designed to be used in the 1H, 4H and 1D timeframes in the most ideal way. If we compare timeframes to roads and streets; main streets and highways with high traffic volume are similar to high-time timeframes in technical analysis. If you can interpret the curvilinear and linear lines drawn by this indicator on the graphic screen with your geometric perspective and develop your own buy and sell strategies; you may have the key to being a successful trader.
FREE
MetaTrader Mağazası, alım-satım robotları ve teknik göstergeler satmak için en iyi yerdir.
MetaTrader platformu için ilgi çekici bir tasarıma ve iyi bir açıklamaya sahip bir uygulama geliştirmeniz yeterlidir. Milyonlarca MetaTrader kullanıcısına sunmak için size ürününüzü Mağazada nasıl yayınlayacağınızı açıklayacağız.

Alım-satım fırsatlarını kaçırıyorsunuz:
- Ücretsiz alım-satım uygulamaları
- İşlem kopyalama için 8.000'den fazla sinyal
- Finansal piyasaları keşfetmek için ekonomik haberler
Kayıt
Giriş yap
Web sitesi politikasını ve kullanım şartlarını kabul edersiniz
Hesabınız yoksa, lütfen kaydolun